INTRODUCTION
Diabetic macular edema (DME) is the leading cause of vision loss in diabetic individuals, although there are diferent treatments that can delay this impairment(1-3). This complication occurs mainly because of the diabetic retinopathy (DR), a vascular complication of diabetes that frequently is diagnosed and treated later than it should, when the conditions that impair vision already took place. The DR
deve-lopment and severity are related to the metabolic control of diabetes. In Brazil, there are about 11.50 million people with diabetes and 5.50 million carry diabetic retinopathy(4).
The most commonly accepted pathophysiological theory for DR is the microvascular dysfunction. Changes in the glucose metabolism lead to alterations in the retinal capillaries and to the hemato-retinal barrier break, resulting in microaneurysms, hemorrhages and
exu-Correlation between central subfield thickness, visual acuity and structural changes
in diabetic macular edema
Correlação entre a espessura do subcampo central, a acuidade visual e mudanças estruturais
no edema macular diabético
Rosana ZacaRias HannoucHe1, MaRcos PeReiRade Ávila2, david leonaRdo cRuvinel isaac3, RodRigo salustiano coRRêae silva1, alan RicaRdo Rassi3
Submitted for publication: November 21, 2011 Accepted for publication: March 25, 2012
Study carried out at Department of Ophthalmology of Reference Center for Ophthalmology (CEROF), Universidade Federal de Goiás - UFG - Goiânia (GO), Brazil.
1 Physician, Reference Center for Ophthalmology, Universidade Federal de Goiás - UFG - Goiânia
(GO), Brazil.
2 Professor, Department of Ophthalmology, Universidade Federal de Goiás - UFG - Goiânia (GO), Brazil. 3 Physician, Faculty of Medicine, Universidade Federal de Goiás - UFG - Goiânia (GO), Brazil.
Funding: A doctoral scholarship was given by CAPES to the first author.
Disclosure of potential conflicts of interest: R.Z.Hannouche, None; M.P.Ávila, None; D.L.C.Isaac, None;. R.S.C.Silva None; A.R.Rassi, None.
Correspondence address: Rosana Zacarias Hannouche. Rua 82, número 279, 1101, Setor Sul - Goiânia - GO - 74083-010 - Brazil - E-mail: [email protected]
Projeto n: 166/2009. Comitê de Ética em pesquisa humana e animal do Hospital das Clínicas da Universidade Federal de Goiás.
ABSTRACT
Purpose: To correlate the central subield thickness (CST) measured by CirrusTM
SD-OCT with best-corrected visual acuity (BCVA) and structural changes in diabetic macular edema (DME).
Methods: The transversal study evaluated 200 patients with non-proliferative dia betic retinopathy (NPDR) and selected 55 eyes with DME between January, 2010 and April, 2011. Spectral domain OCT was performed in patients with type 2 diabetes and DME. CST and BCVA were correlated with the edema morphology and the ELM (external limiting membrane) integrity. Statistical tests were applied to validate the results.
Results: There was no diference between genders in the NPDR classiication. 47.3% of the patients showed moderate NPDR. The CST average for male was of 393.58 µm and 434.16 µm for female, with no statistically signiicant diference. The patients with continuous ELM showed lower CST average (368.73 µm) than those with disrupted ELM (521.43 µm). There was a strong correlation between the macular volume and CST (59.63%), but poor correlation between age and CST (2.9%). Also, there was a signiicant diference between the average CST and the type of macular edema. Patients with serous detachment showed higher CST average (488.71 µm) than those with cystoid macular edema (CME) and difuse edema. Patients with severe NPDR showed higher CST average (491.45 µm), if compared to mild and moderate NPDR. Cystoid macular edema was the most common type of edema (49.1%) and showed the worse VA. Patients with disrupted ELM showed worse BCVA. Patients with higher CST showed worse BCVA. There was a signiicant diference between the CST average of the case group (407.6 ± 113,1 µm) and the control group (diabetic patients without DME: 252 ± 12.5 µm). There was also a signiicant diference in the BCVA variables and macular volume between case and control groups.
Conclusion: The study suggests that the CST of diabetic patients with edema is higher than the control group, the increase in CST of diabetic patients with edema leads to worsening of BCVA and macular volume. Continuous ELM showed lower CST average, and the serous detachment showed higher CST average. CirrusTM
proved to be an important tool in the DME evaluation.
Keywords: Diabetic retinopathy; Macular edema; Tomography, optical coherence
RESUMO
Objetivo: Correlacionar a espessura do subcampo central (ESCC) medida pelo CirrusTM
SDOCT com a acuidade visual (AV) e as mudanças estruturais no edema macular dia -bético (EMD).
Métodos: Um estudo transversal avaliou 200 pacientes com retinopatia diabética não proliferativa (RDNP) e selecionados 55 olhos com EMD entre janeiro de 2010 e abril de 2011. OCT spectral foi realizado em pacientes com diabetes tipo 2 e com edema macular diabético (EMD). A ESCC e a AV foram correlacionados com a morfologia do edema e a integridade da membrana limitante externa (MLE). Aplicaram-se testes estatísticos para validação dos resultados.
Resultados: Não houve diferença entre os sexos na classificação RDNP. 47,3% dos pacientes apresentou RDNP moderada. A média da ESCC no sexo masculino foi de 393,58 µm e no feminino de 434,16 µm, sem diferença estatística significativa. Pa cientes com MLE íntegra apresentaram menor média da ESCC (368,73 µm) que aqueles com MLE descontínua (521,43 µm). Encontrou-se forte correlação entre o volume macular e a ESCC (59,63%), porém pequena correlação entre a idade e a ESCC (2,9%). Encontrou-se diferença significativa entre a média da ESCC e o tipo de edema macular, aqueles com descolamento seroso apresentaram maior média de ESCC (488,71 µm). Pacientes com RDNP grave apresentaram maior média da ESCC (491,45 µm), quando comparados à RDNP leve e moderada. O edema macular cistoide foi o tipo de edema mais frequente (49,1%) e apresentou pior AV. Pacientes com MLE íntegra apresentaram melhor AV. Pacientes com maior ESCC apresentaram pior AV. Houve diferença significativa entre a média da ESCC do grupo de casos (407,60 ± 113,05 µm) e controle (diabéticos sem edema macular: 252,0 ± 12,46 µm). Também houve diferença significativa nas variáveis AV e volume macular entre o grupo de casos e controle.
Conclusão: O estudo sugere que a ESCC de diabéticos com edema é maior que o gru po controle; o aumento da ESCC de diabéticos com edema cursa com piora da AV e do volume macular. MLE contínua mostrou menor média da ESCC e o descolamento seroso mostrou maior média da ESCC. CirrusTM mostrou ser importante ferramenta na
avaliação do EMD.
dates, which in turn lead to detectable retinal thickening in the OCT (Optical Coherence Tomography)(5).
The use of the OCT was incorporated in the work routine of the ophthalmologist after studies demonstrated its collaboration on the detection of the disease. Besides conirming diagnostic impressions, the OCT monitors the pharmacological treatment of the macular edema and follows its progression(6). The introduction of the spectral domain OCT improved the clinical value of the evaluation of eyes with macular diseases, among them the DR. With advanced tech-nology, the CirrusTM SD-OCT (spectral domain) acquires data 70 ti mes faster (27.000 versus 400 A-scans per second) and with higher resolution (5 µm versus 10 µm of axial resolution in tissue) than pre -vious versions.
DME recognition in the macular exam is able to change the ma-nagement of the ophthalmologist, combining the diagnosis to the treatment decision, and to be indicative of photocoagulation and/or the use of antiangiogenics(7).
Blumenkranz et al. concluded that many factors inluence visual function in eyes with DME, including morphologic pattern of ede-ma (cystic or difuse retinal thickening), duration of retinal edeede-ma, retinal perfusion, total retinal volume, and vitreomacular interface abnor malities (posterior hyaloidal traction, epiretinal membrane, and serous or tractional retinal detachment(8).
Recent indings using CirrusTM SDOCT suggest a strong and re -liable correlation of photoreceptor outer segment length with vi sual acuity(9).
Otani et al. investigated the correlation of best-corrected visual acuity with foveal microstructural changes of the external limiting mem brane and the junction between the inner and outer seg-ments (IS/OS) of the photoreceptors in DME. SD-OCT showed that the integrity of these structures was more strongly correlated with best-corrected visual acuity when compared with central subield thickness in DME(10).
It is not possible to know if the average photoreceptor outer segment length shortening observed in DME is caused by multiple points of localized breakdown of the IS/OS junction or from genera-lized thinning of the photoreceptor outer segment. The reasons can be explained based on what is known about the pathophysiology of this disease, such as tissue ischemia, lipid and luid exudation and accumulation of toxic metabolic waste products and inlammatory mediators in DME(9). The visual acuity not always is improved after treatments of the macular edema, which suggests that macular thi-ckness is only one of the factors that worsen the visual function. That means that quantitative measurements may not explain all variations in visual acuity, therefore, other factors including macular ischemia and retinal cell function might be important as well.
Maheshwary et al. also considered the disruption of the IS/OS junction an important predictor of visual acuity in DME patients. The integrity of the IS/OS junction can be assessed by SD-OCT and the integrity of retinal architecture is related to inal visual acuity. These authors believe that the integrity of the foveal photoreceptor layer is an important predictor of visual acuity. Others factors considered by them as determinative are macular ischemia and accumulated subfoveal hard exudates. These quantitative data by SD-OCT are im-portant to correlate retinal morphology and visual acuity in DME(11). Similar importance was given by Alasil et al. According to them, photoreceptors outer segment thickness is a predictor of function acuity in patients with DME, and the integrity of IS/OS junction is correlated to CST and visual acuity(12).
The study analyzed, using CirrusTM SD-OCT, the CST, the edema morphology and the ELM integrity, and correlated them with BCVA in the NPDR.
METHODS
The transversal work began after approval from the Ethics Com-mittee/Investigational Review Board. The population under study
was composed of 200 individuals who agreed to participate in the study by signing an informed consent in accordance with the Term of Free and Informed Consent (IC).
A full ophthalmologic examination was performed. Later on, the luorescein angiography was performed to classify the cases accor-ding to criteria established by the ETDRS for DR and clinically signi-icant macular edema (CSME). Also, CST analyses were performed using the CirrusTM SD-OCT device (Zeiss Humphrey Systems, San Lean dro, CA). The statistical tests were selected to validate the results and to correlate the indings between OCT and BCVA.
The sample was composed of 55 patients, between January, 2010 and April, 2011, with type 2 diabetes with over 5 years with NPDR and DME, with or without clinical control, aged between the 4th and 7th decade, with any VA and refraction with spherical equivalent between +5.00 and -5.00 diopters, who visited the Reference Center for Ophthalmology in the city of Goiania - GO - Brazil in the establi-shed period. Only one eye per patient was considered in the study. The iatrogenic research was performed throughout the study. The control group was composed of 27 patients with type 2 diabetes for less than 5 years, without retinopathy and DME.
Exclusion criteria included macular edema or vascular diseases of other etiologies, laser or prior eye surgery, intravitreal injection, aphakia, opaciication of optical media (cataract, corneal edema, leukoma and vitreous hemorrhage), low vision, proliferative diabetic retinopathy, impaired ixation, use of storage drugs, corticosteroids, immunosuppressors and immunomodulators, and intraocular pres-sure >21 mmHg.
The data was organized according to gender, age, BCVA, the use of Cirrus CST value for an eye according to the ETDRS criteria, the NPDR classiication according to criteria adapted from the ETDRS, the macular volume, type of macular edema seen in OCT (difuse, cystoid macular edema or serous), and external limiting membrane integrity (ELM) (continuous or disrupted). For the investigation of the type of macular edema, it OCT predominant pattern was considered. The software Microsoft Excel 17.0 was used to store and structure the data for posterior statistical analysis with software SPSS (Statis-tical Package for Social Sciences). Kruskal-Wallis test was applied to verify the existence of signiicant statistical diference between vi sual acuity mean and type of macular edema. T-Student test was applied to correlate the variables gender and ELM integrity; Variance Analysis for CST mean with type of edema and NPDR classiication; Mann-Whitney test for visual acuity mean with ELM integrity; Fisher test for gender between case and control groups. Linear Regression was used to correlate CST with variables age, macular volume and visual acuity. It was considered a 95% conidence level and statistical signiicance with p<0.05.
RESULTS
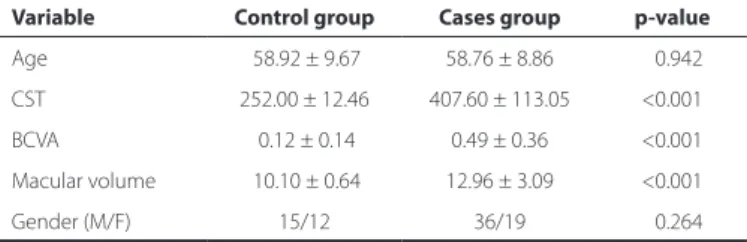
There was no signiicant diference between case and control con -cerning age. Cases showed higher CST, higher volume and worse BCVA than controls (Table 1) (Linear Regression Analysis).
Most patients in this study showed moderate NPDR (47.3%), with signiicant diference of CST among the diferent NPDR classiications (p<0.001). CST mean values for severe, moderate and mild NPDR were, respectively, 491.4 µm, 364.2 µm and 305.1 µm.
There was a signiicant diference (p=0.010) between the CST ave-rage in relation to the type of edema. 49.1% of patients showed CME (Table 2) (Variance Analysis).
There were signiicant diferences between the CST in relation to ELM integrity (p<0.001). Patients with disrupted MLE showed higher CST (Table 3) Student’s t-test.
DISCUSSION
CirrusTM SD-OCT is one of the high-resolution devices designed for visualizing and measuring in-vivo, through three-dimensional and transversal images, the ocular structures. The device allows vi-sualizing and comparing consecutive exams and existing changes, such as measures of retinal thickness after intra-vitreous injection of antiangiogenic agents. A successful treatment is often anatomically deined as a reduction of intra or subretinal luids, which results in a reduction of thickness in the ETDRS subields. Such measures are also important in deining the criteria for inclusion or exclusion in clinical trials, as well as in patient´s care, helping on therapeutic decisions and follow-up of the patient’s response(13).
Browning et al. suggest the retinal thickness (RT) to be assessed by the CST due to high reproducibility, being based on more scans than the central foveal thickness (CFT), and having higher correla-tion with other measures of the central macula(14). This statement is corroborated by Alasil et al., who point out that the CFT measure may be more subject to decentralization errors in patients with poor ixation and the CST receives contributions from the parafoveal region, assuming the CST as a better indicator of visual function(12). Han and Jafe show that changes in RT within the central 1 mm are more clinically relevant as they relate to changes in the VA, are less susceptible to artifacts and the central thickness measurement can be more reliable than scans performed in peripheral areas(13).
OCT enables to evaluate the edema morphological feature and classiies it in three patterns: cystoid macular edema, serous retinal detachment, and difuse edema. The segmentation of SD-OCT ima-ges identiies each retinal layer, and the damage observed in the foveal ganglionic cell layer can be correlated with the damage in the avascular foveal zone shown in the fluorescein angiography, for example, loss of inner layers of the retina speciically correlates to the capillary non-perfusion and severe ischemia, turning the OCT into a good indicator of ischemic maculopathy(15-17).The correlations between the severity of the outer retinal edema in the OCT and the severity of leakage in the angiography were also described. Simul-taneous studies of luorescein angiography and SD-OCT concluded that the VA is not associated with the presence or absence of cysts(18). However, this study assumes that the VA is a measure of foveal func-tion and then correlates with the number, size, and locafunc-tion of the cysts. In this study, 49.1% of patients showed CME and, in relation to both BCVA and CST average values, there was a signiicant diference between the three diferent patterns of edema.
Murakami et al. associate the pathological changes in the outer retina, especially the ELM and the junction of inner and outer seg-ments of photoreceptors with BCVA. They report in their study that the loss of the ELM, of the junction of outer and inner segments of photoreceptors (OS/IS) and the inner nuclear layer could corres-pond to the disturbance in the luminous perception by
photore-ceptors(19).
Park et al. observed the changes in the nerve iber layer (NFL) of the macula in the early stage of DR using CirrusTM SD-OCT. According to the authors, the loss of NFL associated with diabetes occurs before the visible vascular retinopathy and it would be secondary to ische-mia caused by retinal vasculopathy, leading to apoptosis of retinal ganglion cells (RGCs). The study observed that the NFL loss occurs mainly in the superior macular region and this could serve to detect early changes in the DR(20).
As the severity of the retinopathy rises, the retinal thickness in creases as well. Browning et al. emphasize that a single initial in-dividualized study for future longitudinal comparisons is important, as the individual variation is wide, with a large standard deviation in the normal population(21). This work has found that the greater the severity of retinopathy, greater is the CST, and the greater the thickness, the greater is macular volume. Browning et al. suggest having a lower threshold to obtain the OCT values as the severity of retinopathy increases. These authors also believe that both clinical
Table 1. Parameters of age, CST, BCVA variables and macular volume of control and case groups
Variable Control group Cases group p-value
Age 58.92 ± 9.67 58.76 ± 8.86 <0.942 CST 252.00 ± 12.46 407.60 ± 113.05 <0.001 BCVA 0.12 ± 0.14 0.49 ± 0.36 <0.001
Macular volume 10.10 ± 0.64 12.96 ± 3.09 <0.001
Gender (M/F) 15/12 36/19 <0.264
p= statistical signiicance; CST= central subield thickness measured in µm; BCVA= visual acuity in logMAR; macular volume measured in mm3; M/F= male/female
Table 2. CST parameters in relation to the edema morphology. Varian-ce analysis
Edema morphology N (%)
Parameters
CST mean Standard deviation
CME Serous Difuse
27 (49.1) 07 (12.7) 21 (38.2)
426.7 488.7 356.1
116.7 178.2 041.2
CME= cystoid macular edema; N= number of cases; p=0.010
Table 3. CST parameters in relation to ELM
ELM N (%)
Parameters
CST mean Standard deviation
Continuous Disrupted
41 (74.5) 14 (25.5)
368.7 521.4
064.2 147.3
ELM= external limiting membrane; N= number of cases; CST= central subield thickness measured in µm; p<0.001. Student’s t-test
Table 4. BCVA parameters in comparison to ELM
ELM N (%)
Parameters
BCVA mean Standard deviation
Continuous Disrupted
41 (74.5) 14 (25.5)
0.4 0.9
0.2 0.5
ELM= external limiting membrane; N= number of cases; BCVA= visual acuity in logMAR; p<0.001. Mann-Whitney test
Table 5. BCVA parameters in comparison with the macular edema type
Edema morphology N (%)
Parameters
BCVA mean Standard deviation
CME Serous Difuse
27 (49.1) 07 (12.7) 21 (38.2)
0.6 0.5 0.4
0.4 0.6 0.2
CME= cystoid macular edema; N= number of cases; BCVA= visual acuity in logMAR; p<0.032. Kruskal-Wallis test
There was a signiicant diference (p=0.032) between the BCVA mean in comparison with the type of edema (Table 5) (Kruskal-Wallis test).
assessment and the OCT can detect the progression of DME, once the slit lamp evaluation alone can result in errors(21). However, there is no way to predict in which patients the DR will progress. The authors consider that there are no predictive features among the variables usually evaluated by ophthalmologists, which can be safely used in this evaluation. They also suggest a follow-up with interval of 4 to 6 months for these patients, since in patients with subclinical ME the evolution is likely to be slow. Moreover, it is unclear whether patients will return for follow-up appointments.
Blumenkranz et al. and Deák et al. agree that several factors in-fluence on the visual function in eyes with macular edema, such as the edema´s morphological characteristics, duration, retinal perfu-sion, the total retinal volume, and abnormalities in the vitreoretinal interface. Other variables already known as predictors include age, macular leakage on fluorescein angiography and average fo veal thickening(8,22). A moderate correlation between RT and VA was sug gested in some studies. These authors compared BCVA with RT mea surements using CirrusTM SD-OCT in a series of 62 eyes of pa-tients with type 2 diabetes. They found only moderate correlation bet ween RT and BCVA in the central fovea (within 500 µm)(23). The present study found a 77% correlation between BCVA and CST, and a 64% correlation between BCVA and macular volume.
Recent indings applying CirrusTM SD-OCT suggest a strong and reliable correlation between measurements of the outer photore -ceptor layer and the VA(9). Otani et al. investigated the changes found in the ELM and in the junction between OS/IS in the diabe tic edema and their correlation with the changes in BCVA(10). The SD-OC T in this study showed that the integrity of these structures is more related to the BCVA than the CST, as it is more directly related to visual function.
It is unclear if the shortening of the photoreceptors outer seg-ment seen in diabetes is caused by multiple break points of the OS/IS junction, or by a general thinning of the outer photoreceptor layer. The reasons are speculated based on the pathophysiology of the disease, that is, in the tissue ischemia, in the lipid exudation and in the accumulation of inflammatory mediators in the DME(9). Moreover, the reduction of the macular edema after therapies does not always improve the VA, which suggests that the macular thickness is only one of the several factors that affect the VA. Thus, these measures do not explain all variations in vision, indicating that other factors, such as macular ischemia and function of retinal cells are important as well.
Maheshwary et al. also considered the rupture of the OS/IS junc tion as an important predictor of VA in patients with DME. The inte grity of the retinal photoreceptor layer can be evaluated by the SD-OCT, and this full retinal architecture is correlated with the final VA. The authors believe that the OS/IS integrity is an important pre-dictor factor for VA. Other factors considered by them as VA determi-nants include macular ischemia and the accumulation of subfoveal hard exudates. These findings were described by these authors for both untreated patients and those treated by pars plana vitrec-tomy(11). Quantitative data originated from the OCT are important in investigating the relationship between the retinal morphology and visual acuity in the DME. Alasil et al. gave the same consideration to the thickness of the outer photoreceptors layer in his study, which showed to be the thickness of the outer photoreceptors layer the predictor of VA(12). Our study concluded that the ELM integrity is cor-related with the CST. Patients with continuous ELM showed lower CST and significantly better BCVA (p <0.001) than diabetic patients with disrupted ELM. Also, patients with disrupted ELM show higher CST (p<0.001) and worse VA, which supports the idea that the inte-grity of the retinal layers seen in the OCT holds important clinical implications in the EMD monitoring.
The EMD treatments are more efective in preventing the edema development and vision loss than in restoring both normal ma-cular thickness and lost VA, that is, the early detection is required.
Some studies suggest applying OCT in either eye with DR that will undergo panretinal photocoagulation, once the OCT result may in -luence the use of adjuvant therapy(21). Virgilli et al. suggest that, in cases of clinical uncertainty about the existence of central EMD, the macular photocoagulation should not be indicated if central retinal thickness is below 250 μm, while values above 300 μm or more are strongly indicative of the need to treatment. Besides, it reinforces the need to not delay the photocoagulation if the thickness is so-mewhat under 250 µm, but with a strong clinical suspicion of CSME, especially in patients with non-central CSME(24). However, to base on measurements below 300 μm in the OCT, to indicate the treatment of macular edema, is a procedure that can result in treating patients who could improve spontaneously without it. There is a correlation between retinal morphological changes and macular edema, both seen in the OCT, and the visual function loss associated to them, although other factors not yet known interfere with the treatment perspective, which leads to the conclusion that the RT is only one of the indicating factors of the treatment and can be used as an indica-tor of current therapies. Future studies may identify other facindica-tors that act on visual function, such as the electrophysiology. When the OCT is available, it is suggested to relate its data to the clinical evaluation of the slit lamp to avoid possible errors in diagnosis, especially in the initial disease. Still, there may be thinner maculas in patients with mild to moderate DR without edema. Yet, in severe NPDR or PDR, the macula tends to be thicker than in normal eyes, even without clinically detectable thickening.
CONCLUSION
There were signiicant diferences for variables CST, BCVA and ma cular volume. A signiicant correlation was found between retino-pathy severity according to NPDR classiication and the mean value of CST. The greater the retinopathy severity, the greater the CST and the worse the BCVA. Most of the patients presented moderate NPDR. A strong correlation between volume and CST was found. Patients with serous retinal detachment presented higher mean value of CST, and those with CME presented worse BCVA. Patients with disrupted ELM showed greater mean value of CST and worse BCVA. It was con-cluded that SD-OCT allows quantitative measurement of CST in the DME and, for identifying the retinal layers individually, also detects retinal structural changes and correlates them to visual functions.
New versions of OCT may be able to be more precise and more sophisticated at deining the usual clinical concepts and doubts relevant to the practical implications of the device. Moreover, data from clinical examination, colorful background photography or luo-rescein angiography, combined to OCT, provide a deinition with greater predictive power.
Best resolutions, high deinition, and reined results with SD-OCT may bring answers with clarity and precision without further dei-nition with the OCT-3 and, along with other diagnostic modalities, explain what is today inconclusive or questionable. The SD-OCT is an excellent replacement of invasive exams to detect and evaluate macular structural changes, and it may, in the near future, explain the functional changes and the visual results of many other retinal diseases. The use of this device in public health campaigns can help to diagnose eyes with macular edema, and be an indicator of early treatment and follow-up on the use of antiangiogenic agents.
AKNOWLEDGMENTS
The authors would like to thank CAPES for the doctoral scholar-ship given to the irst author.
REFERENCES
2. Grenga P, Lupo S, Domanico D, Vingolo EM. Eicacy of intravitreal triamcinolone acetonide in long standing diabetic macular edema: a microperimetry and optical coherence tomography study. Retina. 2008;28(9):1270-5.
3. Vojusevic S, Benetti E, Massignan F, Pilotto E, Varano M, Cavarzeran F, et al. Screening for diabetic retinopathy: 1 and 3 nonmydriatic 45-degree digital fundus photographs vs 7 standard early treatment diabetic retinopathy study ields. Am J Ophthalmol. 2009;148(1):111-8.
4. Taleb A, Ávila MP, Moreira H. As condições de saúde ocular no Brasil: 2008. São Paulo: Walprint Gráica e Editora.
5. Hannouche RZ. Medida da espessura retiniana no edema macular diabético clini-camente signiicativo, pela tomograia de coerência óptica [Dissertação]. Goiânia: Uni versidade Federal de Goiás; 2009.
6. Browning DJ, Fraser CM. The predictive value of patient and eye characteristics on the course of subclinical diabetic macular edema. Am J Ophthalmol. 2008;145(1):149-54. 7. Mitchell P, Bandello F, Schmidt-Erfurth U, Lang GE, Massin P, Schlingemann RO,
Sutter F, Simader C, Burian G, Gerstner O, Weichselberger A; RESTORE study group. The RESTORE study: ranibizumab monotherapy or combined with laser versus laser monotherapy for diabetic macular edema. Ophthalmology. 2011;118(4):615-25. 8. Blumenkranz MS, Haller JA, Kuppermann BD, Williams GA, Ip M, Davis M, et al.
Cor relation of visual acuity and macular thickness measured by optical coherence tomography in patients with persistent macular edema. Retina. 2010;30970:1090-4. Comment in Retina. 2011;31(4):815; author reply 815-6.
9. Forooghian F, Stetson PF, Meyer SA, Chew EY, Wong WT, Cukras C, et al. Relationship between photoreceptor outer segment length and visual acuity in diabetic macular edema. Retina. 2010;30(1):63-70.
10. Otani T, Yamaguchi Y, Kishi S. Correlation between visual acuity and foveal micros-tructural changes in diabetic macular edema. Retina. 2010;30(5):774-80.
11. Maheshwary AS, Oster SF, Yuson RM, Cheng L, Mojana F, Freeman WR. The association between percent disruption of the photoreceptor inner segment-outer segment junc-tion and visual acuity in diabetic macular edema. Am J Ophthalmol. 2010;150(1):63-7.e1. 12. Alasil T, Keane PA, Updike JF, Dustin L, Ouyang Y, Walsh AC, et al. Relationship between optical coherence tomography retinal parameters and visual acuity in diabetic ma-cular edema. Ophthalmology. 2010;117(12):2379-86.
13. Han IC, Jafe GJ. Evaluation of artifacts associated with macular spectral-domain optical coherence tomography. Ophthalmology. 2010;117(6):1177-89.e4.
14. Browning DJ, Apte RS, Bressler SB, Chalam KV, Danis RP, Davis MD, Kollman C, Qin H, Sadda S, Scott IU; Diabetic Retinopathy Clinical Research Network. Association of the extent of diabetic macular edema as assessed by optical coherence tomography with visual acuity and retinal outcome variables. Retina. 2009;29(3):300-5. 15. Loduca AL, Zhang C, Zelkha R, Shahidi M. Thickness mapping of retinal layers by spec
-tral-do main optical coherence tomography. Am J Ophthalmol. 2010;150(6):849-55. 16. Byeon SH, Chu YK, Lee H, Lee SY, Kwon OW. Foveal ganglion cell layer damage in
ischemic diabetic maculopathy: correlation of optical coherence tomographic and anatomic changes. Ophthalmology. 2009;116(10):1949-58.e8.
17. Yeung L, Lima VC, Garcia P, Landa G, Rosen RB. Correlation between spectral domain optical coherence tomography indings and luorescein angiography patterns in diabetic macular edema. Ophthalmology. 2009;116(6):1158-67.
18. Brar M, Yuson R, Kozak I, Mojana F, Cheng L, Bartsch DU, et al. Correlation between morphologic features on spectral-domain optical coherence tomography and an-giographic leakage patterns in macular edema. Retina. 2010;30(3):383-9.
19. Murakami T, Nishijima K, Sakamoto A, Ota M, Horii T, Yoshimura N. Association of pathomorphology, photoreceptor status, and retinal thickness with visual acuity in diabetic retinopathy. Am J Ophthalmol. 2011;151(2):310-7.
20. Park HY, Kim IT, Park CK. Early diabetic changes in the nerve iber layer at the ma-cula detected by spectral domain optical coherence tomography. Br J Ophthalmol. 2011;95(9):1223-8.
21. Browning DJ, Fraser CM, Clark S. The relationship of macular thickness to clinically graded diabetic retinopathy severity in eyes without clinically detected diabetic macular edema. Ophthalmology. 2007;115(3):533-9.e2.
22. Deák GG, Bolz M, Ritter M, Prager S, Benesch T, Schmidt-Erfurth U; Diabetic Retino-pathy Research Group Vienna. A systematic correlation between morphology and functional alterations in diabetic macular edema. Invest Ophthalmol Vis Sci. 2010; 51(12):6710-4.
23. Nunes S, Pereira I, Santos A, Bernardes R, Cunha-Vaz J. Central retinal thickness mea-sured with HD-OCT shows a weak correlation with visual acuity in eyes with CSME. Br J Ophthalmol. 2011;94(9):1201-4.
24. Virgilli G, Menchini F, Dimastrogiovanni AF, Rapizzi E, Menchini U, Bandello F, et al. Optical coherence tomography versus stereoscopic fundus photography or biomicroscopy for diagnosing diabetic macular edema: a systematic review. Invest Ophthalmol Vis Sci. 2007;48(11):4963-73.