ORIGINAL ARTICLE
Suicide detection in Chile: proposing a predictive model for
suicide risk in a clinical sample of patients with mood
disorders
Jorge Barros,
1Susana Morales,
1Orietta Echa´varri,
1Arnol Garcı´a,
2Jaime Ortega,
2Takeshi Asahi,
2Claudia Moya,
3Ronit Fischman,
4Marı´a P. Maino,
1Catalina Nu´n˜ez
51Departamento de Psiquiatrı´a, Facultad de Medicina, Pontificia Universidad Cato´lica de Chile, Santiago, Chile.2Centro de Modelamiento
Matema´tico, Departamento de Matema´ticas, Escuela de Ingenierı´a y Ciencias, Facultad de Ciencias Fı´sicas y Matema´ticas, Universidad de Chile, Santiago, Chile.3Facultad de Enfermerı´a, Universidad San Sebastia´n, Santiago de Chile.4Servicio de Neurologı´a y Psiquiatrı´a, Hospital Dr. Luis Calvo Mackenna, Santiago, Chile.5Private practice.
Objective:To analyze suicidal behavior and build a predictive model for suicide risk using data mining (DM) analysis.
Methods:A study of 707 Chilean mental health patients (with and without suicide risk) was carried out across three healthcare centers in the Metropolitan Region of Santiago, Chile. Three hundred forty-three variables were studied using five questionnaires. DM and machine-learning tools were used via the support vector machine technique.
Results: The model selected 22 variables that, depending on the circumstances in which they all occur, define whether a person belongs in a suicide risk zone (accuracy = 0.78, sensitivity = 0.77, and specificity = 0.79). Being in a suicide risk zone means patients are more vulnerable to suicide attempts or are thinking about suicide. The interrelationship between these variables is highly nonlinear, and it is interesting to note the particular ways in which they are configured for each case. The model shows that the variables of a suicide risk zone are related to individual unrest, personal satisfaction, and reasons for living, particularly those related to beliefs in one’s own capacities and coping abilities.
Conclusion:These variables can be used to create an assessment tool and enables us to identify individual risk and protective factors. This may also contribute to therapeutic intervention by strengthening feelings of personal well-being and reasons for staying alive. Our results prompted the design of a new clinical tool, which is fast and easy to use and aids in evaluating the trajectory of suicide risk at a given moment.
Keywords: Suicide; mood disorders; data mining
Introduction
Suicide rates have increased significantly worldwide during recent years, resulting in more than 150,000 deaths in 2013. This phenomenon is highly complex and encom-passes biological, psychological, and social variables. A large proportion of individuals who have attempted suicide present with psychiatric conditions such as mood disorders (specifically, depressive disorders), psychosis, and substance abuse. Within the social factors known to date, unemployment and social isolation have been associated with high suicide rates. In Chile, the suicide rate is 11 per 100,000 inhabitants1; unipolar depression is the second cause of disability-adjusted life-years lost in the general Chilean population and the leading cause among women between the ages of 20 and 44, and affects 17.2% of the population over 15 years of age.2
The World Health Organization (WHO) has stated that, despite being a leading cause of death worldwide, suicide remains a low public health priority.3As a reaction to that statement, the Chilean Ministry of Health has proposed a strategy aimed at reducing the suicide rate. For instance, the suicide rate for individuals between the ages of 10 and 19 in Chile has increased from 5.7 per 100,000 to 7 per 100,000 over the last few years.4The above-mentioned
WHO document notes that, in order to design any kind of intervention to address suicide, a precise definition of the at-risk population is essential.
The task of defining which patients are at greatest risk of suicidal behavior has always had at least two major purposes: to describe the more general aspects of this behavior from an epidemiological perspective; and to recognize which factors may predict when patients are suicidal, so as to enable delivery of timely intervention. Studies have mainly focused on factors that some research-ers refer to as static, such as clinical history, demographic factors, or, more recently, genetic and metabolic markers.5 However, such valuable information has not proved useful for predicting when suicidal behavior will occur at the individual level, due to its intrinsically unstable nature, which may be Correspondence: Jorge Barros, Camino El Alba, 12351, Las Condes,
750000, Santiago, Chile. E-mail: [email protected]
Submitted Dec 02 2015, accepted Apr 11 2016.
Associac¸a˜o Brasileira de Psiquiatria
determined by several personal, interpersonal, and social factors (in other words, it is highly state-dependent).5
Studies that have attempted to predict the risk of suicide in samples of at-risk patients have yielded mixed results. In a follow-up study of 515 subjects who made a suicide attempt, regardless of its severity, around 90% had not died by suicide or other violent causes 26 years later. Powell et al.6 compared 97 patients who committed suicide while hospi-talized in psychiatric units to 90 patients selected at random who did not display suicidal behavior during hospitalization. According to clinical records, only two of the 97 patients who committed suicide showed severe suicide risk indicators. In 24 cases, the risk of suicide was assessed as low or moderate before the suicide attempt. In the remaining 71 cases, clinical notes taken prior to the suicide did not support the view that these patients should have been categorized as being at a greater risk of suicide than other patients. In a systematic review of 12 psychometric tools used in the emergency room (ER) to predict suicidal behavior, Randall et al.7 noted that, while the tools did have sound psychometric properties, evidence of their clinical usefulness was weak. Similar findings were obtained in a systematic meta-analysis of 13 studies.8A review of studies following up on patients with bipolar disorders or major depression9 was unable to determine any one factor that could serve as a predictor of suicide for this patient population.
An indication of the complexity of this behavior can, perhaps, be found in the testimonies of patients who survived attempts at suicide through highly lethal meth-ods. Half of all survivors from a group of subjects who were saved after jumping from the Golden Gate Bridge had already begun to regret their decision as they were falling. Another group of subjects who had also been saved when jumping from the same bridge admitted that their relationship with life and death had changed since their survival.10,11
In summary, suicidal behavior is associated with a significant number of diverse factors, which are difficult to predict, usually highly sensitive, but with little specificity. None of these factors would be sufficient to explain suicidal behavior at a particular moment in a person’s life. None-theless, as O’Connor & Nock12 aptly describe, suicidal behavior is always preceded by a stage characterized as suicidal ideation and intent. A more nuanced understanding of the particular aspects of the complex path of this behavior is needed.
Understanding what is defined as an imminent suicide scenario, which some see as purely euphemistic,13would help establish a more detailed assessment of suicide risk. The expected result would be that active modification of those variables might decrease the risk of suicide.
In recent years, data mining (DM) techniques have been used as an aid in the medical decision-making process. The DM methodology uses a variety of techniques that aim to gather information to identify ‘‘unknown’’ patterns in data that have not been used before.
DM has been proposed as an ‘‘unbiased’’ way to generate hypotheses.14DM techniques work with numer-ical or categornumer-ical data to describe and/or predict clinnumer-ical situations, and are particularly useful for complex, multi-factorial clinical problems in which a large number of the
implicated factors differ greatly from each other, which is exactly the case of suicidal behavior.
DM techniques have already proven to be useful in medicine. In psychiatry, DM has been used to estimate suicide risk throughout the life course by using information provided by electronic medical records,15,16 but not to predict individual risk at a given moment.
Here, we used DM to process large volumes of data, choosing data points that best select the targeted subject sample. This should provide a better understanding of the complex cognitive and emotional state preceding suicidal behavior. Moreover, it may give us critical information to develop a useful tool for clinical follow-up. We foresee a highly individual model of risk monitoring which would identify each patient’s preventative or risk factors over time, as well as their relationship with the suicide risk scenario.
A deeper understanding of the set of variables that make up suicide risk would help detect the presence of such risk and devise strategies to prevent suicide.
Methods
Participants
A purposive, consecutive sampling strategy was used. Participants were categorized into two groups: 1) those with suicidal behavior who sought treatment for suicide attempts or current suicidal ideation; and 2) those without suicidal behavior who sought treatment for other reasons, without suicide attempts or current suicidal ideation. Once the psychiatric diagnoses had been established in colla-boration with the clinical staff, each participant received a description of the study and was asked to confirm their voluntary participation (i.e., without monetary compensa-tion) by signing an informed consent/assent form. This study was carried out in accordance with the recommen-dations of the Ethics Committees of all participating institutions and in accordance with the Declaration of Helsinki.17Underage subjects who agreed to participate were asked to sign an assent form, and their parents or guardians were informed by means of a consent form. A sociodemographic survey was conducted to gather general background information and ascertain partici-pants’ reasons for seeking treatment. The measures des-cribed below were then applied to evaluate the variables of interest in the study participants.
The sample was made up of adolescent, young adult, adult, and older adult mental health patients (all aged X14 years). Patients were recruited from the outpatient and inpatient facilities of three health centers, correspond-ing to different socioeconomic levels, all located in the Metropolitan Region of Santiago, Chile. The study was carried out between June 2010 and December 2014.
Measures
Outcome Questionnaire (OQ-45.2), validated Spanish version18,19
This questionnaire assesses how the person has been feeling in recent days with regard to: a) symptoms of anxiety and depression; b) interpersonal relationships; and c) social role functioning (family, employment, leisure roles) (nine items).
State Trait Anger Expression Inventory (STAXI-2), vali-dated Spanish version20,21
This instrument evaluates the experience of rage from the patient’s perspective across two dimensions (the state of rage and features of rage), as well as the expression of rage from three perspectives: out of control, excessive control, and functional control.
Reasons for Living Scale (RFL), validated Spanish version22,23
This measure evaluates the reasons that dissuade people from attempting suicide from six perspectives based on the importance that patients themselves assign to each: a) confidence in their abilities to face difficult situations; b) fear of death and social disapproval; c) family respon-sibilities; d) concern for children; e) perception of an inability to commit suicide; and f) moral objections.
Depressive Experience Questionnaire, validated Spanish version24,25
This questionnaire measures factors related to personality vulnerability associated with depression, namely, self-criticism and dependence. There is a third factor considered to influence against suicide, which is related to self-efficacy. Internal consistency showed a Cronbach’s alpha in the study sample ofa= 0.844 for the total scale,a= 0.60 for the
dependence subscale, a = 0.79 for the self-criticism
subscale, anda= 0.69 for the self-efficacy subscale.
Family APGAR, validated Spanish version26,27
This scale measures satisfaction with regard to family functioning via a general evaluation of five aspects of the respondent’s family life: a) adaptability; b) participation; c) growth gradient; d) affection; and e) resolve.
Sociodemographic and clinical information
Several descriptive variables were assessed: demo-graphic, social, clinical, diagnostic, reasons for seeking treatment, and a description of the participant’s behavior or suicidal ideation, where applicable.
Data analysis
DM and machine-learning tools and techniques were explored to generate a predictive model for suicide risk. Specifically, the following six techniques were explored: the Classification and Regression Tree (CART),28 k-nearest
neighbor (KNN),29 random forest,30 AdaBoost,31 neural-network multilayer perceptron (MLP),32and support vector machine (SVM).33,34 Of these approaches, SVM was
observed to be the most robust technique for the data of this study in terms of accuracy, sensitivity, and specificity. Consequently, this study reports on the results obtained using the SVM technique.
A supervised learning approach was used with a database of 707 patients under treatment for mental health conditions, divided into two groups as noted above (with suicidal behavior vs. without suicidal behavior). Participants represented 343 sociodemographic and clinical variables.
The with vs. without suicidal behavior groupings relate to the class or value predicted or classified by the generated models. For the purposes of this classification, a cross-validation technique was used, both for parameter fit and to assess the generated models. The results of this classifica-tion are shown below using the following assessment metrics: a) accuracy; b) sensitivity; c) specificity; d) receiving operating characteristics (ROC) curve.35
Development and fit of the models were carried out in theRstatistical language.
Brief description of the analytical techniques employed
CART
This is a modeling tool that represents groups of decisions in the form of a tree that generates rules for the classification of a group of data. It is used for classification and regression solutions. For this study, a binary model with two decision branches was used.28
SVM
These are supervised learning models in conjunction with learning algorithms that analyze and recognize patterns. They represent sampling points in space, separating groups by the largest amount of space possible. When new samples are entered into the model, they can be classified into one group or another depending on their proximity. The algorithms build a hyperplane or a collec-tion of hyperplanes in a space with many (even infinite) dimensions. These can then be used for classification or regression problems.33
KNN
This nonparametric classification technique uses a simple classification algorithm that stores all of the available observations and classifies new cases based on a similarity measure. Observations are classified by a vote between the nearest K neighbors.29
Random forest
indicators. Randomness is present both in the training samples and in the set of attributes.30
AdaBoost
This algorithm that generates multiple decision trees on subsets of observations where each observation is chosen with a probability distribution calculated at every iteration of the algorithm. The final result of the model is obtained by weighted voting by each of the trees generated.31
Results
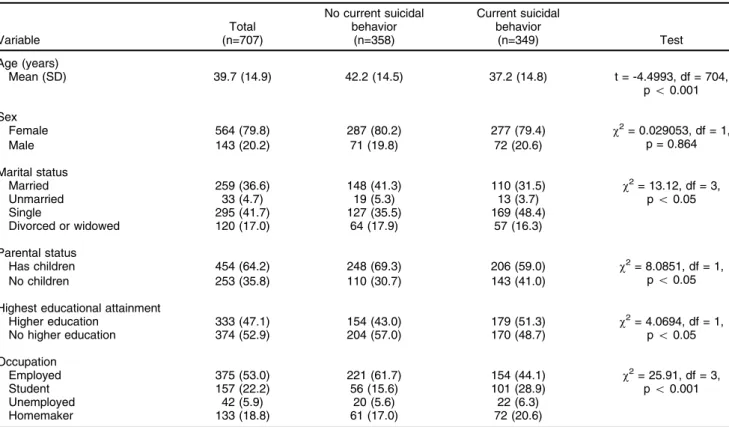
The sample consisted of 707 patients (mean age: 39.68614.85 years; range: 14 to 83), most with diag-noses of mood disorders and a minority with behavioral and adjustment disorders. Participants were divided into a group with suicidal behavior (i.e., suicide attempts and suicidal ideation) (n=349) and a group without current suicidal behavior (n=358). Table 1 presents the socio-demographic characteristics of the participants.
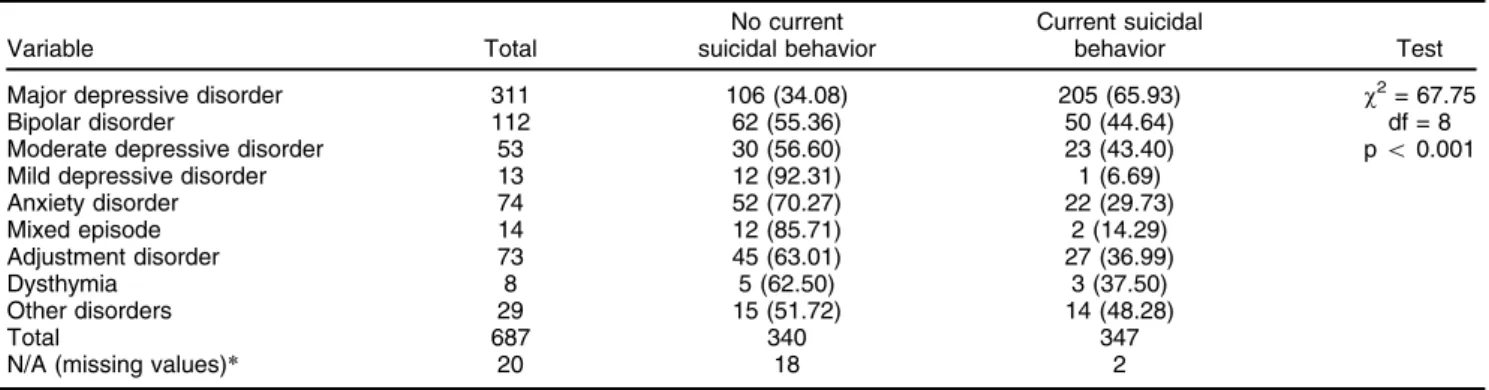
Mood disorders and age distribution are shown in Tables 2 and 3.
Cleansing and refining the data
The data cleansing process involved removing all cases and fields with a high number of null values, as well as variables that were not relevant to the model. Values lost
from the database were imputed by traditional techniques: conditional means, conditional distribution (random hot-deck), and expert judgment.36Following data cleansing, a complete database of information for 707 patients with 224 fields was obtained.
Attribute reduction
Attribute reduction was carried out by removing irrelevant fields with a chi-square test which measured the impor-tance of each variable with regard to the objective variable (group with suicide attempts or suicidal ideation), independently of the rest. The 224 fields were reduced to 139 relevant fields.
Correlated effects were removed from the database by means of a correlation analysis of the 139 previously selected variables, which were reduced to 129 relevant variables. This was the starting point for the modeling. The correlated variables were then eliminated and grouped (correlationX0.7). Attributes were then reduced by using the wrapper technique. To this end, the model was adjusted for 10, 20, and 30 attributes and error measures were calculated. The set of 20 attributes, for which adjustment yielded the best results, was selected. After removing minor or highly correlated attributes, selection of attributes based on the performance of dif-ferent models was carried out. For each model evaluated, a set of variables that exhibited greater performance with regard to the accuracy measure was determined.
Table 1 Sociodemographic characteristics of the sample and differences between groups
Variable
Total (n=707)
No current suicidal behavior
(n=358)
Current suicidal behavior
(n=349) Test
Age (years)
Mean (SD) 39.7 (14.9) 42.2 (14.5) 37.2 (14.8) t = -4.4993, df = 704,
po0.001
Sex
Female 564 (79.8) 287 (80.2) 277 (79.4) w2= 0.029053, df = 1,
p = 0.864
Male 143 (20.2) 71 (19.8) 72 (20.6)
Marital status
Married 259 (36.6) 148 (41.3) 110 (31.5) w2= 13.12, df = 3,
po0.05
Unmarried 33 (4.7) 19 (5.3) 13 (3.7)
Single 295 (41.7) 127 (35.5) 169 (48.4)
Divorced or widowed 120 (17.0) 64 (17.9) 57 (16.3)
Parental status
Has children 454 (64.2) 248 (69.3) 206 (59.0) w2= 8.0851, df = 1,
po0.05
No children 253 (35.8) 110 (30.7) 143 (41.0)
Highest educational attainment
Higher education 333 (47.1) 154 (43.0) 179 (51.3) w2= 4.0694, df = 1,
po0.05
No higher education 374 (52.9) 204 (57.0) 170 (48.7)
Occupation
Employed 375 (53.0) 221 (61.7) 154 (44.1) w2= 25.91, df = 3,
po0.001
Student 157 (22.2) 56 (15.6) 101 (28.9)
Unemployed 42 (5.9) 20 (5.6) 22 (6.3)
Homemaker 133 (18.8) 61 (17.0) 72 (20.6)
Figure 1 shows the calculation of accuracy and optimal parameters for different input data sets for which 10, 20, and 30 attributes are presented.
Model training and validation
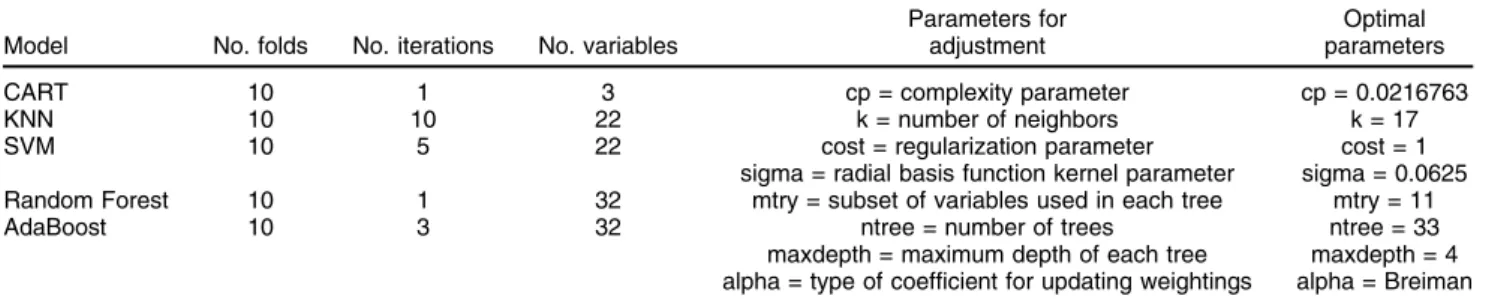
Parameter adjustments of each model were made by using k-times n-fold cross-validation, with n=10 and k = 5. The number of attributes used varied, so as to identify which attribute would yield better results. The parameter adjustments for the SVM model proposed were as fol-lows: #folds = 10, #iterations = 5, #variables = 22, param-eters for adjustments = cost, regularization parameter sigma = radial basis function kernel parameter, optimal parameters = cost = 1, sigma = 0.0625. Table 4 shows a summary of the parameter adjustments made for each tested model.
Each model was assessed by using the optimal parameters previously calculated for four indicators: accuracy, sensitivity, specificity, and ROC curve. These indicators were calculated with n-fold cross-validation, with n=10 and 100 repeats. The results obtained after the 100 iterations are presented in Table 5. The SVM model had the greatest accuracy (mean = 0.78), followed by the random forest model (mean accuracy = 0.78) and the AdaBoost model (mean accuracy = 0.76).
The sensitivities and specificities of each model are similar to their accuracy, with no significant differences observed. The model that demonstrated the greatest difference between sensitivity and specificity was the CART model, while that with the smallest difference was AdaBoost, which showed similar results across its three indicators. The SVM had greater specificity than sensi-tivity, while the random forest model showed greater sensitivity than specificity. These differences are mar-ginal. Figure 2 provides a box plot of the accuracy distributions for the five models analyzed.
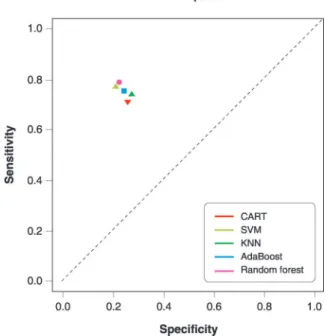
In addition, ROC space models can be plotted from the averaged information of K-fold cross-validation. The ROC space analysis is shown in Figure 3. The SVM model presented a sensitivity of 0.77 and a specificity of 0.79. The SVM model presented 22 variables for the new clinical model, considering that a smaller number of variables could make the proposed model more manageable.
Figure 3 shows that, although the five models were similar, the SVM and random forest models yielded the best results, as was the case in accuracy analysis. In the ROC space analysis, the random forest model presented the greatest sensitivity (0.78), whereas the SVM showed the second highest sensitivity (0.77). Similarly, the SVM presented a slightly higher specificity (0.78) as compared
Table 2 Distribution of mood disorders and differences between groups
Variable Total
No current suicidal behavior
Current suicidal
behavior Test
Major depressive disorder 311 106 (34.08) 205 (65.93) w2= 67.75
df = 8 po0.001
Bipolar disorder 112 62 (55.36) 50 (44.64)
Moderate depressive disorder 53 30 (56.60) 23 (43.40)
Mild depressive disorder 13 12 (92.31) 1 (6.69)
Anxiety disorder 74 52 (70.27) 22 (29.73)
Mixed episode 14 12 (85.71) 2 (14.29)
Adjustment disorder 73 45 (63.01) 27 (36.99)
Dysthymia 8 5 (62.50) 3 (37.50)
Other disorders 29 15 (51.72) 14 (48.28)
Total 687 340 347
N/A (missing values)* 20 18 2
Data presented as n (%). df = degrees of freedom.
*Missing values were excluded from the statistical analysis.
Table 3 Age distribution and differences between groups
Age (years) Total
No current suicidal behavior
Current suicidal
behavior Test
14-19 80 25 (31.25) 55 (68.75) w2= 28.82
df = 5 po0.001
20-29 130 57 (43.85) 73 (56.15)
30-39 135 66 (48.89) 69 (51.11)
40-49 142 85 (59.86) 57 (40.14)
50-59 156 81 (51.92) 75 (48.08)
460 63 44 (69.84) 19 (30.16)
Total 706 358 348
N/A (missing values)* 1 0 1
Data presented as n (%). df = degrees of freedom.
with the random forest model (0.77). A fifth criterion was used to choose the final model: the number of variables used. The SVM model contained 22 variables, vs. 32
variables in the random forest model. Thus, the SVM model was chosen to generate the new clinical model, as a smaller number of variables would make the proposed model more manageable. Figure 4 shows a histogram of the accuracy values obtained with the SVM model.
Selected variables
Variables for the predictive model of the suicide risk zone were obtained by using the SVM approach. The 22 variables that compose this model for predicting suicide risk are presented in Table 6. Assessing all of these variables enables us to determine if the patient is at risk of attempting suicide or is actively thinking of making an attempt. The interrelationship between these variables is highly nonlinear, and it is interesting to note the particular ways in which they are configured for each case. These variables can be used to create an assessment tool, the items of which assess elements associated with risk as well as protection from suicidal behavior. Depending on the answers (importance or value) attributed by the respondent to each item, the clinician can determine whether they should be classified as being in the suicide risk zone. It also enables identification of individual risk and protective factors, which may contribute to therapeu-tic intervention.
Discussion
As mentioned in the Introduction, any strategy aiming at reducing risks of suicide should start by defining the at-risk population. This is certainly a complex task, since the variables traditionally associated with suicidal behavior have little predictive power in real clinical scenarios. As Pokorny37 suggested, ‘‘it is not possible to predict the moment at which a person may undertake a suicide attempt, since risk is distinctive in that it can change very rapidly’’; this remains true today. The complex nature of suicidal behavior requires the evaluation of multiple factors, which interact dynamically, may present them-selves intermittently, and may be uniquely configured in each individual. The model proposed in this study may contribute to the detection of suicide risk on the basis of a configuration of variables that can present a dynamic set of factors indicating when an individual may be at greater risk of, or engage in behavior protective from, suicide. The step of detecting the dynamic configuration of suicide risk can lead to the development of strategies to prevent suicidal behavior, which has become an important public health problem, both in Chile and worldwide, as noted elsewhere.1,2
The variables of the instrument presented herein were observed to be relevant when co-occurring (accuracy = 0.779) and may serve to indicate when a patient is at risk of suicide. This resource may be used in primary health-care services as well as in the emergency department setting. Once suicide risk is detected, health profes-sionals can gather more precise information to confirm whether the patient is in fact at risk of suicide, so as to take the necessary safety precautions. Although it is the integration of variables that results in categorizing a
patient as being at risk of suicide or not, each variable can be analyzed individually, not only for diagnostic purposes but also for therapeutic ends. Among the variables related to suicide risk, previous studies have highlighted the importance of individual unrest,38personal satisfaction,39 and reasons for living, particularly those related to beliefs in one’s own capacities and abilities to cope with situa-tions.40,41 The presence of certain variables during
evaluation (such as personal satisfaction and reasons for living) when someone is thinking about killing oneself can represent focal points that healthcare professionals may attend to when treating patients with suicidal behavior. In other words, promoting analysis of these factors during treatment may assist in distancing patients from emo-tional and cognitive states that keep them at risk of suicide.
In addition, some individual variables – such as feelings of unrest, thinking about taking one’s own life, or declaring that ‘‘nothing interests me’’ – may serve as especially useful indicators of suicide risk during triage in primary-care or emergency facilities. These indicators may alert healthcare professionals of a need to further evaluate patients and adopt safety precautions.
Among the factors mentioned as useful focal points during treatment, we highlight the following, which were recommended by the generated instrument: personal satisfaction and reasons for living. Personal satisfaction refers to the perception of being a happy person, feelings of satisfaction with life and with achievements. Reasons for living- include caring about oneself enough to live, consider-ing life to be too beautiful and precious to brconsider-ing to an end, having a love for life, feeling too stable to kill oneself, believing only God has the right to end a life, not wanting to die, wanting to experience all that life has to offer and con-sidering there are still many experiences to have, believing that it is possible to find other solutions to problems, thinking life is all we have and it is better than nothing, that having the thought of suicide is totally incomprehensible, believing that it is possible to learn to adjust or cope with problems, having hopes that things will improve and the future will be happier, and knowing that negative feelings will not last no matter how bad one feels.
The use of new methodologies in this study supports findings from previous analyses that have used traditional methods. To the best of our knowledge, this was the first study to explore suicidal behavior in a population at risk
Table 4 Parameter adjustments for each of the proposed models
Model No. folds No. iterations No. variables
Parameters for adjustment
Optimal parameters
CART 10 1 3 cp = complexity parameter cp = 0.0216763
KNN 10 10 22 k = number of neighbors k = 17
SVM 10 5 22 cost = regularization parameter cost = 1
sigma = radial basis function kernel parameter sigma = 0.0625
Random Forest 10 1 32 mtry = subset of variables used in each tree mtry = 11
AdaBoost 10 3 32 ntree = number of trees ntree = 33
maxdepth = maximum depth of each tree maxdepth = 4 alpha = type of coefficient for updating weightings alpha = Breiman
CART = Classification and Regression Tree; KNN = k-nearest neighbor; SVM = support vector machine.
Table 5 Results of validation of the five models generated
CART SVM KNN AdaBoost Random forest
Accuracy 0.72 0.78 0.73 0.76 0.78
Sensitivity 0.71 0.77 0.74 0.75 0.78
Specificity 0.74 0.79 0.73 0.76 0.77
CART = Classification and Regression Tree; KNN = k-nearest neighbor; SVM = support vector machine.
by using the methodology described above. The use of DM techniques allowed us to study a large volume of information collected from 707 patients, all with psychia-tric conditions, with and without suicidal behavior. The DM methodology also helped us investigate data from these patients, based on a total of 343 variables, from a perspective that differs from mainstream clinical thought processes or traditional statistical methods. After attribute assignment and exhaustive training of the model through a process beyond the analysis that a clinician can per-form, this pool was narrowed down to 22 variables.
By using this method, data can be analyzed without a priori hypotheses. Cleansing the data allowed us to design an assessment tool that is quick and easy to use
and assists in the determination of whether a patient is at risk of suicide with 0.779 (77.9%) accuracy. It is important to remember that the selection of factors was based on a sample of mental health patients who, by their very nature, already presented with a heightened risk of sui-cide compared with the general population. Thus, DM techniques proved useful in gathering information to identify what the greatest risk factors would be in a sample of subjects who were already at risk. This tool may be applied, retested in follow-up assessments, and further refined with each iteration when used by emer-gency services, first responders, and outpatient care providers.
The utility of the DM strategy allows us to detect a configuration of risk variables using only a subset of data selected from all available information. This technique, unlike more traditional methods, selects the most relevant variables to discriminate the risk factor, detecting hidden patterns in data that are highly nonlinear. This is why accuracy, sensitivity, and specificity are used to evaluate these models, rather than the consistency measures usually employed in the construction of new assessment tools. Nevertheless, using classical statistics, we obtained a Cronbach’s alpha coefficient of 0.6444 for the 20-variable model. However, this is not an adequate measure for DM techniques.
From the outset, this method of studying data from the sample has demonstrated the ‘‘complementary’’ role that such methods could play in clinical interventions, since they are carried out ‘‘alongside the doctor.’’ The value of these results and the DM methodology should continue to be addressed in future studies.
Regarding the limitations of this study, it seems relevant to point out that the sample was restricted to patients consulting for mental health concerns and who mainly presented with mood disorders. These findings may not be applicable to other psychiatric conditions, such as alcohol and substance dependence, eating disorders, and psychotic and cognitive disorders. While this limited the potential generalizability of the results, it allowed us to control for the diagnostic variable.
Figure 3 ROC space models. Average information from K-fold cross-validation.CART = Classification and Regression Tree; KNN = k-nearest neighbor; ROC = receiver operating char-acteristics; SVM = support vector machine.
We decided to focus our analysis on mood disorders in view of the higher prevalence of this diagnosis in clinical settings and the association of suicidal behavior with major depression.
Participants were assessed consecutively in their ‘‘natural environments’’ (i.e., in mental health services), which allowed us to capture the situation in the context in which consultations are usually carried out. However, the recruitment process was conditional to the willingness and availability of participants to be assessed at a given time. This is also a limitation, because subjects who met the inclusion criteria but refused to participate are not represented in the sample.
Our general proposal may also have other limitations. We still do not know exactly what the real risk of suicidal behavior is in the group of patients we classified as being at risk. It is highly possible that only a small portion of those in the ‘‘risk zone’’ will actually attempt suicide. This
focus seems practical, however, since it acknowledges a ‘‘risk zone’’ independently of how this risk may evolve. In other words, since we cannot know for sure who will actually attempt suicide, we can only work with what we do know. To the best of our knowledge, ‘‘risk of suicide’’ is as close as we can get to the notion of suicidal behavior, which usually emerges first in the majority of patients.12 Deepening our understanding of how this risk scenario is configured can provide resources to take action in due time. By intervening on potentially modifiable risk factors, we may be able to distinguish between patients who are actually at risk of suicide from those who are not. Undoubtedly, the true scope of this diagnostic focus should be tested in future studies.
Traditional statistical methods and mathematical DM and machine-learning techniques are entirely comple-mentary. In other words, data that may only be obtained by one method can be used by or with another so as to
Table 6 Variables included in the predictive model of suicide risk
Measure Variable Question in the measure
OQ OQPRE8_SD_n: question 8 of the OQ normalized
to a range between [0,1]
I think about taking my life.
RFL RFL19_20_24_SUPAF_n: average of questions 19, 20,
and 24 of the RFL measure normalized to a range between [0,1]
I care about myself enough to live.
Life is too beautiful and precious to bring to an end. I have a love for life.
RFL RFL25_SUPAF_n: question 25 of the RFL measure
normalized to a range between [0,1]
I am too stable to kill myself.
RFL RFL12_SUPAF_n: question 12 of the RFL measure
normalized to a range between [0,1]
Life is all we have and is better than nothing.
OQ OQPRE13_SD_n: question 13 of the OQ normalized to
a range between [0,1]
I am a happy person.
RFL RFL5_OBMOR_n: question 5 of the RFL measure
normalized to a range between [0,1]
I believe only God has the right to end a life.
OQ OQPRE31_SD_n: question 31 of the OQ normalized
to a range between [0,1]
I am satisfied with my life.
RFL RFL10_SUPAF_n: question 10 of the RFL measure
normalized to a range between [0,1]
I do not want to die.
Diagnosis T_E_DEPRE_MOD_o_SEV: indicates if the diagnosis is of a moderate or severe kind of depressive disorder/ event
Presents moderate depressive episode, severe depressive episode, major depressive disorder.
OQ OQPRE24_SD_n: question 24 of the OQ normalized to
a range between [0,1]
I am happy with myself.
Sociodemographic variable
TIENE_1_HIJO Indicates if they have exactly one child.
RFL RFL45_SUPAF_n: question 45 of the RFL measure
normalized to a range between [0,1]
I see no reason to hurry death along.
RFL RFL17_SUPAF_n: question 17 of the RFL measure
normalized to a range between [0,1]
I want to experience all that life has to offer and there are many experiences I haven’t had yet that I want to have.
RFL RFL22_SUPAF_n: question 22 of the RFL measure
normalized to a range between [0,1]
I believe I can find other solutions to my problems.
DEQ DEQPRE62_n: question 62 of the DEQ normalized to a
range between [0,1]
I am very satisfied (a) with myself (b) withwhat I have achieved.
RFL RFL50_n: question 50 of the RFL measure normalized
to a range between [0,1]
The thought of suicide is totally incomprehensible to me.
OQ OQPRE3_SD_n: question 3 of the OQ normalized to a
range between [0,1]
Nothing interests me.
RFL RFL2_n: question 2 of the RFL measure normalized to
a range between [0,1]
I believe I can learn to adjust or cope with my problems.
RFL RFL40_n: question 40 of the RFL measure normalized
to a range between [0,1]
I have hopes that things will improve and the future will be happier.
RFL RFL14_n: question 14 of the RFL measure normalized
to a range between [0,1]
No matter how badly I feel, I know that it will not last.
Accuracy = 0.779, sensitivity = 0.770, specificity = 0.790.
allow in-depth analysis of a particular problem. In this study, for instance, findings obtained from the DM tech-niques could be compared with results from traditional statistical methods. At the same time, DM can suggest which variables should be focused on for deeper analysis with traditional statistical methods. Hence, the variables obtained from this study through the use of DM can be used to further evaluate the trajectory of suicide risk by means of traditional methods.
Acknowledgements
This study received financial support from the Fondo National de Desarrollo Cientifico y Tecnologico (FONDE-CYT) for research initiation (grant no. 11121390), and was supported by the Fund for Innovation and Competi-tiveness (FIC) of the Chilean Ministry of Economy, Development and Tourism, through the Millennium Science Initiative (grant no. IS130005). The authors also thank Departamento de Psiquiatrı´a, Facultad de Medicina, Pontificia Universidad Cato´lica de Chile; Red Salud UC CHRISTUS: Clı´nica San Carlos de Apoquindo, Centro de Salud Mental San Joaquı´n, and Servicio de Salud Metropolitano Sur Oriente, Complejo Asistencial Dr. So´tero del Rı´o.
Disclosure
The authors report no conflicts of interest.
References
1 OECD. Health at a Glance 2015: OECD Indicators [Internet]. 2015 Nov 04. oecd-ilibrary.org/social-issues-migration-health/health-at-a-glance-2015_health_glance-2015-en.
2 Chile, Ministerio de Salud (MINSAL). Guı´a Clı´nica AUGE Depresion en personas de 15 an˜os y mas [Internet]. Serie Guı´as Clı´nicas Subsecretaria Salud Pu´blica. 2013. supersalud.gob.cl/difusion/572/ articles-652_recurso_1.pdf.
3 Gobierno de Chile. Metas 2011-2020: elige vivir sano. Estrategia Nacional de Salud para el cumplimiento de los Objetivos Sanitarios de la De´cada 2011-2020 [Internet]. http://web.minsal.cl/portal/url/ item/c4034eddbc96ca6de0400101640159b8.pdf.
4 Chile, Ministerio de Salud. Situacio´n actual del suicidio adolescente en Chile, con perspectiva de ge´nero [Internet]. 2013 Dec. web.min-sal.cl/sites/default/files/files/SituacionActualdelSuicidioAdolescente. pdf.
5 Fowler JC. Suicide risk assessment in clinical practice: pragmatic guide-lines for imperfect assessments. Psychotherapy (Chic). 2012;49:81-90. 6 Powell J, Geddes J, Deeks J, Goldacre M, Hawton K. Suicide in
psychiatric hospital in-patients. Risk factors and their predictive power. Br J Psychiatry. 2000;176:266-72.
7 Randall JR, Colman I, Rowe BH. A systematic review of psychometric assessment of self-harm risk in the emergency department. J Affect Disord. 2011;134:348-55.
8 Large M, Sharma S, Cannon E, Ryan C, Nielssen O. Risk factors for suicide within a year of discharge from psychiatric hospital: a sys-tematic meta-analysis. Aust N Z J Psychiatry. 2011;45:619-28. 9 Oquendo MA, Currier D, Mann JJ. Prospective studies of suicidal
behavior in major depressive and bipolar disorders: what is the evi-dence for predictive risk factors?. Acta Psychiatr Scand. 2006; 114:151-8.
10 Rosen DH. Suicide Survivors A follow-up study of persons who survived jumping from the Golden Gate and San Francisco-Oakland Bay Bridges. West J Med. 1975;122:289-94.
11 Seiden RH. Where are they now? A follow-up study of suicide attempters from the Golden Gate Bridge. Suicide Life Threat Behav. 1978;8:203-16.
12 O’Connor RC, Nock MK. The psychology of suicidal behaviour. Lancet Psychiatry. 2014;1:73-85.
13 Simon RI. Imminent suicide: the illusion of short-term prediction. Suicide Life Threat Behav. 2006;36:296-301.
14 Oquendo M, Baca-Garcia E, Arte´s-Rodrı´guez A, Perez-Cruz F, Galfalvy HC, Blasco-Fontecilla H, et al. Machine learning and data mining: strategies for hypothesis generation. Mol Psychiatry. 2012; 17:956-9.
15 Rana S, Gupta S, Venkatesh S, Berk M, Harvey R. An analysis of suicide risk assessment [Internet]. 2012. https://www.academia.edu/ 13879097/An_Analysis_of_Suicide_Risk_Assessment?auto=download. 16 Tran T, Phung D, Luo W, Harvey R, Berk M, Venkatesh S. An inte-grated framework for suicide risk prediction. In: Proceedings of the 19th ACM SIGKDD International Conference on Knowledge Dis-covery and Data Mining - KDD ’13 [Internet] New York: ACM Press; 2013. 1410-8.
17 Manzini J. Declaracio´n de Helsinki: principios e´ticos para la investi-gacio´n me´dica sobre sujetos humanos. Acta Bioeth. 2000;6:321-34. 18 Lambert MJ, Burlingame GM, Umphress V, Hansen NB, Vermeersch DA, Clouse GC, et al. The reliability and validity of the outcome questionnaire. Clin Psychol Psychother. 1996;3:249-58.
19 Von Bergen A, De la Parra G. OQ-45.2, Cuestionario para Evalua-cio´n de Resultados y EvoluEvalua-cio´n en Psicoterapia: adaptaEvalua-cio´n, vali-dacio´n e indicaciones para su aplicacio´n e interpretacio´n. Ter Psicol. 2002;20:161-76.
20 Forgays DG, Forgays DK, Spielberger CD. Factor structure of the State-Trait Anger Expression Inventor. J Pers Assess. 2010;69:497-507. 21 Leibovich de Figueroa N, Schmidt V, Gol S. El Inventario de
Expre-sio´n de Enojo Estado-Rasgo (STAXI) y su uso en diferentes pobla-ciones. RIDEP. 2001;11:55-74.
22 Garcı´a Valencia J, Palacio Acosta CA, Vargas G, Arias S, Ocampo MV, Aguirre B, et al. Validacio´n del "Inventario de Razones para Vivir" (RFL) en sujetos con conducta suicida de Colombia. Rev Colomb Psiquiatr. 2009;38:66-84.
23 Linehan MM, Goodstein JL, Nielsen SL, Chiles JA. Reasons for staying alive when you are thinking of killing yourself: the reasons for living inventory. J Consult Clin Psychol. 1983;51:276-86.
24 Blatt SJ, D’Afflitti JP, Quinlan DM. Experiences of depression in normal young adults. J Abnorm Psychol. 1976;85:383-9.
25 Gargurevich R, Luyten P, Corveleyn J. Dependency, self criticism, social support and postraumatic Peruvian university students. Int J Psychol. 2008;43:435.
26 Maddaleno M, Horwitz N, Jara C, Florenzano R, Zalazar D. [Use of an instrument to qualify family function in the care of adolescents]. Rev Chil Pediatr. 1987;58:246-9.
27 Smilkstein G. The family APGAR: a proposal for a family function test and its use by physicians. J Fam Pract. 1978;6:1231-9.
28 Singh S, Gupta P. Comparative study ID3, cart and C4 .5 decision tree algorithm: a survey. Int J Adv Inf Sci Technol [Internet]. 2014;27:97-103. citeseerx.ist.psu.edu/viewdoc/download?doi=10.1.1.685.4929&rep= rep1&type=pdf.
29 Garcı´a Cambronero C, Go´mez Moreno I. Algoritmos de aprendizaje: knn & kmeans [Internet]. 1993. www.it.uc3m.es/jvillena/irc/practicas/ 08-09/06.pdf.
30 Breiman L. Random forests [Internet]. 2001 Jan. stat.berkeley.edu/ Bbreiman/randomforest2001.pdf.
31 Freund Y, Schapire RE. A desicion-theoretic generalization of on-line learning and an application to boosting. Comput Learn Theory. 1995;904:23-37.
32 Koskela T, Lehtokangas M, Saarinen J, Kaski K. Time Series Prediction with Multilayer Perceptron, FIR and Elman Neural Networks (1996). In: Proceedings of the World Congress on Neural Networks; 1996 491-6. 33 Boser BE, Guyon IM, Vapnik VN. A training algorithm for optimal margin
classifiers [Internet]. 1992. 144-52. w.svms.org/training/BOGV92.pdf. 34 Gunn SR. Support vector machines for classification and regression
[Internet]1998 May 14. svms.org/tutorials/Gunn1998.pdf.
35 Burguen˜o MJ, Garcı´a-Bastos JL, Gonza´lez-Buitrago JM. [ROC curves in the evaluation of diagnostic tests]. Med Clin (Barc). 1995;104:661-70.
37 Pokorny AD. Prediction of suicide in psychiatric patients. Report of a prospective study. Arch Gen Psychiatry. 1983;40:249-57.
38 Anestis MD, Bagge CL, Tull MT, Joiner TE. Clarifying the role of emo-tion dysregulaemo-tion in the interpersonal-psychological theory of suicidal behavior in an undergraduate sample. J Psychiatr Res. 2011;45: 603-11.
39 Koivumaa-Honkanen H, Honkanen R, Viinama¨ki H, Heikkila¨ K, Kaprio J, Koskenvuo M. Life Satisfaction and Suicide: a 20-year follow-up study. Am J Psychiatry. 2001;158:433-9.
40 Demyttenaere K, Desaiah D, Raskin J, Cairns V, Brecht S. Suicidal thoughts and reasons for living in hospitalized patients with severe depression: post-hoc analyses of a double-blind randomized trial of duloxetine. Prim Care Companion CNS Disord. 2014;16(3). doi: 10.4088/PCC.13m01591. Epub 2014 May 1.