STYLIZED FACTS OF ROMANIAN BUSINESS CYCLE. THE LITERATURE (I)
Meşter Ioana Teodora
University of Oradea, Faculty of Economics
If the more or less regulate moves of the macroeconomic variables are accepted by the economists as a reality, the problem of measuring the aggregate level of the economy in direct correlation with these fluctuations is much more difficult, due to the numerous variables involved.
The way these variables move in time is very different from a period to another as well as from a country to another. While some variables have already reached their maximum level, others are on their descendent slope. This is the reason why the measurement problem of the aggregate level of the macroeconomic activity deserves our attention. Finding the patterns macroeconomic variables move together and influence each other is important both as a theoretical challenge, but for its practical utility as well.
Depending on the result of the measurement process, the authorities are able to conduct their economic policies. More precisely, the monetary or fiscal authority will act differently if the economy is in recession or in expansion. These are the reasons for which a very important phase in the study of the cycle is its descriptive analysis, which is realized by focusing on certain aspects, such as: the length and magnitude, the correlation of the economic variables with the reference series, the study of the cyclical indicators, the analysis of the relative variability of economic series, the diagnose and prevision based on the cyclical indicators.
The first part of this paper presents the relevant literature regarding the evolution of business cycle models
as well as the stylized facts of business cycles. In the second part of the paper we’ll deal with the most frequent decomposing techniques as well as with the stylized facts for Romania’s business cycle. Finally,
these stylized facts are used to validate a real business cycle model for the Romanian economy.
Keywords: business cycles, stylized facts, comovements JEL codes: E12
Describing Business Cycles
In order to understand why economies are subject to business cycles, it is important to have a good grasp on the empirical regularities (and irregularities) of the key macroeconomic variables that fluctuate as the economy contracts and expands.
One purpose of this paper is to present the quantitative aspects of business cycles, more precisely the depth and duration of both individual and average economic contractions and expansions. The second is to describe the qualitative aspects of business cycles - how different macroeconomic variables move in relation to each other during contractions and expansions. A good understanding of the business cycle data will provide some basic empirical facts that will be used to evaluate the competing theories as well as models that attempt to explain the causes of the cyclical evolution of economies or to provide some forecasts for the future evolution of economies.
Some basic facts
Business cycles are a controversial topic that has been subject to many debates. Economists have not found a consensus on the causes of the cyclical evolution of the economies, the impulses that generate the succession of the phases of a cycle or the propagation methods. Using a variety of econometric techniques, economists have studied a wide range of empirical regularities in macroeconomic fluctuations and business cycles across countries. These stylized facts have often been used as an empirical basis for formulating theoretical models of the business cycle and as a way to discriminate among different types of models.
The classical economists were the first to try to give an explanation of the cyclical moves of the macroeconomic variables, but they blamed cycles on exogenous factors, such as war. Jean Charles de Sismondi (1819) was the one that tried for the first time to give a systematic exposition of economic crisis and he believed that the causes of business cycles were overproduction and underconsumption, which were caused in particular by wealth inequalities. The vision of the classical theory was dramatically contradicted by the realities of the Great Depression. As a response, the Keynesian Macroeconomic models of the 1940's were the first to attain a certain level of explicitness and empirical accuracy. Yet the ability of these models to imitate actual economies has almost nothing to do with their ability to make accurate forecasts, to evaluate how behavior would have differed had certain policies been different in specified ways. The Keynesian paradigm, which reached its highest status toward the end of the 60’s, was contradicted by the realities of the market economies so they failed to predict the crises from the 70’s. Keynesian models, constructed by simply codifying the decision rules that agents found useful over some previous sample period, without explaining why these rules are used, proved to be of no use in predicting the consequences of policy changes.
Thus we witnessed the resurrection of the controversy between the classical and the Keynesist theories, which lead to a rivalry between two schools, the Real Business Cycles School and the New Keynesian School.
Real business cycles approach originated in the pioneering work of Kydland and Prescott (1982) and Long and Plosser (1983). As Minford and Sofat (2004) argue, this literature was an outgrowth of the equilibrium strategy for business cycle analysis initiated by Lucas (1972, 1973, 1975) and extended by Barro (1976, 1981), but differs from them in two critical aspects. First, RBC models place much more emphasis on mechanisms involving cycle propagation, that is, spreading over time of the effects of a shock and second RBC models emphasize the extent to which shocks that initiate the cycles are real-as opposed to- monetary in origin. Comprehensive reviews of the RBC research by McCallum (1989) and Plosser (1989) have illustrated that despite a number of unresolved issues, the approach successfully explains some of the key empirical regularities that characterize economic fluctuations.
The greatest advantage of the RBC approach is that the structural equations of the model have been derived via an optimization, so that the parameters of the model (preferences and technology) can be regarded as truly “structural” (Minford and Sofat: 2004). We are talking here about an equilibrium model, which is by definition constructed to predict how agents with stable tastes and technology will choose to respond to a new situation and that can be used to analyze how certain macroeconomic variables are likely to respond to economic shocks (Minford and Sofat: 2004). Many extensions have been made to the traditional RBC models, particularly the role of government – Mankiw (1989), Christiano and Eichenbaum (1992), role of money - King and Plosser (1984), Cooley and Hansen (1989).
Stylized facts of business cycles. Cyclical behavior of significant macroeconomic variables What general properties and relationships can be gathered from studying business cycle data? Documenting the stylized facts or broad regularities on macroeconomic fluctuations could be useful for a number of reasons. The identification of these regularities could be useful for analyzing whether similar empirical regularities are observed across countries with different income levels (Agenor, McDermott, Prasad, 2000). These stylised facts could provide an empirical basis for constructing analytical models of short-run fluctuations that incorporate features particularly important to developing countries. In addition, these findings may have important policy implications, they may also be crucial for designing stabilization and adjustment programs (Agenor, McDermott, Prasad, 2000).
business cycle (Knoop, 2010). These are presented as follows. Business cycles are not cyclical. The term business cycle is a misnomer, because it implies that recessions and expansions follow a regular, predictable pattern. The length of one business cycle is not a reliable indicator of the length of the next business cycle. Business cycles are not symmetrical. Recessions tend to be characterized by larger changes in output than expansions. Thus, as a general rule, recessions tend to be shorter but with sharper changes in GDP, while expansions tend to be longer but with more gradual changes in GDP. Business cycles have not changed dramatically over time. Recessions are somewhat shorter but expansions are significantly longer in the post war period than in the past. This means that recessions have been less frequent than they were in previous eras, though this result has been largely driven by two long expansions in the 1980s and 1990s (Knoop, 2010). The components of GDP exhibit much different behaviors than GDP itself. The components of GDP are consumption, investment, government purchases, and net exports. Investment and durable consumption are highly volatile and change more than output over the business cycle, investment has also played a significant part in many of the theories of business cycles. As Knoop argues, government purchases are acyclical and not very volatile. Net exports are slightly countercyclical, meaning that net exports tend to rise during recessions and offset some of the falls in output. However, net exports are not a reliable indicator of peaks and troughs in GDP. Business cycles are associated with big changes in the labor market. Unemployment is strongly countercyclical, and changes in employment are much larger during recessions than the changes in other inputs into production. This seems to suggest that any plausible theory of business cycles has to give a prominent role to the cyclical behavior of the labor market (Knoop, 2010).
In order to evaluate and compare competing business cycle models, the evolution of most significant variables has been studied by economists – these variables are unemployment rate, inflation rate, the consumer price index, real wages, interest rates, capacity utilization, productivity, stock prices and the money supply. Out of these, unemployment rate is proved to be countercyclical, wages are acyclical, the rest of the indicators being procyclical and leading indicators.
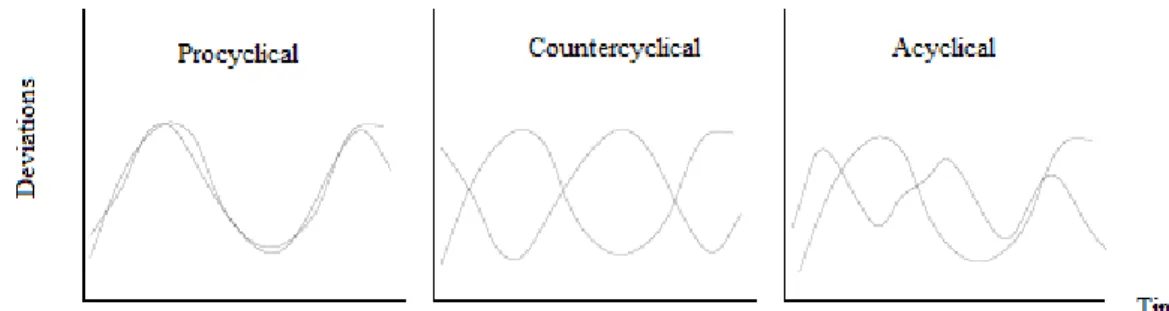
A quick analysis of GDP and other macroeconomic variables show us that they have a certain common behavior during time, this property being called simultaneous movement or comovement. We are able to classify these movements into 3 different types: procyclical movements, if variables move simultaneously, acyclical movements, if there is no obvious correlation between the two series and countercyclical movements, if the series have a similar behavior but with a certain time lag. A graphical representation of two variables will ease the identification of the variabile type. Here are the three particular situations’ graphical representation:
Fig. no. 1. Simultaneous movements of macroeconomic variables
Source: the author
Fig. no. 2. Simultaneous movements of macroeconomic variables – identification using the scatterplot
Source: the author
Not all the variables have the same amplitude. We will compare the series’ amplitude with the one of GDP chronogramme - Figure no. 3 shows two particular cases.
Fig. no. 3. Business cycle amplitude
Source: the author
The time extent of business cycles is different, but as a general rule it ranges from 2 to 8 years. The length of the business cycle is in positive correlation with its persisance – the longer the cycle, the higher the its persistance, as seen in Figure no. 4.
Fig. no. 4. Business cycle persistance
Source: the author
graphs, we search inevitably the turning points (upper or lower ones), comparing them with different variables – their frequency, their correlation in time. When using real data, the turning points are quite difficult to identify, so we need supplementary analysis instruments, in order to reveal the stylised facts of business cycles, and these intruments are statistical ones.
For example, standard deviation measures the volatility of macroeconomic series, as it shows the extent to which series vary from their mean. The higher the standard deviation of a variable, the higher its volatility. Correlation measures the simultaneous movement of two variables. With values that range from -1 to 1, it shows the direction of the relationship between the series. A negative value of the correlation coefficient shows a disincronisation. If the correlation of GDP with another series is close to 1, it proves that the variable is procyclical, while a value close to -1 indicates a countercyclical series. When the correlation coefficient is close to 0, it proves that the series is acyclical. We should also mention here that a correlation that is close to 1 does not indicate that the series are equivalent, as their standard deviation might be significantly different. With the help of these two instruments we will be able to identify the stylised facts of business cycles:
- Comovement: it will be revealed using the correlation of particular macroeconomic series with the GDP as well as with other aggregate variables.
- Amplitude: the standard deviation of a certain variable will not provide useful information unless it is compared to the one of the GDP. In this regard, the comparison between different variables standard deviation will reveal which series is more or less volatile.
- The persisance or the frequency: one of the methods of measuring it is the correlation between a certain variable’s values with the its lagged values.
- Simultaneous or lagged deviations are revealed using the correlation coefficient for the simultaneous and lagged series. If the lagged series correlation coefficient is higher than that of the simultaneous series, the variabiles are lagged.
Even though we have presented the main instruments for the analysis of hystorical data, these are not sufficient, as they might not be relevant, for numerous reasons. In order to reveal the true evolution ofvariables, several decomposition techniques are being used. These techniques, which have as a purpose the separation of the components of macroeconomic variables (trend, cyclical, seasonal and residual component) will be presented in the second part of this paper.
Conclusions
A number of different models developed over the past 250 years have attempted to explain the nature and causes of recessions and depressions. A significant part of these models generate predictions that are more or less consistent with the empirical data. The first part of this paper has presented the relevant literature regarding the evolution of business cycle models as well as the stylized facts of business cycles. In the second part of the paper we’ll deal with the most frequent decomposing techniques as well as with the stylized facts for Romania’s business cycle. Finally, these stylized facts are used to validate a real business cycle model for the Romanian economy.
References
Agenor, Pierre Richard, McDermott John, Prasad, Eswar (2000), „Macroeconomic fluctuations in Developing countries: some stylised facts”, The world bank economic review, Volume 14 issue 2, pp. 251-85, May.
Barro, Robert J., (1976), "Rational expectations and the role of monetary policy," Journal of Monetary Economics, Elsevier, vol. 2(1), pp. 1-32, January.
Christiano, Lawrence J. and Eichenbaum, Martin, (1992), "Liquidity Effects and the Monetary Transmission Mechanism," American Economic Review, American Economic Association, vol. 82(2), pp. 346-53, May.
Cooley, Thomas F. and Hansen, Gary D., (1989), "The Inflation Tax in a Real Business Cycle Model", American Economic Review, American Economic Association, vol. 79(4), pp. 733-48, September.
de Sismondi, Charles, (1819), New Principles of Political Economy: Of Wealth in Its Relation to Population.
Gagea, Mariana, (2009), Analiza seriilor de timp sezoniere, Ed. Sedcom Libris, Iaşi, 2009.
King, Robert G. and Plosser, Charles I., (1984), "Money, Credit, and Prices in a Real Business Cycle", American Economic Review, American Economic Association, vol. 74(3), pp. 363-80, June.
Knoop, Todd, A., (2010), Recessions and depressions: understanding business cycles, Greenwood Publishing Group
Kydland, Finn, E. and Prescott, Edward, C. (1982), “Time to Build and Aggregate Fluctuations”, Econometrica, Volume 50, Issue 6, pp. 1345-70.
Long, John B. Jr. and Plosser, Charles I., (1983), "Real Business Cycles", Journal of Political Economy, 91(1), pp. 39-69.
Lucas, Robert E., Jr., (1972), "Expectations and the Neutrality of Money", Journal of Economic Theory 4 (2): pp. 103–124.
Lucas, Robert E., Jr., (1973), "Wage Inflation and the Structure of Regional Unemployment: Comment," Journal of Money, Credit and Banking, Blackwell Publishing, vol. 5(1), pp. 382-84, Part II F.
Lucas, Robert E., Jr., (1975), "An Equilibrium Model of the Business Cycle," Journal of Political Economy, University of Chicago Press, vol. 83(6), pp. 1113-44, December.
Mankiw, N. Gregory, (1989), "Real Business Cycles: A New Keynesian Perspective," Journal of Economic Perspectives, American Economic Association, vol. 3(3), pp. 79-90, Summer.
McCallum, Bennett T., (1989), "New Classical Macroeconomics: A Sympathetic Account," Scandinavian Journal of Economics, Wiley Blackwell, vol. 91(2), pp. 223-52.
Minford, Patrick, Sofat, Prakriti, (2004), An Open Economy Real Business Cycle Model for the UK, Money Macro and Finance (MMF) Research Group Conference 2004 23, Money Macro and Finance Research Group, available online http://repec.org/mmfc04/23.pdf