Introduction
Assessment of cardiac autonomic nervous system modula-tion during an incremental stress test or during the recov-ery phase has been considered a promising strategy for risk stratiication and exercise prescription for different populations1,2,3,4,5. As established, during exercise there is reciprocity in heart rate modulation between sympathetic hyperactivity and parasympathetic inhibition6,7,8; short-term, post-exercise cardiovascular adaptation is associated with a simultaneous rapid increase in parasympathetic and decrease in sympathetic activity9,10.
Time-domain analysis and Poincaré method plotting of spon-taneous heart rate variability (HRV) based on an R-R interval (i-RR) series is a feasible, non-invasive tool for evaluating cardiac autonomic modulation in different functional conditions7,10. These allow an indirect inference about cardiac autonomic nervous system control on the sinus node6,7,9.
During incremental stress tests, an exponential reduction in the root mean square of successive differences between the adjacent normal R-R intervals (r-MSSD, temporal index) and the standard deviation of instantaneous beat-to-beat vari-ability (SD1, Poincaré index) are expected consequences of reduced parasympathetic activity. The point where the values in these two parasympathetic indices are stabilized is called the heart rate variability threshold (HRVT) and is considered an
indicator of parasympathetic deactivation during an incremental exercise test6,7,11.
Recent publications demonstrated that HRVT coincided with the irst ventilatory threshold and lactate threshold, suggesting that HRVT might be a practical and attractive alternative to identify adequate workload for exercise pre-scription4,12,13. Conversely, analysis of vagal activity imme-diately post-exercise has been considered a complementary alternative for monitoring training status and control of internal load14,15,16.
Therefore, considering the clinical and functional implica-tion of vagal assessment during physical stress and its recovery, previous studies have assessed the validity of HRV indexes to represent vagal activity under these conditions7,9. However, the reproducibility of HRV analysis in the exercise test (HRVT) and in the recovery phase are not fully established.
Considering that both HRVT and parasympathetic reacti-vation are autonomic phenomena assessed in non-stationary conditions, is essential to evaluate their reproducibility during exercise test and its recovery period, since a poor reproduc-ibility may lead to erroneous inference about the subject’s physiological status. Therefore, we aimed to evaluate the reproducibility of HRVT and parasympathetic reactivation immediately after a submaximal stress test in young, physi-cally active men.
Original Article (short paper)
Reliability of heart rate variability threshold and
parasympathetic reactivation after a submaximal
exercise test
Carlos Janssen Gomes da Cruz Paloma da Silva Rolim
Deleon de Souza Pires Christopher Marcos Oliveira Mendes
Gabriel Monteiro de Paula
Centro Universitário Euro Americano-UNIEURO, Brasília, DF, Brasil.
Luiz Guilherme Grossi Porto Giliard Lago Garcia Guilherme Eckhardt Molina Universidade de Brasília, Brasília, DF, Brasil
Abstract — The objective of this study was to evaluate reproducibility of heart rate variability threshold (HRVT) and parasympathetic reactivation in physically active men (n = 16, 24.3 ± 5.1 years). During the test, HRVT was assessed by SD1 and r-MSSD dynamics. Immediately after exercise, r-MSSD was analyzed in segments of 60 seconds for a period of ive minutes. High absolute and relatively reproducible analysis of HRVT were observed, as assessed by SD1 and r-MSSD dynamics (ICC = 0.92, CV = 10.8, SEM = 5.8). During the recovery phase, a moderate to high reproducibility was observed for r-MSSD from the irst to the ifth minute (ICC = 0.69–0.95, CV = 7.5–14.2, SEM = 0.07–1.35). We conclude that HRVT and r-MSSD analysis after a submaximal stress test are highly reproducible measures that might be used to assess the acute and chronic effects of exercise training on cardiac autonomic modulation during and/or after a submaximal stress test.
Methods
Participants
We evaluated 16 healthy, physically active, male non-athlete subjects, aged 24.3 ± 5.1 years (range: 20–32 years), with body mass index (BMI) of 25.1 ± 3.7 kg/m2 (range: 22.8–29.7 kg/m2). They underwent exercise testing during the afternoon, between 2:00 and 5:00 pm, and had previously been instructed to abstain from stimulants, alcoholic beverages, medicines, and physical activity for at least 48 h prior. The volunteers were oriented to the experimental protocol before the beginning of the tests, and all signed an informed consent to participate, with the approval of the Ethical Committee on Human Research of the UNIEURO University Center in compliance with the Brazilian National Research Ethics System Guidelines and Declarations of Helsinki.
First, we obtained anthropometrical, clinical and basic physiological data, and information on lifestyle, habits, and physical activity level using the International Physical Activity Questionnaire (IPAQ)17.
The basic physiological data, blood pressure and HR (HRbaseline) were measured after 10 minutes in the supine posi-tion according to a protocol standardized in our laboratory18. All measures were performed in a quiet, clinical laboratory room at controlled ambient temperature (21–24ºC).
The incremental exercise test on the treadmill was applied immediately after the basic physiological data assessment. The experimental design consisted of three visits to our laboratory at intervals between 48 and 72 hours; at each visit the participants were subjected to a standardized exercise test.
Heart rate variability analysis
The R-R interval series was obtained by the model RS800CX Polar cardiac monitor® at a sampling frequency of 1,000 HZ19,20. Then, each series was transferred to a microcomputer for ofline
data processing and analysis of R-R interval variability, employ-ing a Kubios HRV analyzer (Matlab TM version 2.0 beta, Kuopio,
Finland). Before processing the HRV data, all R–R interval series were visually veriied on a beat-to-beat basis to validate sinus
rhythm and identify ectopic beats, artifacts, and signal reliability.
When present, spurious beats were deleted from the series with their
previous and following intervals, without adding new intervals. The time-domain index measured was the root mean square of successive differences between the adjacent normal R–R intervals (r-MSSD). The Poincaré plot was measured as the instantaneous beat-to-beat variability of the date (SD1). Both measures relect the cardiac parasympathetic modulation.
Exercise test and recovery
A submaximal incremental exercise test on a treadmill (Centurion, Micromed) was conducted. The test protocol included a two-minute preliminary warm-up period at a constant 3.0 km/h and 2.5% slope for adaptation. Immediately after the warm-up, the
effective exercise test protocol was started at an initial velocity of 3.0 km/h, which was increased by 1.0 km/h each minute until the volunteer reached 85% of his maximum heart rate (HRmax), predicted by the formula HRmax = 208–(0.7 × age)21. The incline of the treadmill was set at 2.5% throughout the test.
After achieving 85% of HRmax (HRpeak), the exercise protocol was interrupted and an active 5-minute recovery phase was immediately started, with the speed of treadmill reduced to 2.4 km/h but keeping the incline at 2.5% 1.
Determination of heart rate variability threshold and parasympathetic reactivation
Before HRVT determination, artifacts were removed by visual inspection when necessary (<3%). We adopted this analysis because < 3% is within the standards commonly used in the literature to proceed this analysis22.
The 60 seconds of i-RR analysis in each stage were performed using the Kubios HRV analyzer software previously mentioned. HRVT was considered the load (m/min) corresponding to the point of stabilization at which there was no further signiicant decline in the values of the r-MSSD (HRVTr-MSSD) and SD1 (HRVTSD1) variables during the incremental test by means of visual graphic evaluation13,23. The HRVT analysis was performed by two independent evaluators with considerable experience in this analysis, and in case of disagreement between them, a third evaluator would be consulted to examine the graph. All data were analyzed by consensus between the two evaluators; thus, the third evaluator was not necessary.
Heart rate variability after submaximal exercise test
While a progressive increase in the R-R interval was gener-ally observed during initial recovery, the r-MSSD index was calculated each minute for ive minutes after exercise cessation using time-varying analysis9. The r-MSSD is widely used to analyze the parasympathetic reactivation after maximal and submaximal exercise24,25,26,27.
Statistical analysis
of the mean (CV = standard deviation/mean × 100). SEM quantiies the precision of individual scores on a test and was calculated as follows28:
SEM = √MSE,
where MSE is the mean-squared error.
Results
Considering the hemodynamic variables evaluated at rest condi-tion, no signiicant differences were observed between the three trials (p = 0.30–0.62, Table 1).
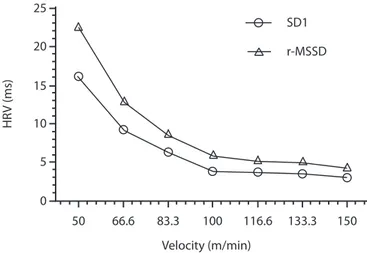
As shown in Table 3, higher relative and absolute repro-ducibility were observed in HRVTSD1 (ICC = 0.92, CV = 10.8, SEM = 5.8) and HRVTr-MSSD (ICC = 0.92, CV = 10.8, SEM = 5.8). Similar absolute and relative reproducibility observed in HRVTSD1 and HRVTr-MSSD can be explained by the physiologi-cal nature of the markers, both representing parasympathetic activity, which results in a similar kinetic during an incremental stress test (Figure-1).
Table 2: The mean and standard deviation of heart rate variability
threshold and post-exercise r-MSSD analysis assessed on three oc -casions.
Variables Trial 01 Trial 02 Trial 03 p
HRVTSD1
(m/sec) 128.6 ± 23.8 129.6 ± 24.4 130.7 ± 25.6 0.86
HRVTr-MSSD
(m/sec) 128.6 ± 23.8 129.6 ± 24.4 130.7 ± 25.6 0.86
r-MSSD1 1.4 ± 0.45 1.4 ± 0.56 1.4 ± 0.53 0.94
r-MSSD2 1.9 ± 0.55 1.8 ± 0.74 1.9 ± 0.60 0.75
r-MSSD3 1.9 ± 0.61 1.9 ± 0.73 1.8 ± 0.61 0.66
r-MSSD4 2.0 ± 0.73 1.9 ± 0.65 1.9 ± 0.69 0.29
r-MSSD5 2.2 ± 0.92 1.8 ± 0.66 1.8 ± 0.65 0.21
ANOVA for repeated measures. HRVTSD1: heart rate variability threshold evaluated by SD1; HRVTr-MSSD: heart rate variability threshold evaluated by r-MSSD; r-MSSD1 to r-MSSD5: r-MSSD analysis from irst to ifth minute of recovery.
Table 1: The mean and standard deviation of resting hemodynamics variables assessed on three occasions.
Variables Trial 01 Trial 02 Trial 03 p
HRbaseline (bpm) 61.1 ± 9.9 63.3 ± 12.4 63.3 ± 10.7 0.34
SBP (mmHg) 115.2 ± 7.8 116.1 ± 9.3 117.3 ± 10.3 0.30
DBP (mmHg) 74.6 ± 8.8 74.7 ± 5.9 72.9 ± 10.3 0.62
ANOVA for repeated measures. HRbaseline: resting heart rate; SBP: systolic
blood pressure; DBP: Diastolic blood pressure.
Table 3: Absolute and relative reproducibility of heart rate variability
threshold and post-exercise r-MSSD analysis.
Variables (95% conidence)ICC (95% conidence)CV% SEM
HRVTSD1
(m/min) 0.92 (0.82-0.87) 10.8 (0.61-21.1) 5.8
HRVTr-MSSD
(m/min) 0.92 (0.82-0.97) 10.8 (0.61-21.1) 5.8
r-MSSD1 0.87 (0.72-0.95) 14.2 (17.3, 38.2) 0.07
r-MSSD2 0.92 (0.83-0.97) 8.9 (-2.5, 18.7) 0.20
r-MSSD3 0.91 (0.80-0.96) 9.2 (-6.8, 25.4) 0.25
r-MSSD4 0.95 (0.90-0.98) 8.4 (-1.8, 18.8) 0.37
r-MSSD5 0.69 (0.28-0.88) 7.5 (-4.5, 19.6) 1.05
ICC: intraclass correlation coeficient; CV: coeficient of variation; SEM:
standard error of measurement; HRVTSD1: heart rate variability threshold evaluated by SD1; HRVTr-MSSD: heart rate variability threshold evaluated by r-MSSD; r-MSSD1 to r-MSSD5: r-MSSD analysis from irst to ifth minute of recovery.
Velocity (m/min) 15
66.6
50 83.3 100 116.6 10
20 25
0 5
133.3 150 SD1
r-MSSD
HR
V (ms)
Figure 1. Heart rate variability dynamics during a submaximal ex -ercise test.
Higher ICC values were also observed in r-MSSD from minutes 1–4 in the recovery phase (ICC > 0.87, CV < 14.7, SEM < 0.37). In the ifth minute of recovery, the ICC val -ues were somewhat lower, whereas SEM val-ues were higher (ICC = 0.69, CV = 7.5, SEM = 1.05).
Discussion
The major inding of this study is the higher relative and absolute reliability observed in HRVTSD1 and HRVTr-MSSD measurements identiied by visual inspection. Additionally, the analysis of r-MSSD in the initial phase of recovery (5 minutes) also showed moderate to high reproducibility.
HRVT is a valid indicator of parasympathetic withdrawal during exercise6,7. An increasing amount of evidence shows that the HRVT point coincides with the ventilatory and lactate threshold4,11,12,13, which are considered simple and practical mea-sures for estimating the aerobic/anaerobic transition. Therefore, our results suggest that, beyond being a valid indicator of para-sympathetic withdrawal, HRVT is a reproducible measure in a submaximal exercise test.
Relative reliability is the degree to which individuals maintain their position in a sample with repeated measurements, and it was considered very high when ICC was higher than 0.90, high at 0.70–0.89 and moderate at 0.50–0.69. The results were con-sidered unreliable when ICC was lower than 0.50. Corroborating our indings, Candido et al.23 found very high relative reproduc-ibility for analysis of HRVT analyzed by visual inspection of SD1 (ICC = 0.81) and r-MSSD (ICC = 0.81) dynamics in six incremental tests on a cycle simulator. Dourado and Guerra29 also observed excellent relative reliability of HRVT during the incremental shuttle-walk test in healthy subjects (ICC= 0.92).
However, to our knowledge, this is the irst study that investigates the reproducibility of HRVT measure in an incre-mental submaximal exercise test on a treadmill in healthy male subjects. Although the reliability of the measure has been tested in previous studies, it needs to be tested in different protocols and populations for more comprehensive understanding and for practical applications23,29.
Absolute reliability represents the degree to which repeated measurements vary for individuals28. Good absolute reliability was also observed in HRVT and in post-exercise r-MSSD analy-sis. The CV and SEM of HRVTSD1 and HRVTr-MSSD indicate low variation of these markers, occurring with a magnitude inferior to the load increment for each stage (16.6 m/min). Similar results are observed by Candido et al.23, who found CV values ranged from 11.4 to 13.1% for HRVTSD1 and HRVTr-MSSD, respectively, values slightly higher than those found in this study (CV = 10.8% for HRVTr-MSSD and HRVTSD1).
In practical terms, when small variations in HRVT are observed in different tests, an interval not greater than 16.6 m/ min (1 km/h) should be considered when evaluating the train -ing effects of this variable. For example, an increase of 1 km/h in HRVT occurrence after an exercise training program can be the result of random error and not an adaptation to the training program. Additionally, in a protocol adopted in this study, HRVT measured by SD1 and r-MSSD were observed in similar effort intensities in most cases.
Immediately after a stress test (5 min), good relative and absolute reproducibility were observed in r-MSSD values ob-tained in 60-second segments during active recovery, especially in the irst four minutes of the recovery phase. Dupuy et al.26 observed a larger range in ICC for HRV analysis after a maximal
and submaximal exercise test; however, after the submaximal protocol, moderate relative reliability was identiied for r-MSSD (ICC = 0.70). The greater reliability found in our study may be explained by methodological differences, such as the length of the R-R interval segment analyzed, the stress test protocol and especially the recovery phase mode.
Analysis of parasympathetic withdrawal and reactivation has been used to monitor acute14,25,30 and chronic31,32,33 adaptations induced by physical training on cardiac autonomic function. Our indings suggest that HRVT and short analysis of r-MSSD (i.e., 60 s) during active recovery on a treadmill can be a good and reliable methods for assessing vagal dynamics during and after exercise.
The main limitation of this study is the small sample size; however, the consistency and magnitude of the observed results minimize this limitation. Another relative limitation that should be addressed is the absence of ventilatory and/or lactate threshold assessment during the incremental stress test. However, the pri-mary objective of this study was to evaluate the reproducibility of HRVT and r-MSSD analysis immediately after a submaximal stress test and not the validity of these tools, which has been tested in previous work4,11,13.
Another important observation is the wide variation in BMI in the sample studied, which divides the sample in normal weight and overweight men. However, while body fat can inluence the HRV analysis34, all volunteers adopted in the research are involved in aerobic and resistance training, which stimulates muscle hypertrophy and limits the use of BMI as an indicator of body fatness, particularly when BMI values are below 30 35. Additionally, physical activity appears to offset the negative effect of obesity on HRV34.
Conclusion
We concluded that HRVT, analyzed by visual inspection during an incremental submaximal treadmill stress test, and r-MSSD analysis during recovery are highly reproducible measures. Our results suggest that these indices might be useful tools for assessing the acute and chronic effects of exercise training on cardiac autonomic modulation and practical parameters for exercise prescription.
References
1. Cole CR, Blackstone EH, Pashkow FJ, Snader CE, Lauer MS.
Heart-rate recovery immediately after exercise as a predictor of mortality. N Engl J Med. 1999;341(18):1351-1357. doi: 10.1056/
NEJM199910283411804
2. Cole CR, Foody JM, Blackstone EH, Lauer MS. Heart rate
recovery after submaximal exercise testing as a predictor of mortality in a cardiovascularly healthy cohort. Ann. Intern. Med.
2000;132(7):552-555. doi: 200004040-00007
3. Karapetian GK, Engels HJ, Gretebeck KA, Gretebeck RJ. Effect of caffeine on LT, VT and HRVT. Int J Sports Med.
4. Karapetian GK, Engels HJ, Gretebeck RJ. Use of heart rate vari-ability to estimate LT and VT. Int J Sports Med.
2008;29(8):652-657. doi: 10.1055/s-2007-989423
5. Mourot L, Tordi N, Bouhaddi M, Teffaha D, Monpere C, Regnard J. Heart rate variability to assess ventilatory thresholds: reliable in cardiac disease? Eur J Prev Cardiol. 2012;19(6): 1272-1280.
doi: 10.1177/1741826711423115
6. Tulppo MP, Makikallio TH, Seppanen T, Laukkanen RT, Huikuri
HV. Vagal modulation of heart rate during exercise: effects of age and physical itness. Am. J. Physiol. 1998;274:H424-429. 7. Tulppo MP, Makikallio TH, Takala TE, Seppanen T, Huikuri HV.
Quantitative beat-to-beat analysis of heart rate dynamics during
exercise. Am. J. Physiol. 1996;271: H244-252.
8. White DW, Raven PB. Autonomic neural control of heart rate dur
-ing dynamic exercise: revisited. J. Physiol.
2014;592(12):2491-2500. doi: 10.1113/jphysiol.2014.271858
9. Goldberger JJ, Le FK, Lahiri M, Kannankeril PJ, Ng J, Kadish
AH. Assessment of parasympathetic reactivation after exercise.
Am J Physiol Heart Circ Physiol. 2006; 290(6): H2446-2452. doi:
10.1152/ajpheart.01118.2005
10. Imai K, Sato H, Hori M, Kusuoka H, Ozaki H, Yokoyama H, et al. Vagally mediated heart rate recovery after exercise is ac -celerated in athletes but blunted in patients with chronic heart failure.J Am Coll Cardiol. 1994;24(6): 1529-1535
11. Gomes CJ, Molina GE. Utilização da variabilidade da frequência
cardíaca para a identiicação do limiar anaeróbio. Uma revisão sistemática. Journal of Physical Education/UEM. 2014;25(4): 675-683. doi: 10.4025/reveducis.v25i4.22495
12. Sales MM, Campbell CS, Morais PK, Ernesto C, Soares-Caldeira LF, Russo P, et al. Noninvasive method to estimate anaerobic threshold in individuals with type 2 diabetes. Diabetol Metab
Syndr. 2011;3(1): 1. doi: 10.1186/1758-5996-3-1
13. Vasconcellos F, Seabra A, Montenegro R, Cunha F, Bouskela E, Farinatti P. Can heart rate variability be used to
esti-mate gas exchange threshold in obese adolescents? Am. J. Sports Med. 2015;36(8):654-660.doi: http://dx.doi. org/10.1055/s-0034-1398654
14. Buchheit M, Laursen PB, Ahmaidi S. Parasympathetic reactivation
after repeated sprint exercise. Am J Physiol Heart Circ Physiol.
2007;293(1):H133-141. doi: 10.1152/ajpheart.00062.2007
15. Mourot L, Bouhaddi M, Perrey S, Rouillon JD, Regnard J. Quantitative Poincare plot analysis of heart rate variability: effect of endurance training. Eur J Appl Physiol. 2004; 91(1): 79-87.
doi: 10.1007/s00421-003-0917-0
16. Plews DJ, Laursen PB, Stanley J, Kilding AE, Buchheit M. Training adaptation and heart rate variability in elite endurance athletes: opening the door to effective monitoring. Sports Med.
2013;43(9):773-781. doi: 10.1007/s40279-013-0071-8
17. Craig CL, Marshall AL, Sjostrom M, Bauman AE, Booth ML,
Ainsworth BE, et al. International physical activity question
-naire: 12-country reliability and validity. Med Sci Sports Exerc. 2003;35(8):1381-1395.doi: 10.1249/01.MSS.0000078924.61453. FB
18. Molina GE, Porto LG, Fontana KE, Junqueira LF Jr. Unaltered R-R interval variability and bradycardia in cyclists as compared with non-athletes. Clin Auton Res. 2013;23(3):141-148. doi:
10.1007/s10286-013-0196-8
19. Quintana DS, Heathers JA, Kemp AH. On the validity of using the Polar RS800 heart rate monitor for heart rate variability research. Eur J Appl Physiol. 2012; 112(12):4179-4180. doi: 10.1007/ s00421-012-2453-2
20. Wallen MB, Hasson D, Theorell T, Canlon B, Osika W. Possibilities and limitations of the Polar RS800 in measuring heart rate variability at rest. Eur J Appl Physiol. 2012;112(3):1153-1165.
doi: 10.1007/s00421-011-2079-9
21. Tanaka H, Monahan KD, Seals DR. Age-predicted maximal heart rate revisited. J Am Coll Cardiol. 2001;37(1):153-156. doi: S0735-1097(00)01054-8 [pii]
22. Peltola MA. Role of editing of R-R intervals in the analysis of
heart rate variability. Front Physiol. 2012;3:148-158. doi: 10.3389/
fphys.2012.00148
23. Candido N, Okuno NM, da Silva CC, Machado FA, Nakamura FY. Reliability of the Heart Rate Variability Threshold using
Visual Inspection and Dmax Methods. Int J Sports Med. 2015.
doi: 10.1055/s-0035-1554642
24. Al Haddad H, Mendez-Villanueva A, Bourdon PC, Buchheit M.
Effect of acute hypoxia on post-exercise parasympathetic reacti
-vation in healthy men. Front Physiol. 2012; 3: 289. doi: 10.3389/
fphys.2012.00289
25. Buchheit M, Al Haddad H, Laursen PB, Ahmaidi S. Effect of
body posture on postexercise parasympathetic reactivation
in men. Exp. Physiol. 2009; 94(7): 795-804. doi: 10.1113/
expphysiol.2009.048041
26. Dupuy O, Mekary S, Berryman N, Bherer L, Audiffren M, Bosquet
L. Reliability of heart rate measures used to assess post-exercise
parasympathetic reactivation. Clin Physiol Funct Imaging.
2012;32(4):296-304. doi: 10.1111/j.1475-097X.2012.01125.x
27. Seiler S, Haugen O, Kuffel E. Autonomic recovery after ex -ercise in trained athletes: intensity and duration effects. Med
Sci Sports Exerc. 2007; 39(8): 1366-1373. doi: 10.1249/
mss.0b013e318060f17d
28. Weir JP. Quantifying test-retest reliability using the intraclass
correlation coeficient and the SEM. JSCR. 2005;19(1): 231-240. doi: 10.1519/15184.1
29. Dourado VZ, Guerra RL. Reliability and validity of heart rate variability threshold assessment during an incremen-tal shuttle-walk test in middle-aged and older adults. Braz.
J. Med. Biol. Res. 2013;46(2):194-199. doi: http://dx.doi. org/10.1590/1414-431X20122376
30. Araújo JA, Tricot GK, Arsa G, Queiroz MG, Santos KM, Dias ARL,et al. Blood pressure and cardiac autonomic modulation
at rest, during exercise and recovery time in the young over
-weight. Motriz. 2016;22(1):27-34.doi: http://dx.doi.org/10.1590/
S1980-65742016000100004
31. Buchheit M, Millet GP, Parisy A, Pourchez S, Laursen PB,
Ahmaidi S. Supramaximal training and postexercise parasym -pathetic reactivation in adolescents. Med Sci Sports Exerc.
2008;40(2):362-371. doi: 10.1249/mss.0b013e31815aa2ee
32. Duarte A, Soares PP, Pescatello L, Farinatti P. Aerobic training improves vagal reactivation regardless of resting vagal control.
Med Sci Sports Exerc. 2015; 47(6): 1159-1167. doi: 10.1249/ MSS.0000000000000532
33. Nakamura FY, Aguiar CA, Fronchetti L, Aguiar AF, Lima JRP.
treinamento aeróbio de curto prazo. Motriz. 2005;11(1): 01-09.
doi: http://dx.doi.org/10.5016/291
34. Dietrich DF, Ackermann-Liebrich U, Schindler C, Barthelemy
JC, Brandli O, Gold DR, et al. Effect of physical activity on heart
rate variability in normal weight, overweight and obese subjects:
results from the SAPALDIA study. Eur J Appl Physiol. 2008;104
(3): 557-565. doi: 10.1007/s00421-008-0800-0
35. Okorodudu DO, Jumean MF, Montori VM, Romero-Corral A, Somers VK, Erwin PJ, Lopez-Jimenez F. Diagnostic performance
of body mass index to identify obesity as deined by body adipos -ity: a systematic review and meta-analysis. Int J Obes. 2010;34
(1): 791-799. doi: 10.1038/ijo.2010.5
Corresponding author
Carlos Janssen Gomes da Cruz
Department of Physical Education, UNIEURO University Center. Avenida das
Na-ções, Trecho 0, Conjunto 05, Brasília, Brasil.
Email: [email protected]
Manuscript received on June 27, 2016 Manuscript accepted on September 28, 2016