Faculdade de Medicina de Ribeirão Preto Campus
Ribeirão Preto
Institutional Sponsors
The Brazilian Journal of Medical and Biological Research is partially financed by
Braz J Med Biol Res, December 2009, Volume 42(12) 1230-1235
Treadmill exercise testing of asymptomatic men and women
without evidence of heart disease
W.A. Chalela, R.B. Fukushima, F. Araujo, A.C.P. Lima, P.J. Moffa and A.J. Mansur
ISSN 0100-879X
BIOMEDICAL SCIENCES
AND
CLINICAL INVESTIGATION
www.bjournal.com.br
www.bjournal.com.br
Treadmill exercise testing of asymptomatic
men and women without evidence of
heart disease
W.A. Chalela, R.B. Fukushima, F. Araujo, A.C.P. Lima, P.J. Moffa and A.J. Mansur
Instituto do Coração, Faculdade de Medicina, Universidade de São Paulo, São Paulo, SP, Brasil
Abstract
The aim of this study was to test the hypothesis of differences in performance including differences in ST-T wave changes between healthy men and women submitted to an exercise stress test. Two hundred (45.4%) men and 241 (54.6%) women (mean age: 38.7 ± 11.0 years) were submitted to an exercise stress test. Physiologic and electrocardiographic variables were compared by the Student t-test and the chi-square test. To test the hypothesis of differences in ST-segment changes, data were
ranked with functional models based on weighted least squares. To evaluate the influence of gender and age on the diagnosis of ST-segment abnormality, a logistic model was adjusted; P < 0.05 was considered to be significant. Rate-pressure product,
duration of exercise and estimated functional capacity were higher in men (P < 0.05). Sixteen (6.7%) women and 9 (4.5%)
men demonstrated ST-segment upslope ≥0.15 mV or downslope ≥0.10 mV; the difference was not statistically significant. Age increase of one year added 4% to the chance of upsloping of segment ST ≥0.15 mV or downsloping of segment ST ≥0.1 mV (P = 0.03; risk ratio = 1.040, 95% confidence interval (CI) = 1.002-1.080). Heart rate recovery was higher in women (P < 0.05). The chance of women showing an increase of systolic blood pressure ≤30 mmHg was 85% higher (P = 0.01; risk ratio = 1.85, 95%CI = 1.1-3.05). No significant difference in the frequency of ST-T wave changes was observed between men and women.
Other differences may be related to different physical conditioning.
Key words: ST-T wave changes; Exercise stress test; Asymptomatic; Women
Introduction
Correspondence: W.A. Chalela, Serviço de Eletrocardiologia, InCor, FM-USP, Av. Dr. Eneas C. Aguiar, 44, 05403-900 São Paulo, SP, Brasil. Fax: +55-11-3069-5328. E-mail: [email protected]
Received January 3, 2009. Accepted October 13, 2009. Available online November 6, 2009. Published December 4, 2009.
Physiologic and electrocardiographic variables of men and women submitted to exercise stress test are considered to differ (1-4). The poor predictive value of ischemic ST changes during exercise in women has been emphasized (1,4). For the interpretation of the tests in women it has been recommended to take into consideration a lower pre-test probability of disease in comparison to men (2,3) and a lower sensitivity of ST-segment changes for the diagnosis of myocardial ischemia (4).
Differences in sensitivity, specificity and diagnostic
value of ST-segment and T wave changes have been reported (4,5). Furthermore, in the recovery after exer-cise, heart rate (6-8) and blood pressure (9,10) differ-ences may also be present. These studies were performed in large series of patients and yielded relevant information.
Nevertheless, we did not find recent studies comparing the
exercise stress test of asymptomatic men and women without any evidence of heart disease after clinical examination.
We performed this study to evaluate variables of the exercise stress test in asymptomatic men and women without any evidence of heart disease after careful clinical and laboratory examination to test the hypothesis of dif-ferences in response between men and women. We were
specifically interested in the comparison of ST-segment
alterations between men and women.
Material and Methods
Study protocol
Exercise testing in subjects with no evidence of heart disease 1231
www.bjournal.com.br Braz J Med Biol Res 42(12) 2009
normal clinical examination, as well as normal electrocar-diogram and chest X-ray, were eligible and were invited to participate in the study. After informed written consent, participants volunteered and were submitted to further laboratory work-up including electrocardiographic exercise stress test, echocardiography, hemoglobin, hematocrit, leukocyte count, serum glucose, cholesterol, triglycerides,
thyroid-stimulating hormone (TSH), and creatinine.
Two-dimensional transthoracic echocardiography was performed according to a standard technique following published guidelines (11).
Inclusion criteria
Asymptomatic Brazilian men and women older than 18 years with a normal clinical examination, as well as normal electrocardiogram, chest X-ray, echocardiogram, and labo-ratory evaluation were included in the study.
Exclusion criteria
Individuals with symptoms of cardiovascular disease,
systemic hypertension, Trypanosoma cruzi infection
(Chagas’ disease microorganism), diabetes mellitus, TSH
<0.05 or >8 mg/dL, chronic obstructive pulmonary disease,
asthma, renal failure, chronic inflammatory diseases, os -teoarticular diseases, chronic anemia, neoplasia, and an abnormal electrocardiogram or chest X-ray were excluded from the study.
Study sample
A total of 441individuals were studied, 200 (45.4%) men and 241 (54.6%) women, mean age 38.7 ± 11.0 years (range 18-74 years; Table 1). Seventy-eight participants were smokers, 37 of them (8.9%) men and 41 (10%) women. The baseline characteristics of the study sample are presented in Table 2.
Treadmill electrocardiographic exercise stress test. The test was performed on the Fukuda Denshi ML-8000 Star model (Japan) according to the Ellestad exercise protocol (12). Predicted peak heart rate was calculated as 220 - age. Individuals were encouraged to exercise until they experienced limiting symptoms, even if 85% of maximum
predicted heart rate was achieved. During each exercise stage and recovery stage, symptoms, blood pressure, and heart rate were recorded. The criteria for interruption of the exercise were physical exhaustion or exceeded maximum heart rate predicted for the patient’s age. Following peak exercise, individuals walked for a 3-min cool-down period at 1.5 mph without inclination. The ST-segment was measured 0.08 s after the J point in 3 consecutive QRS complexes
with a flat baseline and R wave of equal amplitude. The amplitude of the R wave was measured in II, V2 and V5
leads and the Q wave in V5 lead. Peak exercise capacity
was estimated from treadmill time and reported as metabolic
equivalents. Heart rate recovery was also measured and defined as maximum heart rate minus heart rate at 1 and
2 min after exercise with the subjects walking. To diagnose a normal treadmill electrocardiographic exercise stress test we followed previously published guidelines (13). Two physicians evaluated the electrocardiographic recordings of all tests independently in a blind fashion; disagreement was resolved by consensus.
Studied variables
The following variables were studied: a) demographic, clinical and laboratory variables: age, gender, smoking, body mass index, hemoglobin, serum glucose, total
cho-lesterol, HDL chocho-lesterol, LDL chocho-lesterol, triglycerides,
left ventricle myocardial mass index, and left ventricular ejection fraction on echocardiography (11); b) variables of the treadmill exercise stress test - we studied heart rate, maximal ST-segment depression, R wave amplitude and Q wave amplitude, systolic and diastolic blood pressure, rate-pressure product (heart rate x systolic blood pressure), duration of exercise, and estimated exercise capacity (metabolic equivalents).
Statistical analysis
After descriptive statistics, continuous variables relative
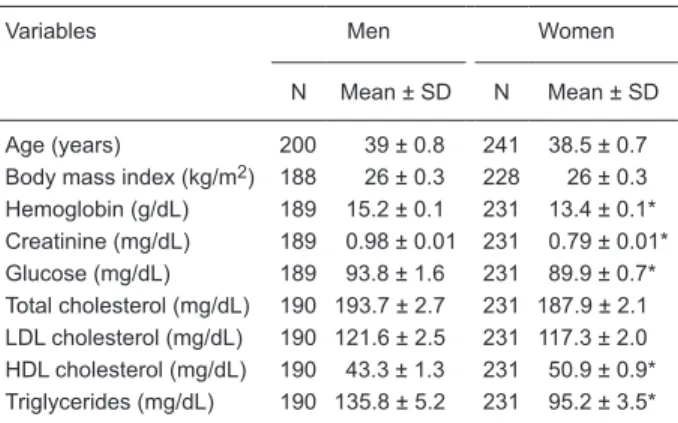
Table 2. Demographic, clinical and laboratory characteristics of the men and women of the study sample.
Variables Men Women
N Mean ± SD N Mean ± SD
Age (years) 200 39 ± 0.8 241 38.5 ± 0.7 Body mass index (kg/m2) 188 26 ± 0.3 228 26 ± 0.3 Hemoglobin (g/dL) 189 15.2 ± 0.1 231 13.4 ± 0.1* Creatinine (mg/dL) 189 0.98 ± 0.01 231 0.79 ± 0.01* Glucose (mg/dL) 189 93.8 ± 1.6 231 89.9 ± 0.7* Total cholesterol (mg/dL) 190 193.7 ± 2.7 231 187.9 ± 2.1 LDL cholesterol (mg/dL) 190 121.6 ± 2.5 231 117.3 ± 2.0 HDL cholesterol (mg/dL) 190 43.3 ± 1.3 231 50.9 ± 0.9* Triglycerides (mg/dL) 190 135.8 ± 5.2 231 95.2 ± 3.5*
*P < 0.05 compared to men (Student t-test).
Table 1. Age distribution of the men and women of the study sample.
Age (years) Men Women Total
18 |- 29 46 (23%) 51 (21.2%) 97 (21.9%) 30 |- 39 54 (27%) 74 (30.7%) 128 (29.1%) 40 |- 49 72 (36%) 79 (32.8%) 151 (34.2%) 50 |- 59 22 (11%) 31 (12.8%) 53 (12.1%)
≥60 6 (3%) 6 (2.5%) 12 (2.7%)
Total 200 241 441
to gender were compared with the Student t-test and cat-egorical variables relative to gender were compared using the chi-square test. To test the hypothesis of a sex-related
difference regarding ST-segment in leads II, V2 and V5, data
were ranked with functional models based on weighted least squares and submitted to categorical data analysis using the SAS System (14) and categorical data analysis (15).
A logistic model was adjusted to evaluate the influence of
gender and age on the diagnosis of ST-segment abnormality.
A P value <0.05 was considered to be significant.
Ethics
The study was approved by the Ethics Committee of
Human Research of the Hospital and all participants gave
written informed consent.
Results
Baseline clinical characteristics of the study sample
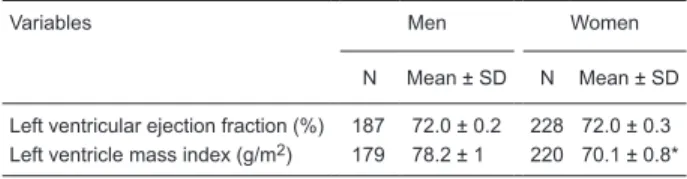
Serum HDL cholesterol was higher in women. Hemo -globin, serum creatinine, triglycerides, glucose, and left ventricle mass index on echocardiography were higher in
men. Other baseline clinical characteristics studied did not
reveal statistically significant differences between men and
women (Tables 2 and 3).
Treadmill electrocardiographic exercise stress test
a) Heart rate: 222 (92.1%) women and 186 (93%) men reached 85% of age-predicted peak exercise heart rate.
Heart rate recovery in the 1st and 2nd min after exercise was faster in women (Table 4). A non-significant trend for
a decrease in the heart rate recovery with increasing age for men and women was apparent (Figure 1).
Nine (3.7%) women and 13 (6.5%) men demonstrated heart rate recovery in the 1st min of recovery <12 bpm. An age increase of one year was associated with a 6% increase in risk of heart rate recovery <12 bpm in the 1st
min of recovery (P = 0.005; risk ratio = 1.06; 95% confi -dence interval (CI) = 1.02-1.1). At the 2nd min of recovery, two (1%) women and four (2%) men demonstrated heart
rate recovery <22 bpm. There was no influence of age or
gender on the 2nd min of heart rate recovery.
b) ST-segment: Upslope morphology of the ST-segment
and magnitude <0.1 mV were observed in 225 (93.3%)
women and in 191 (95.5%) men. Sixteen (6.7%) women
and 9 (4.5%) men demonstrated ST-segment upslope ≥0.15 mV or downslope ≥0.1 mV. This finding was more frequent in lead II (5.44%), followed by lead V5 (2.73%) and lead V2
(0.23%; II vs V2,P < 0.0001; II vs V5, P = 0.001; V2vs V5,
P = 0.02). An age increase of 1 year increased by 4% (P = 0.03; risk ratio = 1.040, 95%CI = 1.002-1.080) the chance
of upsloping of segment ST ≥0.15 mV or downsloping of segment ST ≥0.1 mV. The difference was not significant
relative to sex.
c) R and Q wave amplitude: There was a trend to a
Table 3. Echocardiogram characteristics of the men and women of the study sample.
Variables Men Women
N Mean ± SD N Mean ± SD Left ventricular ejection fraction (%) 187 72.0 ± 0.2 228 72.0 ± 0.3 Left ventricle mass index (g/m2) 179 78.2 ± 1 220 70.1 ± 0.8* *P < 0.05 compared to men (Student t-test).
Table 4. Treadmill electrocardiographic exercise stress test characteristics of the men and women of the study sample.
Variables Men Women
N Mean ± SD N Mean ± SD
Baseline heart rate (bpm) 200 77.9 ± 0.9 241 82.9 ± 0.8* Peak exercise heart rate (bpm) 200 171.5 ± 1 241 170.1 ± 0.9
Heart raterecovery 1st min (bpm) 155 143.5 ± 1.1 207 139.2 ± 1.3*
Heart raterecovery 2nd min (bpm) 180 123.2 ± 1.1 216 117.2 ± 1.2* Baseline systolic blood pressure(mmHg) 200 124.5 ± 0.7 241 119.5 ± 0.7*
Peak exercise systolic blood pressure (mmHg) 200 181.0 ± 1.6 241 166.8 ± 1.7*
Baseline diastolic blood pressure (mmHg) 200 78.7 ± 0.6 241 77.1 ± 0.6
Peak exercise diastolic blood pressure (mmHg) 200 84.2 ± 0.9 241 81.5 ± 0.8*
Rate-pressure product (bpm x mmHg) 200 31023.6 ± 321.7 241 28378.7 ± 313.1* Exercise duration (min) 200 8.4 ± 0.1 241 6.9 ± 0.1* Exercise capacity (MET) 188 12.7 ± 0.2 228 10.4 ± 0.2*
Exercise testing in subjects with no evidence of heart disease 1233
www.bjournal.com.br Braz J Med Biol Res 42(12) 2009
decrease in R wave amplitude and to an increase in Q wave at peak exercise relative to baseline values for both genders.
The decrease in R wave amplitude at peak of exercise
in leads V2 and V5, the sum of R wave’s amplitude in leads
II, V2 and V5 were higher in men (Table 5).
The normal decrease in R wave amplitude at peak
ex-ercise was more apparent with the sum of leads II, V2 and
V5 (observed in 342 participants) than R wave amplitude
measured in the V5 lead (observed in 283 participants).
Among 8 patients with ST-segment downsloping in lead
V5, three patients demonstrated a diminished Q wave in
lead V5 at peak exercise.
d) Blood pressure: Baseline mean systolic blood pres-sure, peak exercise systolic and diastolic blood pressure and differences between peak exercise and baseline systolic blood pressure were higher in men (Tables 4 and 5).
An increase of systolic blood pressure ≤30 mmHg was
observed in 56 (23.2%) women and 28 (14%) men. The chance of women to show an increase of systolic blood
pressure ≤30 mmHg was 85% higher than men (P = 0.01;
risk ratio = 1.85, 95%CI = 1.1-3.05).
e) Rate-pressure product: The rate-pressure product was higher in men (Table 4). A rate-pressure product
<30.0 bpm·mmHg-1·(10-3)-1 was observed in 159 (65.9%)
women and in 81 (40.5%) men. The chance of a
rate-pressure product <30.0 bpm·mmHg-1·(10-3)-1 for women
was almost three times higher than for men (P = 0.001; risk ratio = 2.96, 95%CI = 2.0-4.39). For an age increase of 1 year, the chance of a rate-pressure product <30.0
bpm·mmHg-1·(10-3)-1 increased 3% (P = 0.002; risk ratio
= 1.03, 95%CI = 1.01-1.05).
f) Estimated exercise capacity: Exercise duration and estimated exercise capacity were higher in men (Table 4). A trend to a decrease in estimated exercise capacity with
increasing age was verified for men and women up to 59
years of age (Figure 2).
Discussion
We observed statistically significant differences be -tween healthy men and women after the beginning of the electrocardiographic exercise stress test for peak exercise systolic blood pressure and diastolic blood pressure, rate-pressure product, R wave amplitude, exercise duration, and estimated exercise capacity. During recovery after
exercise, differences were significant for heart rate re -covery in the 1st and 2nd min after exercise. In contrast,
we did not observe significant differences in the treadmill
electrocardiographic exercise stress test between men and women for ST-segment, for peak exercise heart rate or Q wave amplitude.
Heart rate recovery was faster in women and this differ
-ence persisted, though not statistically significant, from the 3rd to the 7th decade of age. This finding raises the question
of whether the mechanism of parasympathetic reactivation after exercise may be more pronounced in women. In a
previ-ous study, there was no significant correlation between heart
rate recovery and autonomic function evaluated by heart rate variability during the 1st and 2nd min after exercise.
Figure 1. Mean heart rate recovery in the 1st and 2nd min after exercise relative to age and gender. (Student t-test).
Figure 2. Mean of estimated exercise capacity in metabolic equivalents (METs) during treadmill exercise stress testing rela-tive to age and gender. (Student t-test).
Table 5. Differences between baseline and peak exercise in blood pressure, R wave amplitude and Q wave amplitude in men and women.
Variables Men (N = 200) Women (N = 241)
Systolic blood pressure (mmHg) 56.5 ± 1.6 47.3 ± 1.6*
Diastolic blood pressure (mmHg) 5.5 ± 0.8 4.4 ± 0.7
R wave in II (mm) -2.7 ± 0.2 -2.2 ± 0.2
R wave in V2 (mm) -1.4 ± 0.1 -0.8 ± 0.1*
R wave in V5 (mm) -2.1 ± 0.1 -1.3 ± 0.2*
R wave (II + V2 + V5) (mm) -6.2 ± 0.4 -4.3 ± 0.3*
Q wave in V5 (mm) 0.5 ± 0.0 0.4 ± 0.0
The SDNN, SDANN, SDNNi, rMSSD, and pNN50 indices
were correlated significantly with heart rate recovery only
at the 3rd and 4th min of recovery (16).
Fewer women (3.7%) than men (6.5%) showed a heart rate recovery after exercise below 12 bpm and the probability
of this finding increased with age. This was an interesting finding in the absence of any evidence of heart disease
since previous studies have rated 12 bpm as a marker of less favorable prognosis (6,17).
We observed an ST-segment upslope ≥0.15 mV or downslope ≥0.1 mV in 16 (6.7%) women and 9 (4.5%)
men, lower than the range of 14 to 67% of previously reported cases (12). This lower frequency may have been related to the criteria used for enrollment in the present study, namely asymptomatic subjects with normal clinic examination, baseline electrocardiogram, chest X-ray, and echocardiogram.
In the present series, ST-segment upslope ≥0.15 mV or downslope ≥0.1 mV was observed more frequently in
lead II. In patients with a normal resting electrocardiogram,
exercise-induced ST-segment depression confined to the inferior leads is of little value for the identification of coronary
disease (12,18).
We did not observe significant differences between
men and women in ST-segment during the treadmill elec-trocardiographic exercise stress test. This observation contrasts with the long held view in clinical practice that ST abnormalities may be more frequent in women than in men (4,12).
The normal decrease in R wave amplitude at peak
exercise was more apparent with the sum of leads II, V2
and V5 (observed in 342/441 participants, 76%) than the R
wave amplitude measure in V5 lead (observed in 283/441
participants, 64%). This finding suggests that R wave am
-plitude may be better analyzed in leads II, V2 and V5, and
not in a single lead. Other investigators have shown that R wave amplitude in the lateral precordial leads usually decreases more in healthy subjects than in patients and a
significant correlation with left ventricular function has been
demonstrated (12,19-22).
Most patients demonstrated an increase in Q wave amplitude at peak exercise, as shown in previous
stud-ies (23,24). However, among 8 patients with ST-segment downsloping in lead V5, three demonstrated a diminished
Q wave in lead V5 at peak exercise. This finding was unex
-pected in this setting; whether it means an abnormal result
remains to be established.
Baseline mean systolic blood pressure and peak ex-ercise systolic and diastolic blood pressure were higher in
men, as also observed by others (13,25,26). This finding
in women may be attributed to their smaller muscle mass, lower hemoglobin and blood volume, and smaller stroke volume compared with men.
It is noteworthy that an increase of systolic blood
pres-sure ≤30 mmHg was observed in 23.2% of women and
14% of men. The chance of women showing an increase
of systolic blood pressure ≤30 mmHg is 85% higher than in men. Thus, this finding may be detected in otherwise
healthy individuals, and may be ascribed to poor physical conditioning.
We observed influence of gender and age on the
rate-pressure product. The chance of a rate-rate-pressure product
<30 bpm·mmHg-1·(10-3)-1 for women was almost three times
higher than for men and, for an age increase of one year,
the chance of a rate-pressure product <30 bpm.mmHg-1.
(10-3)-1 increased by 3%. This was an expected finding
since the rate-pressure product depends on both systolic blood pressure and heart rate.
Functional capacity was higher in men than in women and tended to decrease with age for both genders, as also observed by others (27,28). Maximal aerobic capacity de-clines 8 to 10% per decade in sedentary men and women (27). In the present study, this decline was observed in the second, third, fourth, and sixth decade for men and in the
third and fifth decade for women, a trend similar to that
observed in other studies (27,28).
The present study has limitations. The sample was recruited from asymptomatic volunteers with normal clinical and laboratory examination and may not be representative of the whole population. Few individuals were older than 60 years of age and elderly subjects were under-represented. Additionally, further invasive diagnostic work-up was not recommended to the participants.
We were not able to demonstrate differences in the frequency of ST-segment changes in men and women sub-mitted to an electrocardiographic exercise stress test. Our
findings for this study sample do not support the previously
suggested contention of different frequencies of ST-T wave changes in men and women. Other differences observed between men and women were more subtle and may have been related to different physical conditioning.
References
1. Manca C, Dei Cas L, Albertini D, Baldi G, Visioli O. Different
prognostic value of exercise electrocardiogram in men and women. Cardiology 1978; 63: 312-319.
2. Alexander KP, Shaw LJ, Shaw LK, DeLong ER, Mark DB,
Peterson ED. Value of exercise treadmill testing in women.
J Am Coll Cardiol 1998; 32: 1657-1664.
Exercise testing in subjects with no evidence of heart disease 1235
www.bjournal.com.br Braz J Med Biol Res 42(12) 2009
Ann Intern Med 2007; 147: 821-828.
4. Gibbons RJ, Balady GJ, Beasley JW, Bricker JT, Duvernoy
WF, Froelicher VF, et al. ACC/AHA Guidelines for Exercise
Testing. A report of the American College of Cardiology/
American Heart Association Task Force on Practice Guide -lines (Committee on Exercise Testing). J Am Coll Cardiol 1997; 30: 260-311.
5. Hlatky MA, Pryor DB, Harrell FE Jr, Califf RM, Mark DB, Rosati RA. Factors affecting sensitivity and specificity of
exercise electrocardiography. Multivariable analysis. Am J Med 1984; 77: 64-71.
6. Cole CR, Blackstone EH, Pashkow FJ, Snader CE, Lauer MS. Heart-rate recovery immediately after exercise as a
predictor of mortality. N Engl J Med 1999; 341: 1351-1357.
7. Cole CR, Foody JM, Blackstone EH, Lauer MS. Heart rate
recovery after submaximal exercise testing as a predictor of mortality in a cardiovascularly healthy cohort. Ann Intern Med 2000; 132: 552-555.
8. Shetler K, Marcus R, Froelicher VF, Vora S, Kalisetti D, Prakash M, et al. Heart rate recovery: validation and meth -odologic issues. J Am Coll Cardiol 2001; 38: 1980-1987. 9. Singh JP, Larson MG, Manolio TA, O’Donnell CJ, Lauer M,
Evans JC, et al. Blood pressure response during treadmill testing as a risk factor for new-onset hypertension. The Framingham heart study. Circulation 1999; 99: 1831-1836. 10. Kurl S, Laukkanen JA, Rauramaa R, Lakka TA, Sivenius J,
Salonen JT. Systolic blood pressure response to exercise stress test and risk of stroke. Stroke 2001; 32: 2036-2041. 11. Lang RM, Bierig M, Devereux RB, Flachskampf FA, Foster
E, Pellikka PA, et al. Recommendations for chamber
quan-tification: a report from the American Society of Echocar -diography’s Guidelines and Standards Committee and the
Chamber Quantification Writing Group, developed in con -junction with the European Association of Echocardiography, a branch of the European Society of Cardiology. J Am Soc Echocardiogr 2005; 18: 1440-1463.
12. Ellestad MH, Davis FA. Stress testing: Principles and prac-tice. 5th edn. New York: Oxford University Press; 2003.
13. Andrade J, Brito FS, Vilas-Boas F, Castro I, Oliveira JÁ,
Guimarães JI, et al. Exercise testing guidelines of Brazilian Society of Cardiology. Arq Bras Cardiol 2002; 78 (Suppl I): 1-18.
14. Stokes ME. Categorical data analysis using the SAS system. 1st edn. Cary: SAS Institute, Inc.; 1995.
15. Agrest A. Categorical data analysis. 2nd edn. New Jersey: John Wiley & Sons; 2002.
16. Antelmi I, Chuang EY, Grupi CJ, Latorre MR, Mansur AJ.
Heart rate recovery after treadmill electrocardiographic ex
-ercise stress test and 24-hour heart rate variability in healthy individuals. Arq Bras Cardiol 2008; 90: 380-385.
17. Nishime EO, Cole CR, Blackstone EH, Pashkow FJ, Lauer MS. Heart rate recovery and treadmill exercise score as
predictors of mortality in patients referred for exercise ECG. JAMA 2000; 284: 1392-1398.
18. Miranda CP, Liu J, Kadar A, Janosi A, Froning J, Lehmann KG, et al. Usefulness of exercise-induced ST-segment depression in the inferior leads during exercise testing as a marker for coronary artery disease. Am J Cardiol 1992; 69: 303-307.
19. Bonoris PE, Greenberg PS, Christison GW, Castellanet
MJ, Ellestad MH. Evaluation of R wave amplitude changes
versus ST-segment depression in stress testing. Circulation 1978; 57: 904-910.
20. Degre S, Longo B, Thirion M, Stoupel E, Sobolski J, Berkenboom G, et al. Analysis of exercise-induced R-wave-amplitude changes in detection of coronary artery disease in patients with typical or atypical chest pain under digitalis treatment. Cardiology 1981; 68 (Suppl 2): 178-185.
21. Greenberg PS, Ellestad MH, Berge R, Johnson K, Hayes M,
Bible M, et al. Radionuclide angiographic correlation of the R wave, ejection fraction, and volume responses to upright bicycle exercise. Chest 1981; 80: 459-464.
22. Fox K, Selwyn A, Shillingford J. Precordial electrocardio-graphic mapping after exercise in the diagnosis of coronary artery disease. Am J Cardiol 1979; 43: 541-546.
23. Morales-Ballejo H, Greenberg PS, Ellestad MH, Bible M.
Septal Q wave in exercise testing: angiographic correlation. Am J Cardiol 1981; 48: 247-251.
24. O’Hara MJ, Subramanian VB, Davies AB, Raftery EB.
Changes of Q wave amplitude during exercise for the prediction of coronary artery disease. Int J Cardiol 1984; 6: 35-45.
25. Michelsen S, Otterstad JE. Blood pressure response during maximal exercise in apparently healthy men and women. J Intern Med 1990; 227: 157-163.
26. Daida H, Allison TG, Squires RW, Miller TD, Gau GT. Peak exercise blood pressure stratified by age and gender in
apparently healthy subjects. Mayo Clin Proc 1996; 71: 445-452.
27. Fletcher GF, Balady GJ, Amsterdam EA, Chaitman B, Eckel R, Fleg J, et al. Exercise standards for testing and training: a statement for healthcare professionals from the American
Heart Association. Circulation 2001; 104: 1694-1740.
28. Kligfield P, Lauer MS. Exercise electrocardiogram testing: