Received from the CET Instituto Penido Burnier and Centro Médico de Campinas (CMC), Departamento de Anestesiologia da Faculdade de Medicina de Botucatu da Universidade Estadual Paulista (UNESP), Brazil.
1. Master’s Degree in Anesthesiology from Faculdade de Medicina de Botucatu (UNESP); Co-responsible for the CET Instituto Penido Burnier; CMC
2. Co-responsible for the CET Instituto Penido Burnier; CMC 3. Anesthesiologist of Hospital Santa Sofia Ltda. and Fundação CMC
4. Clinical Director of Fundação Centro Médico de Campinas; Co-responsible for the CET Instituto Penido Burnier; CMC
5. R3 of Instituto Penido Burnier; CMC
6. Post-Doctorate at the Departamento de Anestesiologia da Universidade de Bristol; Pro-fessor of Departamento de Anestesiologia of Faculdade de Medicina de Botucatu da UN-ESP, Júlio de Mesquita Filho
Submitted on November 28, 2010. Approved on January 04, 2011.
Correspondence to: Dr. Ricardo Francisco Simoni Rua Alzira de Aguiar Aranha, 552 13084768 – Campinas, SP, Brazil E-mail: [email protected]
SCIENTIFIC ARTICLE
Clinical Evaluation of Two Ke0 in the same Pharmacokinetic
Propofol Model: Study on Loss and Recovery of
Consciousness
Ricardo Francisco Simoni, TSA
1, Luis Otávio Esteves, TSA
2, Luiz Eduardo de Paula Gomes Miziara, TEA
3,
Luiz Marciano Cangiani, TSA
4, Gustavo Groth Oliveira Alves
5, André Luz Pereira Romano
5,
Paula Úrica Hansen
5, Pedro Thadeu Galvão Vianna, TSA
6Summary: Simoni RF, Esteves LO, Miziara LEPG, Cangiani LM, Alves GGO, Romano ALP, Hansen PU, Vianna PTG – Clinical Evaluation of Two Ke0 in the same Pharmacokinetic Propofol Model: Study on Loss and Recovery of Consciousness.
Background and objective: The constant equilibrium between the plasma and effect site (ke0) is used by pharmacokinetic models to calculate a drug concentration in its site of action (Ce). It would be interesting if Ce of propofol was similar at loss and recovery of consciousness. The ob-jective of this study was to evaluate the clinical performance of two different ke0 (fast = 1.21 min-1, and slow = 0.26 min-1) in relation to Ce during loss and recovery of consciousness using Marsh pharmacokinetic model.
Methods: Twenty healthy adult male volunteers participated in this study. In all volunteers propofol was administered as target-controlled infusion, Marsh pharmacokinetic model for fast ke0 and, at a different time, the same pharmacokinetic model with slow ke0 was used. Initially, propofol was infused with a serum target-controlled infusion of 3.0 µg.mL-1. Loss of consciousness and recovery of consciousness were based on response to verbal stimulus. Ce was recorded at the moment of loss and recovery of consciousness.
Results: On loss and recovery of consciousness, the Ce for fast ke0 was different (3.64 ± 0.78 and 1.47 ± 0.29 µg.mL-1, respectively, p < 0.0001), while with slow ke0 the Ce was similar (2.20 ± 0.70 and 2.14 ± 0.43 µg.mL-1, respectively, p = 0.5425).
Conclusions: Clinically, the slow ke0 (0.26 min-1) incorporated in the Marsh pharmacokinetic model showed better performance than the fast ke0 (1.21 min-1), since the calculated concentration of propofol at the effect site on loss and recovery of consciousness was similar.
Keywords: Pharmacokinetics; Propofol, administration and dosage; Intraoperative Awareness; Drug Delivery Systems.
[Rev Bras Anestesiol 2011;61(4): 397-408] ©Elsevier Editora Ltda.
INTRODUCTION
The target-controlled system for propofol was developed by Kenny et al. 1, but its commercial use started only in 1997 2.
This system uses Marsh pharmacokinetic model, published on the same decade 3.
The first generation of these systems only showed on its screen the target-dose and estimated plasma concentration
(Cp). A delay in the relationship between Cp and clinical effect became evident. Several authors measured different plasma concentrations of propofol at the moment of loss and recovery of consciousness, with a wide variation between minimal and maximal values (0.8 to 5.4 µg.mL-1) 4-11. This is basically
cau-sed by a delay in the balance between Cp and concentration of drug at its site of action located inside the central nervous system known as effect site 6.
The equilibrium rate between plasma and effect site de-pends on several factors such as cardiac output, cerebral blood flow, and pharmacologic properties that determine the transference rate through the blood brain barrier (liposolubility and degree of ionization). The time of equilibrium between plasma concentration and effect site can be mathematically described as a first order constant, known as ke0.
occur will be less.Thus, drugs with short T½ke0 have elevated
ke0 and fast onset of action.
The value of ke0 is integrated in the target-controlled in-fusion allowing the insertion on the screen of the target-con-trolled infusion the estimated concentration of propofol in its effect site (Ce).
It has been recommended that the pharmacokinetic model with its pharmacodynamic equivalent that contains the values of ke0 should be validated in studies with continuous infusion and in patient populations in which the models are being tes-ted 12. All values of ke0 proposed are correct for the method
used; however, they have little validation in clinical studies. Currently, four target-controlled systems are commercia-lized in Brazil. The values of ke0 for propofol incorporated in these systems (Marsh model) can be 0.26 min-1 (slow ke0) or
1.21 min-1 (fast ke0).
An interesting way to assess these ke0 values proposed for propofol would be to observe the Ce at the moment of loss and recovery of consciousness. Although there is evidence that the concentration of propofol in its site of action (cen-tral nervous system – GABA receptor) is similar at the time of loss and recovery of consciousness, clinically this would allow an interesting individualized titration of the target dose of propofol reducing the possibility of intraoperative awake-ning episodes.
Recently, a study demonstrating a direct relationship be-tween Ce on loss and recovery of consciousness with ke0 of 0.26 min-1 (slow ke0; T
1/2ke0 = 2.60 min) was published 13.
However, there is little information in literature on the clinical performance of 1.21 min-1 ke0 (fast ke0; T
1/2ke0 = 0.57 min).
The objective of the present study was to evaluate the clini-cal performance of two different ke0 (slow and fast) regarding the Ce of propofol during loss and recovery of consciousness using Marsh pharmacokinetic model 3. The hypothesis tested
was that the calculated Ce of propofol is similar for slow ke0 on loss and recovery of consciousness, which differ from that of fast ke0.
METHODS
After approval by the Research Ethics Committee and signing of informed consent, 20 healthy adult male volunteers partici-pated in this study. The sample size was based on a previous pilot study. Considering that the difference in proportionality between the calculated concentration of propofol at the site of action (Ce) with slow and fast ke0 (0.26 min-1 and 1.21 min-1,
respectively) was 40% and the strength of analysis with an alpha error of 5% and beta error of 20%, it was demonstrated that 20 volunteers per group would be necessary.
Selected volunteers presented at a predetermined location after a 6-hour fasting period. All volunteers were monitored with electrocardiogram for heart rate (HR) (DII and V1 deri-vations), peripheral oxygen saturation (SpO2), non-invasive
mean arterial pressure (MAP), and bispectral index (BIS). Oxygen under nasal catheter, 2.0 L.min-1, was administered;
the left antecubital vein was punctured and connected to a
ve-nous catheter with propofol (Propovan® – Cristália Produtos
Químicos e Farmacêuticos Ltda.). Saline infusion to replace the fasting period or insensible losses was not used.
Propofol was administered as target-controlled infusion using Marsh pharmacokinetic model, slow ke0, and, at a lat-ter opportunity, using the same pharmacokinetic model with a fast ke0. An infusion pump (Anesthesia Pilot II® –
Fresenius-Kabi) coupled to the infusion management (ANESTFUSOR® –
University of Chile, Santiago) was used (Figure 1). The admi-nistration sequence of propofol was randomized and computer generated.
Initially, propofol was infused as a target-plasma concen-tration of 3 µg.mL-1, based on a previous study 13. The loss of
consciousness (LOC) was defined as loss of response to ver-bal stimulus (calling the volunteer by his name using a normal tone of voice). This verbal stimulus was repeated three times at 30-second interval by another investigator who was unawa-re of the calculated concentration at the site of action (Ce).
If loss of consciousness did not occur after the equilibrium of Ce and Cp at 3.0 µg.mL-1, Cp was increased by 0.5 µg.mL-1,
and so forth, until the volunteer could not respond to the verbal stimulus. After loss of consciousness, target-controlled infu-sion was maintained for 15 minutes. After this period, Cp was decreased to zero until recovery of consciousness (ROC) was observed, defined as response to a verbal stimulus (calling the volunteer by his name using a normal tone). This stimulus was repeated three times at 30-second intervals by another investigator who was unaware of the calculated Ce. This me-thodology was similar to that of a prior study 13.
The calculated concentration at the site of action and BIS were recorded whenever the volunteer lost and recovered his consciousness. The maximum and minimum BIS during infu-sion and the dose of propofol were also recorded.
Paired Student t test was used in the statistical analysis of parametric parameters and results were expressed as mean and standard deviation. Non-parametric parameters were analyzed by Wilcoxon test for paired samples and the results
expressed as median. A p lower than 0.05 was considered statistically significant.
RESULTS
The age, weight, height, and mean body mass index of volun-teers are presented in Table I. The mean Ce calculated for the fast ke0 on loss and recovery of consciousness was different (3.64 ± 0.78 and 1.47 ± 0.29 µg.mL-1, p < 0.0001), while with
slow ke0 the calculated mean Ce was similar (2.20 ± 0.70 and 2.13 ± 0.43 µg.mL-1, respectively, p = 0.5425) (Figures 2 and 3).
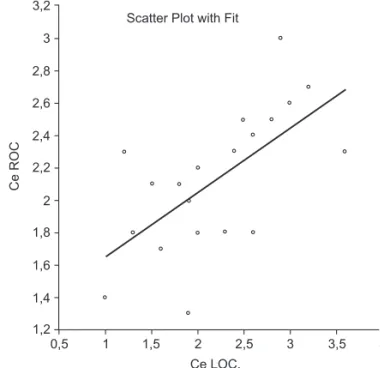
A correlation between the calculated concentration of pro-pofol in its site of action on loss and recovery of conscious-ness with slow and fast ke0 (p = 0.0249 and p = 0.0023, res-pectively) was observed (Figures 4 and 5).
Table I – Demographic Data and Body Mass Index
Age (years) 30 (25-41) Weight (kg) 82 (74-97) Height (cm) 177 (170-184) BMI (kg.m-2) 26 (23-31)
Results expressed as mean (minimum and maximum).
6
5
4
3
2
1
*
*
Fast ke0 Predicted Ce
LOC = loss of consciousness ROC = recovery of consciousness * p < 0,0001
LOC ROC
3,5
3,0
2,5
2,0
1,5
1,0
Slow ke0 Predicted Ce
LOC = loss of consciousness ROC = recovery of consciousness p = 0,5425
LOC ROC
Scatter Plot with Fit
1,8
Ce ROC
Ce LOC 1
1,2 1,4 1,6 2
2 3 4 5
Scatter Plot with Fit
Ce ROC
Ce LOC. 3,2
3
2,8
2,6
2,4
2,2
2
1,8
1,6
1,4
1,2
0,5 1 1,5 2 2,5 3 3,5 4
Figure 2 – Ce on Loss and Return of Consciousness with Fast ke0. Ce: calculatedpropofol concentration at the site of action.
Figure 3 – Ce at Loss and Return of Consciousness with Slow ke0. Ce: predictedconcentration of propofol at the site of action.
Figure 4 – Linear Regression between the Ce of Propofol at LOC and ROC with Fast ke0.
Ce: calculated concentration at the site of action; LOC: loss of consciousness; ROC: recovery of consciousness. Statistically sig-nificant correlation (R2 = 0.25, p = 0.0249) and positive inclination (p = 0.0249).
Figure 5 –Linear Regression between Ce of Propofol at LOC and ROC with Slow ke0.
Ce: calculated concentration at the site of action; LOC: loss of consciousness; ROC: recovery of consciousness. Statistically sig-nificant correlation (R2 = 0.41, p = 0.0023) and positive inclination (p = 0.0023).
m
g.mL
–1
m
g.mL
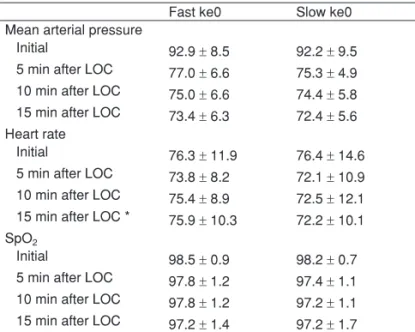
The variation in MAP, HR, and SpO2 at the initial period
and at 5, 10, and 15 minutes after loss of consciousness, and the initial BIS on loss and recovery of consciousness with the minimum and maximum values during infusion, can be seen in Tables II and III.
Time until loss and recovery of consciousness, dose of pro-pofol used, time of propro-pofol infusion, and mean target-plasma dose achieved with fast and slow ke0 are in Table IV.
Significant respiratory depression (SP < 92%) or any other adverse event was not observed during the study. The use of Guedel airway or any other instrument to maintain patent airways was not necessary.
DISCUSSION
The objective of the preset study was to evaluate the per-formance of two equilibrium constants (ke0 = 1.21 min-1 and
ke0 = 0.26 min-1) incorporated in the Marsh pharmacokinetic
model in relation to the Ce of propofol on loss and recovery of consciousness, assessed by the response to a predefined auditory stimulus.
The first study to determine the ke0 was published by Shei-ner et al. 14 in 1979 using a neuromuscular blocker
(d-tubocu-rarine) where it is possible to objectively evaluate its effects. However, to date there is no direct method to estimate the concentration of intravenous anesthetics at the site of action. But the value of ke0 can be estimated by indirect methods, non-parametrically (based on blood samples), or parametri-cally (based on plasma concentration calculated by a pharma-cokinetic model).
There is no consensus in literature on the ideal method to obtain the value of ke0 for propofol. Thus, as a consequen-ce of the current methodology 15-20, there is a large variability
among proposed values (between 0.20 and 1.21 min-1). This
difference has a partial relationship with the infusion rate of propofol used. By using electroencephalogram, it has been demonstrated that the equilibrium of propofol in its site of ac-tion is faster after a bolus injecac-tion than with a continuous infu-sion 21. However, with rates up to 60 mg.min-1 a difference in
the value of ke0 was not observed 22.
The use of a single infusion pump attached to the infusion management program (ANESTFUSOR), in which the ke0 in the same Marsh model varies, eliminated the bias of using two infusion systems with different accuracies.
When the Ce of propofol was correlated with the degree of sedation (OAAS) using BIS values, a better performance was observed with the original Marsh model (ke0 = 0.26 min-1)
when compared to the Schnider model (ke0 = 0.45 min-1) 23,
since while the concentration of propofol on its site of action calculated by the Marsh model increased, the degree of se-dation also increased and BIS decreased proportionally. The inverse relationship was also observed.
The results of the present study indicate that by the method used the slow ke0 (0.26 min-1) had a better performance, since
the Ce of propofol at loss and recovery of consciousness was similar (2.20 and 2.13 µg.mL-1, respectively). This result was
similar to that of other authors who used the same method 13,
although there is no evidence that this is actually occurring within the central nervous system.
Despite the great difference observed between the Ce at loss and recovery of consciousness (3.64 and 1.47 µg.mL-1,
respectively) with the fast ke0 there was a positive correla-tion. This correlation was also observed in another study that evaluated the loss and recovery of consciousness according
Table II – Initial Hemodynamic Data and after Loss of Consciousness
Fast ke0 Slow ke0 Mean arterial pressure
Initial 92.9 ± 8.5 92.2 ± 9.5 5 min after LOC 77.0 ± 6.6 75.3 ± 4.9 10 min after LOC 75.0 ± 6.6 74.4 ± 5.8 15 min after LOC 73.4 ± 6.3 72.4 ± 5.6 Heart rate
Initial 76.3 ± 11.9 76.4 ± 14.6 5 min after LOC 73.8 ± 8.2 72.1 ± 10.9 10 min after LOC 75.4 ± 8.9 72.5 ± 12.1 15 min after LOC * 75.9 ± 10.3 72.2 ± 10.1 SpO2
Initial 98.5 ± 0.9 98.2 ± 0.7 5 min after LOC 97.8 ± 1.2 97.4 ± 1.1 10 min after LOC 97.8 ± 1.2 97.2 ± 1.1 15 min after LOC 97.2 ± 1.4 97.2 ± 1.7
Results are expressed as mean and standard deviation; LOC: loss of consciousness; SpO2: peripheral oxygen saturation; * p = 0,0084.
Table III –Bispectral Index
Fast ke0 Slow ke0
BIS
Initial 97 (97-98) 98 (97-98)
LOC 54 (42-70) ** 58 (46-72) +
Minimum* 31 (19-44) 36 (24-46) Maximum+ 58 (43-63) 61 (47-65)
ROC 65 (59-79) 66 (54-75)
Results are expressed as median (minimum and maximum); LOC: loss of consciousness; ROC: recovery of consciousness; *p = 0.0062; +p = 0.0263; **p = 0.0002 vs. ROC; +p < 0.0001 vs. ROC.
Table IV – Time of Loss and Recovery of Consciousness, Propofol Dose, Total Infusion Time, and Concentration of Propofol Achieved
Fast ke0 Slow ke0 Time LOC (min) 5.15 ± 1.73 7.40 ± 5.22* Time ROC (min) 8.35 ± 2.62 5.60 ± 1.76** Propofol
Dose (µg.kg-1.min-1) 233.85 ± 33.97 187.82 ± 6.17 ** Total infusion time (min) 20.15 ± 1.73 22.40 ± 5.22 *
Cp achieved (µg.mL-1) 3.8 ± 0.7 3.1 ± 0.2 **
to the same criteria 24. Other authors have alerted about the
non-linearity found between the Ce of propofol by fast ke0 and anesthesia induction, highlighting a greater reliability of slow ke0 as a titration guide 25.
Slow ke0 (0.26 min-1) was first used on first generation IAC
systems to estimate the effective concentration, which was always associated with the Marsh model. This value was ex-tracted by using auditory evoked potentials (AEPex), but the details of this method are unknown, since this study was publi-shed only as a summary 15. This value of ke0 is very similar to
the 0.20 min-1 proposed by other authors 16,20.
The fast ke0 (1.21 min-1) was suggested later by Struys
et al. 19, using the time to peak effect (TTPE) and BIS. After a
bolus dose, the maximum clinical effect will occur when con-centration on the site of action reaches its maximal level. Time to peak effect is defined as the time interval between the end of the bolus injection and peak clinical effect. This time is not dependent on the size of bolus. Using a fast ke0 with the Mar-sh model, the TTPE was approximately 1.6 minutes, which is similar to the result reported by another study 17. Obtaining
a result outside the equilibrium phase of propofol represents a disadvantage of this method 26, making it difficult to observe
a single maximal effect in a real clinical situation due to several factors such as signal interference (BIS),.
The amount of propofol used was significantly greater with the fast ke0 than with slow ke0. This was translated into lower BIS values during infusion and consequently longer awake-ning time with fast ke0. This can be explained by the fact that when the ke0 of 1.21 min-1 was used, many volunteers did not
lose consciousness after the fast initial equilibrium of Ce and Cp at 3.0 µg.mL, which required a gradual increase in Cp until loss of consciousness. Therefore, with fast ke0, mean Cp du-ring the assay was greater than the Cp of volunteers with slow ke0 (3.8 and 3.1 µg.mL-1, respectively).
Despite the greater amount of propofol used with fast ke0, significant hemodynamic repercussions were not observed, as the mean reduction in MAP was no more than 20%, while the HR remained stable during the study. Similar values were obtained with slow ke0. In only one moment (15 minutes after loss of consciousness) the HR was significantly different be-tween groups.
Gender is an important variable in the pharmacokinetic of propofol 27. A study has demonstrated that female patients
re-cover faster after anesthesia with propofol, alfentanil, and ni-trous oxide 28. The calculated plasma concentration in females
tends to be overestimated 29. Recently, it has been
demonstra-ted that there is the need to correct the depuration and volume of the central compartment of propofol according to gender and age to improve the previsibility of the Marsh model 30. To
decrease bias, this study was conducted with the same gen-der (males) and within the same age range (young adults).
The better performance with slow ke0 might be partly explai-ned by the method used in the present study of evaluating loss and recovery of consciousness. Most likely, the proposed audi-tory stimulus had better correlation with the evoked audiaudi-tory po-tential (AEPex) than with BIS. Note that the AEPex was the tool used to extract the value of ke0 in the original Marsh model 15.
It has been demonstrated in literature that the auditory evoked potential index (AEP index), BIS, and entropy have a positive correlation with the Ce of propofol 31-34. They are all
able to assess the degree of sedation and separate the state of being awake from being anesthetized. However, studies have demonstrated that the AEP index and entropy are more accu-rate in distinguishing the transition from the individual condition of unconsciousness to the state of consciousness 31,34,35.
In the present study BIS values were statistically different at loss and recovery of consciousness in both ke0 investigated. This difference could be explained by a delay in processing the BIS signal, and the value seen on the screen refers to a previous moment. This delay can vary from 5 to 60 seconds according to the context and its changing tendencies36.
Howe-ver, intergroup results were similar (Table III).
Limiting factors of this study include the type of model used and the lack of measurements of the plasma concentration of propofol. The model with volunteers did not resemble a real surgical situation as the volunteers only received an auditory stimulus. It is known that the Ce of propofol necessary for loss of consciousness is greater in the presence of pain or surgical stimulation 32,37. Thus, this model simulates only procedures
with little nociceptive stimulus or in case of painful stimulus is blocked by regional anesthesia. The lack of measurement of plasma propofol concentration did not allow a more detailed interpretation of the results.
Recently, the task force of the American Society of Anes-thesiologists included total intravenous anesthesia as a risk factor for intraoperative awakening 38. Note that in the United
States the target-controlled infusion was not approved by the FDA for clinical use. As demonstrated in another study 13,
conducting total intravenous anesthesia with propofol based in populational means (Cp50 or Ce50) can predispose the pa-tient to intraoperative awakening and to retain memory of the procedure, since there is a wide pharmacodynamic variability. Even with slow ke0, which showed similar Ce of propofol at loss and recovery of consciousness, the variation of Ce at loss of consciousness was from 1.0 to 3.6 µg.mL-1, while with the
fast ke0, this variation ranged from 2.3 to 5.9 µg.mL-1. Note
that the present study was undertaken with a very homoge-nous group of volunteers.
In agreement with other authors 33, we suggest that to
re-duce the incidence of intraoperative awakening slow ke0 as-sociated with the Marsh model and titration of the maintenan-ce target dose based on the calculated dose-effect for loss of consciousness should be used. Most likely, this target dose will need small adjustments to correct the inherent mathema-tical error of the pharmacokinetic model, and in situations in which the nociceptive stimulus is not completely blocked.
Corroborating the initial hypothesis, we conclude that the slow ke0 (0.26 min-1) incorporated in the Marsh
pharmacody-namic model showed better clinical performance than the fast ke0 (1.21 min-1), as the calculated effect concentration at loss
REFERÊNCIAS / REFERENCES
01. Kenny GN, White M – Intravenous propofol anaesthesia using a com-puterised infusion system. Anaesthesia, 1991;46:156-157.
02. Glen JB – The development of “Diprifusor: a TCI system for propofol. Anaesthesia, 1998;53(Suppl):13-21.
03. Marsh B, White M, Morton N et al. – Pharmacokinetic model driven infusion of propofol in children. Br J Anaesth, 1991;67:41-48.
04. Vuyk J, Engbers FH, Lemmens HJ et al. – Phamacodynamics of propofol in female patients. Anesthesiology, 1992;77:3-9.
05. Smith C, McEwan AI, Jhaveri R et al. – The interaction of fentanyl on the Cp50 of propofol for loss os consciouness and skin incision. Anesthesiology, 1994;81:820-828.
06. Wakeling HG, Zimmerman JB, Howell S et al – Targeting effect compart-ment or central compartcompart-ment concentration of propofol: what predicts loss of consciousness? Anesthesiology, 1999;90:92-97.
07. Struys M, Versichelen L, Rolly G – Influence of pre-anaesthetic medi-cation on target propofol concentration using a “Diprifusor” TCI system during ambulatory surgery. Anaesthesia, 1998;53(Suppl 1):68-71. 08. Milne SE, Troy A, Irwin MG et al. – Relationship between bispectral index,
auditory evoked potential index and effect-site EC50 for propofol at two clinical end-points. Br J Anaesth, 2003;90:127-131.
09. Doufas AG, Bakhshandeh M, Bjorksten AR et al. – Autometed re-sponsiveness test (ART) predicts loss of consciousness and adverse physiologic responses during propofol conscious sedation. Anesthe-siology, 2001;94:585-592.
10. Chortkoff BS, Eger EII, Crankshaw DP et al. – Concentrations of desflurane and propofol that suppress response to command in humans Anesth Analg, 1995;81:737-743.
11. Wessen A, Persson PM, Nilsson A et al. – Concentration-effect rela-tionships of propofol after total intravenous anesthesia. Anesth Analg, 1993;77:1000-1007.
12. Nora FS – Anestesia venosa total em regime de infusão alvo-contro-lada: uma análise evolutiva. Rev Bras Anestesiol, 2008; 58:179-192. 13. Iwakiri H, Nishihara N, Nagata O et al. – Individual effect-site
con-centrations of propofol are similar at loss of consciousness and at awakening. Anesth Analg, 2005;100:107-110.
14. Sheiner LB, Stanski DR, Vozeh S et al. – Simultaneous modeling of pharmacokinetics and pharmacodynamics: application to d-tubocura-rine. Clin Pharmacol Ther, 1979;25:358-371.
15. Kenny GN – Ke0 of propofol evaluated with AEPex. Abstract World Congress Book, 1996.
16. Billard V, Gambus PL, Chamoun N et al. – A comparison of spectral edge, delta power, and bispectral index as EEG measures of alfenta-nil, propofol, and midazolam drug effect. Clin Pharm Ther, 1997;61:45-58.
17. Schnider TW, Minto CF, Gambus PL et al. – The influence of method of adminstration and covariates on the pharmacokinetics of propofol in adult volunteers. Anesthesiology, 1998;88:1170-1182.
18. Schnider TW, Minto CF, Shafer SL et al. – The influence of age on propofol pharmacodynamic. Anesthesiology, 1999;90:1502-1516. 19. Struys MM, De Smet T, Depoorter B et al. – Comparison of plasma
compartment versus two methods for effect compartment-controlled target-controlled infusion for propofol. Anesthesiology, 2000;92:399-406.
20. White M, Schenkels MJ, Engbers FHM et al. – Effect-site modelling of propofol using auditory evoked potentials. Br J Anaesth, 1999;82:333-339.
21. Struys MM, Coppens MJ, De Neve N et al. – Influence of administra-tion rate on propofol plasma-effect site equilibraadministra-tion Anesthesiology, 2007;107:386-396.
22. Doufas AG, Bakhshandeh M, Bjorksten AR et al. – Induction speed is not a determinant of propofol phamacodynamics. Anesthesiology, 2004;101:1112-1121.
23. Barakat AR, Sutcliffe N, Schwab M – Effect site concentration during propofol TCI sedation: a comparison of sedation score with two phar-macokinetic models. Anaesthesia, 2007;62:661-666.
24. Nunes CS, Ferreira DA, Antunes L et al. – Individual effect-site con-centrations of propofol at return of consciousness are related to the concentrations at loss of consciouness and age in neurosurgical pa-tients. J Clin Anesth, 2009;21:3-8.
25. Sepúlveda P, Nunez G, Recart A – Induction TCI a sitio efector de
propofol: evaluación clínica de dos diferentes ke0. Rev Argent Anest-Rev Argent
Anest-esiol, 2007;65:89-95.
26. Absalom AR, Mani V, De Smet T et al. – Pharmacokinetic models for propofol - defining and illuminating the devil in the detail. Br J Anesth, 2009;103:26-37.
27. Schuttler J, Ihmsen H – Population pharmacokinetics of propofol: a multicenter study. Anesthesiology, 2000;92:727-738.
29. Kodaka M, Suzuki T, Maeyama A et al. – Gender differences between pre-dicted and measured propofol Cp50 for loss of consciousness. J Clin Anes-th, 2006; 18:486-489.
30. White M, Kenny GNC, Schraag S – Use of target controlled infusion to derive age and gender covariates for propofol clearance. Clin Phar-macokinet, 2008;47:119-127.
31. Gajraj RJ, Doi M, Mantzaridis H et al. – Comparison of bispectral EEG analysis and auditory evoked potentials for monitoring depth of anaesthesia during propofol anaesthesia. Br J Anaesth, 1999;82:672-678.
32. Irwin MG, Hui TWC, Milne SE et al. – Propofol effective concentration 50 and its relationship to bispectral index. Anaesthesia, 2002;57:242-248. 33. Lysakowski C, Elia N, Czarnetzki C et al. – Bispectral and spectral
entropy indices at propofol-induced loss of consciousness in young and elderly patients. Br J Anaesth, 2009;103:387-393.
34. Iannuzzi M, Iannuzzi E, Rossi F et al. – Relationship between bispec-tral index, electroencephalografic state entropy and effect-site EC50 for propofol at different clinical endpoints. Br J Anaesth, 2005;94:613-616. 35. Schraag S, Bothner U, Gajraj RJ et al. – The performance of
electro-encephalogram bispectral index and auditory evoked potential index to predict loss of consciousness during propofol infusion. Anesth An-alg, 1999;89:1311-1315.
36. Pilge S, Zanner R, Schneider G et al. – Time delay of index calcu-lation: analisys of cerebral state, bispestral and narcotrend indices. Anesthesiology, 2006;104:488-494.
37. Iwakiri H, Nagata O, Matsukawa T et al. – Effect-site concentration of propofol for recovery of consciouness is virtually independent of fentanyl effect-site concentration. Anesth Analg, 2003;96:1651-1655.
38. American Society of Anesthesiologists Task Force on Intraoperative
Awareness - Practice advisory for intraoperative awareness and brain function monitoring. Anesthesiology, 2006;104:847-864.
Resumen: Simoni RF, Esteves LO, Miziara LEPG, Cangiani LM,
Alves GGO, Romano ALP, Hansen PU, Vianna PTG – Evaluación Clínica de Dos ke0 en el Mismo Modelo Farmacocinético de Propofol: Estudio de la Pérdida y de la Recuperación de la Conciencia.
Justificativa y objetivos: La constante de equilibrio entre el plasma
y el sitio efector (ke0), se usa por los modelos farmacocinéticos para prever la concentración del fármaco en su región de acción (Ce). Se-ría interesante que el Ce de propofol fuese similar en la pérdida y en la recuperación de la conciencia. El objetivo de este estudio, fue eva-luar el desempeño clínico de dos diferentes ke0 (rápida = 1,21 min-1 y lenta = 0,26 min-1), con relación a la Ce durante la pérdida y la recuperación de la conciencia, usando el modelo farmacocinético de Marsh.
Método: Participaron en este estudio, 20 voluntarios adultos sanos
del sexo masculino. A todos los voluntarios se les administró propo-fol en régimen de infusión objeto controlada, modelo farmacocinético de Marsh ke0 rápida y en otro momento, se usó el mismo modelo farmacocinético con a ke0 lenta. Inicialmente, el propofol se infundió en concentración-objeto plasmática de 3,0 µg.mL-1. La pérdida de la conciencia y la recuperación de la conciencia estuvieron basadas en la respuesta al estímulo verbal. La Ce fue anotada en el momento de la pérdida y de la recuperación de la conciencia.
Resultados: En la pérdida y en la recuperación de la conciencia, la
Ce por la ke0 rápida, fue diferente (3,64 ± 0,78 y 1,47 ± 0,29 µg.mL-1, respectivamente, p < 0,0001), mientras que con la ke0 lenta la Ce fue parecida (2,20 ± 0,70 y 2,13 ± 0,43 µg.mL-1, respectivamente, p = 0,5425).
Conclusiones: Desde el punto de vista clínico, la ke0 lenta
(0,26 min-1) incorporada al modelo farmacocinético de Marsh, pre-sentó un mejor desempeño que la ke0 rápida (1,21 min-1), pues la concentración de propofol prevista en su región de acción en la pér-dida y en la recuperación de la conciencia fue similar.
Descriptores: ANESTÉSICO, Venoso: propofol;