Radiol Bras. 2015 Set/Out;48(5):287–291 287
Sonographic diagnosis of carpal tunnel syndrome: a study
in 200 hospital workers
*
Diagnóstico ultrassonográfico da síndrome do túnel do carpo: um estudo em 200 trabalhadores hospitalares
Castro AA, Skare TL, Nassif PAN, Sakuma AK, Barros WH. Sonographic diagnosis of carpal tunnel syndrome: a study in 200 hospital workers. Radiol Bras. 2015 Set/Out;48(5):287–291.
Abstract
R e s u m o
Objective: To describe the prevalence of carpal tunnel syndrome in a sample of 200 healthy hospital workers, establishing the respective epidemiological associations.
Materials and Methods: Two hundred individuals were submitted to wrist ultrasonography to measure the median nerve area. They were questioned and examined for epidemiological data, body mass index, carpal tunnel syndrome signs and symptoms, and submitted to the Boston carpal tunnel questionnaire (BCTQ) to evaluate the carpal tunnel syndrome severity. A median nerve area ≥ 9 mm2 was considered to be diagnostic of carpal tunnel syndrome.
Results: Carpal tunnel syndrome was diagnosed by ultrasonography in 34% of the sample. It was observed the association of carpal tunnel syndrome with age (p < 0.0001), paresthesia (p < 0.0001), Tinel’s test (p < 0.0001), Phalen’s test (p < 0.0001), BCTQ score
(p < 0.0001), and years of formal education (p < 0.0001). Years of formal education was the only variable identified as an independent
risk factor for carpal tunnel syndrome (95% CI = 1.03 to 1.24).
Conclusion: The prevalence of carpal tunnel syndrome in a population of hospital workers was of 34%. The number of years of formal education was the only independent risk factor for carpal tunnel syndrome.
Keywords: Carpal tunnel syndrome; Ultrasonography; Median nerve area; Hand pain; Hand paresthesia.
Objetivo: Descrever a prevalência da síndrome do túnel do carpo em amostra de 200 trabalhadores hospitalares sem comorbidades conhecidas e suas associações epidemiológicas.
Materiais e Métodos: Duzentos indivíduos foram submetidos a ultrassonografia de punhos para mensuração da área da secção trans-versa do nervo mediano. Eles foram questionados e examinados sobre dados epidemiológicos, índice de massa corporal, sinais e sintomas da síndrome do túnel do carpo e submetidos ao Boston carpal tunnel questionnaire (BCTQ) para avaliação da gravidade da
síndrome do túnel do carpo. A área da secção transversa do nervo mediano ≥ 9 mm2 foi considerada diagnóstica de síndrome do túnel do carpo.
Resultados: A síndrome do túnel do carpo foi diagnosticada por ultrassonografia em 34% da amostra estudada. Foi observada asso-ciação desta síndrome com idade (p < 0,0001), parestesia (p < 0,0001), teste de Tinel (p < 0,0001), teste de Phalen (p < 0,0001),
escore do BCTQ (p < 0,0001) e anos de educação formal (p < 0,0001). Anos de educação formal foi a única variável identificada
como fator de risco independente para síndrome do túnel do carpo (IC 95%: 1,03 a 1,24).
Conclusão: A prevalência da síndrome do túnel do carpo na amostra de trabalhadores hospitalares estudada foi 34%. O número de anos de educação formal foi o único fator de risco independente para síndrome do túnel do carpo.
Unitermos: Síndrome do túnel do carpo; Ultrassonografia; Área da secção transversa do nervo mediano; Dor na mão; Parestesia na mão.
* Study developed in the Department of Imaging Diagnosis at Hospital Universi-tário Evangélico de Curitiba, Curitiba, PR, Brazil.
1. Master, MD, Radiologist, Postgraduate student of Ultrasonography, Computed Tomography and Magnetic Resonance Imaging at Hospital Israelita Albert Einstein, São Paulo, Part Time Dedication, Fellow PhD degree, Instituto de Pesquisas Médicas, Faculdade Evangélica do Paraná – Hospital Universitário Evangélico de Curitiba, Curitiba, PR, Brazil.
2. PhD, MD, Rheumatologist, Head of Rheumatology Service, Hospital Universi-tário Evangélico de Curitiba, Full Professor of Rheumatology, Faculdade Evangélica do Paraná, Curitiba, PR, Brazil.
3. PhD, MD, Digestive System Surgeon, Head of the Service of Bariatric and Metabolic Surgery, Hospital Universitário Evangélico de Curitiba, Associate Professor of Traumatology, Surgical Practice II and Scientific Methodology at Faculdade Evangé-lica do Paraná, Curitiba, PR, Brazil.
4. MD, Scientific Research student of Instituto de Pesquisas Médicas da
Facul-INTRODUCTION
Carpal tunnel syndrome (CTS) results from compres-sion of the median nerve at the level of the carpal tunnel. It is the most frequent compressive neuropathy, with prevalence
in the general population of 9.2% in women and 6% in men(1).
Adham do Amaral e Castro1, Thelma Larocca Skare2, Paulo Afonso Nunes Nassif3, Alexandre Kaue Sakuma4,
Wagner Haese Barros5
dade Evangélica do Paraná – Hospital Universitário Evangélico de Curitiba, Curitiba, PR, Brasil.
5. MD, Radiologist, Trainee in Locomotor System Radiology at Hospital Alemão Oswaldo Cruz, São Paulo, SP, Brazil.
Mailing Address: Dr. Adham do Amaral e Castro. Alameda Augusto Stellfeld, 1980, Bigorrilho. Curitiba, PR, Brazil, 80730-150. E-mail: [email protected].
According to Ono et al.(2), CTS is associated with the
sec-ond longest average time away from work and its cost is estimated to be US$30,000 per worker in the United States of America.
Obesity, pregnancy, diabetes mellitus, hypothyroidism,
among other conditions, are associated with CTS(3). The
occupational factor plays a relevant role in the development of this syndrome, particularly in case of tasks involving in-creased vibration, use of great strength and repetitive strain
with the hands(4).
The CTS diagnosis is based on clinical criteria, but it may be supplemented by tests such as electroneuromyography and imaging methods such as ultrasonography (US) and
mag-netic resonance imaging (MRI)(5). US takes less time to be
performed, causes less discomfort to the patient and may be considered to be a more cost-effective strategy as a first-line
method to confirm a clinical suspicion of CTS(6). The
mea-surement of the median nerve area (MNA) is the most
im-portant diagnostic criterion for CTS(7), and 9 mm2
is the
most accurate cutoff point(8).
This study aimed to describe the prevalence of CTS di-agnosed by US and to establish its epidemiological associa-tions in 200 healthy volunteers.
MATERIALS AND METHODS
Two hundred hospital workers with no self-reported known comorbidity (35 men and 165 women) were invited to participate in the study. Age above 18 was the inclusion criterion. Exclusion criteria were the following: pregnancy; untreated hypothyroidism; chronic renal failure under dialy-sis; history of repetitive strain injury; recent trauma affect-ing upper limbs and any form of arthritis; conditions that might be associated with median nerve neuropathy. After approval by the Committee for Ethics in Research of the institution and signing on a term of free and informed con-sent by the participants, all of them completed a Katz dia-gram for pain and paresthesia in the region of the median
nerve(9). The physical examination included measurement
of height and weight for calculation of the body mass index
(BMI)(10) and hands examination by means of the Tinel’s and
Phalen’s tests(9). The Tinel’s test was performed by
repeat-edly tapping on the median nerve of the wrist for 4–6 times(9).
The presence or absence of pain irradiation or paresthesia in the median nerve distribution was recorded. The Phalen’s test was performed by asking the patient to maintain com-plete palmar flexion of the wrist, with extended elbow and pronated forearm. The Phalen’s test was considered to be
positive upon symptoms reproduction in up to one minute(9).
The validated Brazilian version of the Boston carpal tun-nel questionnaire (BCTQ) was utilized for a specific
evalu-ation of the CTS symptoms severity(11). Higher BCTQ scores
are associated with higher degree of damages caused by
CTS(12).
The MNA was measured by US with a Xario®
Toshiba apparatus and a linear 12 MHz multifrequency transducer
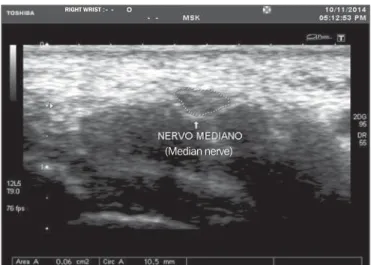
over the distal palmar surface of the wrist (at the level of the proximal flexion fold). The pisiform bone knobs and the scaphoid tubercle were identified by palpation (Figure 1). A single sonographer who was blind for the patients’ clini-cal data performed the measurements. The patients were seated, with the arm in supination on a table, with the wrist in neutral position and the semiflexed fingers at rest. The MNA was automatically calculated by the US apparatus on the basis of a continuous line drawn by the sonographer around the nerve margin (Figure 2) defined as the external margin of the hypoechoic nerve fascicles and the interior of
the hyperechoic nerve sheath(13). A MNA ≥ 9 mm2
was
con-sidered to be diagnostic for CTS(7). As both hands were
evalu-ated, the value considered for statistical purposes was the one regarding the hand with larger MNA.
The data were collected and organized on frequency and contingency tables and the sample distribution was analyzed by the Kolmogorov-Smirnov test.
The central tendency was expressed as median values as a function of the non-parametric sampling. The chi-square test (for nominal data) and the Mann-Whitney test (for nu-merical data) were utilized for association studies. Also, the variables involved in the cause of CTS with significance in
Figure 1. Median nerve visualized in the region of the pisiform and scaphoid bones.
RIGHT WRIST
(Scaphoid)
(Median nerve) (Pisiform)
Figure 2. Cross section of the normal (delineated) median nerve area.
(Median nerve)
the univariate analysis were studied by means of logistic re-gression to assess their independence. The adopted signifi-cance level was 5%. The calculation was performed with the
aid of the Medcalc®
10.0 software.
RESULTS
The present study sample included 35 men and 165 women with mean age corresponding to 40.0 years (range = 18–74 years; interquartile range = 27.0–49.0 years). In the sample, 39/200 (19.5%) of the participants self-reported to be Afrodescendants; 156/200 (78%), Caucasian; and 5/200 (2.5%) self-reported to be Oriental. As regards work activi-ties, 142/200 (71%) individuals had manual occupations and 58/200 (29%), non-manual occupations.
Diagnosis of CTS by US was performed in 34% of the sample. The CTS epidemiological and clinical associations are shown on Table 1.
Associations between CTS and age, BMI, number of years of formal education and BCTQ score were observed (Figure 3).
Logistic regression analysis demonstrated the variable “years of formal education” as an independent risk factor for CTS (Table 2).
DISCUSSION
In the present study, the authors found a high CTS preva-lence (34%) in individuals who had never been previously diagnosed with this disease. Such a high prevalence, in con-trast to the prevalence of 9.2% in women and 6% in men in
the general population(1), could be attributed to the marked
presence of intensive labourers in the sample together with the direct approach by US scan, possibly resulting in an increase in the number of diagnoses of subclinical cases or even of false-positive diagnoses, considering that no other diagnostic approach was performed and the sonographic measurement was the only criterion utilized.
CTS is a very frequently found condition, resulting not only in impaired quality of life, but also in a significant
fi-nancial cost to the health system(6). The BCTQ is a tool
capable of assessing the CTS severity with high validity,
Table 1—Clinical and epidemiological association of CTS in a sample of 200 volunteers without any comorbidity.
Sex Age (years) Body mass index Racial group Occupation
Years of formal education Paresthesia§
Pain§
Positive Tinel’s test Positive Phalen’s test BCTQ
With CTS (n = 68)
15 men; 53 women 22.0 to 74.0 (median, 46.0) 17.7 to 36.68 (median, 27.62) Afrodescendants: 14; Caucasian: 53; Asian: 1 Manual: 56/68 (82.3%); non-manual: 16/68 (23.5%)
0 to 16 (median, 8) 44/68 (64.7%) 37/68 (54.4%) 42/68 (61.7%) 40/68 (58.8%) 19.0 to 80.0 (median, 30.0)
Without CTS (n = 132)
22 men; 110 women 18.0 to 65.0 (median, 34.0) 16.72 to 33.05 (median, 24.35) Afrodescendants: 24; Caucasian: 104; Asian: 4 Manual: 86/132 (65.1%); non-manual: 46/132 (34.8%)
2.0 to 20.0 (median, 11.0) 21/132 (15.9%) 27/132 (20.4%) 21/132 (15.9%) 20/132 (15.1%) 19.0 to 71.0 (median, 19.0)
p
0.35* < 0.0001†
0.0002†
0.74* < 0.0001†
< 0.0001†
< 0.0001* < 0.0001* < 0.0001* < 0.0001* < 0.0001†
* Chi- square test; † Mann-Whitney test; § According to Katz diagram.
Figure 3. Association between CTS and age (A), Body mass index (B) and BCTQ score (C) in 200 individuals.
B
C
A With CTS Without CTS
A g e (y ear s) 8 0 6 0 4 0 2 0 0 B o d y m as s in d ex ( k g /m 2) 4 0 3 0 2 0 1 0 0
With CTS Without CTS
With CTS Without CTS
reliability and response capacity, demonstrating the impact
of this condition on the patients’ lives(12). In the present study,
the BCTQ scores were significantly higher in patients diag-nosed with CTS at US.
Currently, the utility of US in rheumatology and ortho-pedics clinics is increasing, and one can consider that the wide utilization and applicability of the method in the con-text of CTS inclusive, is transforming the clinical practice
in these specialties(14). US is an imaging modality that can
be considered to be a first-line diagnostic tool for CTS due to its noninvasiveness, wide availability and accuracy as
com-pared with electroneuromyography(15). Additionally, in the
hand of a specialist, the method presents a good cost-benefit
ratio(6) when utilized as a screening tool in a population at
risk such as that involved in manual occupations(16). In the
present study, US was utilized as an instrument of screening for CTS in a population of hospital workers presenting with-out any known comorbidity, and, among the individuals diagnosed with CTS by US, the authors observed a signifi-cant association with the classical clinical symptoms (pain and paresthesia in the median nerve area) and CTS signs such as Tinel’s and Phalen’s.
Activities associated with CTS include those involving prolonged, marked wrist flexion or extension, repetitive use
of the flexor muscles and exposure to vibration(17). In the
present sample, despite the absence of details about the po-sitioning of the hands during the work, the patients involved in manual occupations (such as nurses, hygiene workers and radiology technicians) presented higher CTS indices than non-manual workers (such as physicians and psychologists). In a meta analysis on the US accuracy in the diagnosis
of CTS, Carvalho et al.(7) observed that the most relevant
criterion for the US diagnosis was the calculation of the MNA
with a cutoff point between 9 and 10 mm2
. These authors have concluded that US can be utilized in the daily clinical practice as a first-line method in the diagnosis of CTS, with a level of evidence 1b. Although this is a controversial theme
in the literature, the meta-analysis developed by Tai et al.(8)
indicates that the most accurate cutoff point for CTS is 9
mm2
– the value adopted in the present study. Among other criteria which could be utilized in the diagnosis of CTS, the measurement of the MNA at two different sites is highlighted,
with calculation of the difference between the values(18). This
data may increase the accuracy in the diagnosis of CTS, as
demonstrated by Klauser et al.(18), but the present study did
not contemplate such an approach.
Other clinical risk factors related to the CTS physiopa-thology include: pregnancy, menopause, obesity, renal fail-ure, hypothyroidism, use of oral contraceptive drugs, con-gestive heart failure, local tumors and tumor-like lesions such as distal radius fracture, wrist arthritis, diabetes, alcoholism,
vitamin toxicity or deficiency and exposure to toxins(17). In
the present study sample, age and BMI were higher in
pa-tients with CTS (p < 0.0001) for both variables. In the study
developed by Komurcu et al., age and BMI not only were more prevalent in patients with CTS, but also were related
to greater CTS severity(19). Such authors utilized
electro-neuromyography to evaluate the CTS severity in already clinically diagnosed patients.
In spite of the fact that the present study has observed association between CTS and age, BMI, manual occupation and years of formal education in the univariate analysis, as the logistic regression analysis was performed, years of for-mal education was the only variable found as an indepen-dent risk factor for CTS, revealing the huge relevance of this aspects in the whole life of an individual. The present study has just considered the patient’s report on years of formal education. A more comprehensive analysis might reveal a more relevant role of this variable for the development of CTS, since education may be associated with all the aspects in an individual’s life, from feeding habits and BMI to his/ her position and insertion in the labor market. A sociologi-cal approach is beyond the scope of the present study, and should remain as a suggestion for further studies, consider-ing the great relevance of this aspect contribution to the in-dividuals’ health, including the presence of CTS.
CONCLUSION
In the present study, the prevalence of CTS was of 34%. The diagnosis of such a condition was associated with age, BMI, manual occupation and years of formal education at univariate analysis. Logistic regression revealed that only “years of formal education” remained as an independent risk factor for development of CTS.
REFERENCES
1. Alfonso C, Jann S, Massa R, et al. Diagnosis, treatment and follow-up of the carpal tunnel syndrome: a review. Neurol Sci. 2010;31: 243–52.
2. Ono S, Clapham PJ, Chung KC. Optimal management of carpal tunnel syndrome. Int J Gen Med. 2010;3:255–61.
3. LeBlanc KE, Cestia W. Carpal tunnel syndrome. Am Fam Physi-cian. 2011;83:952–8.
4. Barcenilla A, March LM, Chen JS, et al. Carpal tunnel syndrome and its relationship to occupation: a meta-analysis. Rheumatology (Oxford). 2012;51:250–61.
5. Turrini E, Rosenfeld A, Juliano Y, et al. Diagnóstico por imagem do punho na síndrome do túnel do carpo. Rev Bras Reumatol. 2005; 45:81–3.
6. Fowler JR, Maltenfort MG, Ilyas AM. Ultrasound as a first-line test in the diagnosis of carpal tunnel syndrome: a cost-effectiveness analysis. Clin Orthop Relat Res. 2013;471:932–7.
7. Carvalho KMD, Soriano EP, Carvalho MVD, et al. Level of evi-dence and grade of recommendation of articles on the diagnostic
Table 2—Logistic regression analysis of variables associated with CTS.
Variable
Years of formal education Body mass index Age
Manual occupation
Odds ratio
1.13 1.00 1.00 1.41
CI 95%
1.03–1.24 0.92–1.08 0.97–1.03 0.64–3.11
accuracy of ultrasonography in carpal tunnel syndrome. Radiol Bras. 2011;44:85–9.
8. Tai TW, Wu CY, Su FC, et al. Ultrasonography for diagnosing carpal tunnel syndrome: a meta-analysis of diagnostic test accuracy. Ultrasound Med Biol. 2012;38:1121–8.
9. Aroori S, Spence RAJ. Carpal tunnel syndrome. Ulster Med J. 2008;77:6–17.
10. [No authors listed]. Gastrointestinal surgery for morbid obesity: National Institutes of Health Consensus Development Conference Statement. Am J Clin Nutr. 1992;55(2 Suppl):615S–619S. 11. Campos CC, Manzano GM, Andrade LB, et al. Tradução e
valida-ção do questionário de avaliavalida-ção de gravidade dos sintomas e do estado funcional na síndrome do túnel do carpo. Arq Neuropsi-quiatr. 2003;61:51–5.
12. Leite JC, Jerosch-Herold C, Song F. Systematic review of the psy-chometric properties of the Boston Carpal Tunnel Questionnaire. BMC Musculoskelet Disord. 2006;7:78.
13. Alves MPT, Fonseca COP, Granjeiro JM, et al. Carpal tunnel syn-drome: comparative study between sonographic and surgical mea-surements of the median nerve in moderate and severe cases of dis-ease. Radiol Bras. 2013;46:23–9.
14. de Miguel E, Andreu JL, Naredo E, et al. Ultrasound in rheumatol-ogy: where are we and where are we going? Reumatol Clin.2014;10: 6–9.
15. Mondelli M, Fillipou G, Gallo A, et al. Diagnostic utility of ultra-sonography versus nerve conduction studies in mild carpal tunnel syndrome. Arthritis Rheum. 2008;59:357–66.
16. Cartwright MS, Walker FO, Blocker JN, et al. Ultrasound for car-pal tunnel syndrome screening in manual laborers. Muscle Nerve. 2013;48:127–31.
17. Ibrahim I, Khan WS, Goddard N, et al. Carpal tunnel syndrome: a review of the recent literature. Open Orthop J.2012;6:69–76. 18. Klauser AS, Halpern EJ, De Zordo T, et al. Carpal tunnel syndrome
assessment with US: value of additional cross-sectional area mea-surements of the median nerve in patients versus healthy volunteers. Radiology. 2009;250:171–7.