ISSN 0102-695X
DOI 10.1590/S0102-695X2013005000019 Received 14 Oct 2012
Accepted 17 Jan 2013 Available online 25 Feb 2013
concentration of phenolic compounds in
Myrcia
tomentosa
leaves
Leonardo L. Borges,
*Suzana F. Alves, Bruno L. Sampaio,
Edemilson C. Conceição, Maria Teresa F. Bara, José R. Paula
Laboratório de Pesquisa de Produtos Naturais, Faculdade de Farmácia, Universidade Federal de Goiás, Brazil.
Abstract: Myrcia tomentosa (Aubl.) DC., Myrtaceae, found in Central Brazilian Cerrado and popularly known as "goiaba-brava", belongs to the Myrcia genus, which has several species with medicinal properties such as: hypoglycemic, diuretic, hypotensive, antidiarrheal, antimicrobial and antitumor. The present study aimed to analyzed the
environmental inl uence on concentrations of phenolic metabolites in M. tomentosa
leaves. Compounds assayed in the leaves were: total phenols, tannins by protein
precipitation, hydrolysable tannins and total l avonoids and mineral nutrients, while
soil fertility was also analyzed, all over during one year. The results were submitted to Pearson Correlation Analysis and stepwise Multiple Regression Analysis to investigate the relationship between phenolics and environment data. Analysis of variance and Cluster Analysis allowed indicated a high variability in samples from different sites. The results obtained suggests that content of phenolics from M. tomentosa leaves are
inl uenced by environmental factors, particularly some foliar nutrients (Nl, Cal and
Mnl), soil nutrients (Cas and Ks) and Rainfall.
Keywords:
environmental effects multivariate analysis Myrtaceae
secondary metabolism
Introduction
The Myrtaceae family is distributed throughout pantropical and subtropical regions and is constituted by 140 genera and 4000 species. In Brazilian territory, 23 genera with about 1000 species are known (Landrum & Kawasaki, 1997; Souza & Lorenzi, 2005). Myrcia comprise around 250 species and is one of the most important genus in the Myrtaceae family, is found in Brazil and many of its species are employed in folk medicine against diabetes, diarrhea, hemorrhages, ulcers of the mouth and several species have diuretic activity (Russo et al., 1990; Mabberley, 1997). Widespread throughout continental South and Central America, species of this genus display important ecological roles in tropical forests (Cardoso & Sajo, 2006; Ramos et al., 2010).
Myrcia tomentosa (Aubl.) DC., Myrtaceae, commonly known as "goiaba-brava", can be found in Brazilian Cerrado, however, only a few papers have described the secondary compounds found in this species (Dianese et al., 1993; Cardoso & Sajo, 2006; Cardoso et al., 2009; Rossatto et al., 2009; Sá et al., 2012). By microdilution bioassay, leaf essential oils of M. tomentosa
presented moderate activity against Gram positive bacteria, while hexanic and dichloromethanic fractions of leaves showed good activity for Cryptococcus sp. with MIC values
less than 100 μg/mL (Holetz et al., 2002; Sá, 2010).
Environmental factors, such as soil composition, temperature, rainfall and ultraviolet radiation incidence can affect the concentrations of phenolic compounds (Kouki & Manetas, 2002; Monteiro et al., 2006). Among phenolic
compounds, the tannins can be inl uenced by development of the plant and by environmental changes (Hatano et al.,
1986; Salminen et al., 2001). Thus, phenolic compounds and others secondary metabolites represent a chemical interface between plants and environment (Gobbo-Neto
& Lopes, 2007). Changes in phenols amounts inl uence
directly the quality of the plant for medicinal application (Santos et al., 2006).
In our early work was evaluated the environmental
inl uence on the concentration of phenolic compounds in
stem barks of M. tomentosa (Borges et al., 2012). Thus, this work was carried out in order to obtain new information to understanding of the metabolism of phenols in this plant and also provide knowledge to the appropriate cultivation and sampling of the leaves of this plant.
Materials and Methods
Plant material
Leaves of i ve specimens of Myrcia tomentosa
(Aubl.) DC., Myrtaceae, were collected in April 2010,
August 2010, December 2010 and April 2011 in i ve
Brazilian cities: Hidrolândia, GO (16° 53’ 59.4” S; 49° 13’ 29.4” W; 786 m); Nova América, GO (15° 01’11.8” S; 49°52’ 32.2” W; 756 m); Crixás, GO (15° 00’ 30.2” S; 49° 58’ 51.6” W; 755 m); Pires do Rio, GO (17° 12’ 35.5” S; 49° 58’ 51.6” W; 852 m) and São Gonçalo do Abaeté, MG (18° 20’ 27.2” S; 45° 51’ 36” W; 919 m). The plants were identiied by Dr. José Realino de Paula and vouchers specimens were deposited in the Herbarium
of the Universidade Federal de Goiás (UFG), Goiás State, Brazil under code numbers 45518, 43836 and 41318.
Samples were air dried (40 °C), pulverized in a knife mill
and passed through a 100-mesh sieve respectively.
Samples preparation
Dried and ground leaves (0.75 g) were extracted
in a 250 mL erlenmeyer lask with distilled water (150
mL). The mixture was heated to boiling, after kept in water
bath at between 80 and 90 °C during 30 min. The contents of the lask were transferred to a 250 mL volumetric lask and the volume was made up with distilled water. The extract was iltered through qualitative ilter paper, with irst 50 mL discarded. The aqueous extract obtained were used to quantiication of total phenols (TP) and for
protein precipitation assay (PP).
For the quantiication of hydrolysable tannins (HT), dried and ground leaves (0.5 g) were transferred to a 250 mL Erlenmeyer lask with acetone:water 7:3 (3
x 20 mL) and shaken at 60 rpm for 1 h. Next, the residue
was decanted and iltered through qualitative ilter paper.
Each extract was transferred to a rotatory evaporator and
the acetone was evaporated (40 °C). The aqueous extract
obtained was extracted with ethyl ether (3 x 30 mL) in a separation funnel and the ethereal phase was discarded. Then, the aqueous extract free of grease and chlorophyll was frozen and lyophilized, with the yield calculated.
For the quantiication of total lavonoids (Fv),
dried and ground leaves (0.25 g) were transferred to a
125 mL lask with methanol:acetic acid 0.02 M 99:1 (50
mL) and the mixture was incubated in water bath under
relux at 90-100 °C during 40 min and then iltered. All
samples described early were performed in triplicate.
Colorimetric assays
Total phenolics assay (TP)
Ferric chloride was added to aqueous extract solution under alkaline conditions to result in a coloured complex with phenolic compounds (read at 510 nm),
according to Hagerman & Butler (1978) method, adapted
by Waterman & Mole (1987a). All solutions were prepared in triplicate. The standards curves were prepared with tannic acid at the dilutions: 0.10, 0.15, 0.20, 0.25, 0.30 mg/mL.
Protein precipitation assay (PP)
The extract solutions were precipitated with Bovine Serum Albumine (BSA) in 0.2 M acetate buffer
(pH 4.9) and after centrifugation, the precipitated
(containing tannins) was dissolved in sodium dodecyl sulfate/triethanolamine solution, then ferric chloride was added and tannins were complexed (read at 510
nm), according to Hagerman & Butler (1978) method,
adapted by Waterman & Mole (1987b). All solutions were prepared in triplicate. The standards curves were prepared with tannic acid at the dilutions: 0.10, 0.20, 0.30, 0.40, 0.50 mg/mL.
Hydrolysable tannins assay (HT)
From the freeze-dried extract was prepared a solution (1.0 mg extract/mL) capable to reacting with potassium iodate over 10 min. After the time had passed, the absorbance was measured at 550 nm (Willis & Allen, 1998). All solutions were prepared in triplicate. The standards curves were prepared with tannic acid at the dilutions: 0.20, 0.30, 0.40, 0.50, 0.60 mg/mL.
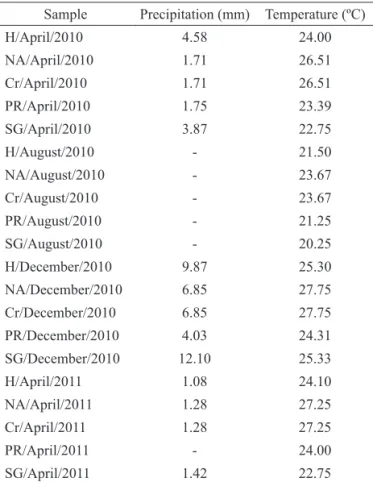
Table 1. Climate data for the collection sites over the period from April 2010 to April 2011 - Mean precipitation (mm) and mean temperature (ºC).
Sample Precipitation (mm) Temperature (ºC)
H/April/2010 4.58 24.00
NA/April/2010 1.71 26.51
Cr/April/2010 1.71 26.51
PR/April/2010 1.75 23.39
SG/April/2010 3.87 22.75
H/August/2010 - 21.50
NA/August/2010 - 23.67
Cr/August/2010 - 23.67
PR/August/2010 - 21.25
SG/August/2010 - 20.25
H/December/2010 9.87 25.30
NA/December/2010 6.85 27.75
Cr/December/2010 6.85 27.75
PR/December/2010 4.03 24.31
SG/December/2010 12.10 25.33
H/April/2011 1.08 24.10
NA/April/2011 1.28 27.25
Cr/April/2011 1.28 27.25
PR/April/2011 - 24.00
SG/April/2011 1.42 22.75
Total lavonoids assay (Fv)
The methanolic extract was directly read at 361 nm (Rolim et al., 2005). All solutions were prepared in triplicate. The standards curves were prepared with rutin at the dilutions: 0.010, 0.015, 0.020, 0.025, 0.030 mg/ mL.
Climatic data
The average of monthly temperature and daily
precipitation were collected from the oficial site of
National Institute for Space Research (Instituto Nacional de Pesquisas Espaciais), (INPE, 2011).
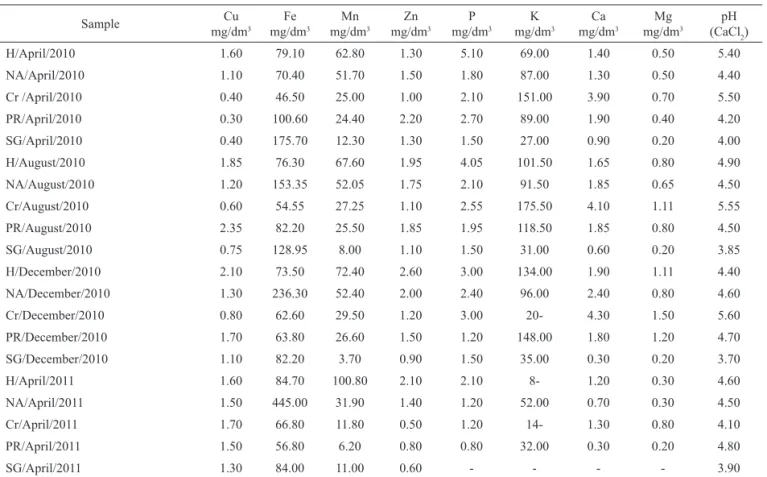
Soil and leaf analysis
Analysis of soil and leaves were performed in Solocria Agricultural Laboratory, following usual techniques (Silva, 2009). Soil samples (500g) were collected at a depth of 20 cm in four locations around each specimen of M. tomentosa in all months. The pH
was determined in a 1:1 soil/water volume ratio. Calcium (Ca), magnesium (Mg) and aluminum (Al) were extracted with KCl 1M, and phosphorus (P), potassium (K), zinc (Zn), copper (Cu), iron (Fe) and manganese (Mn)
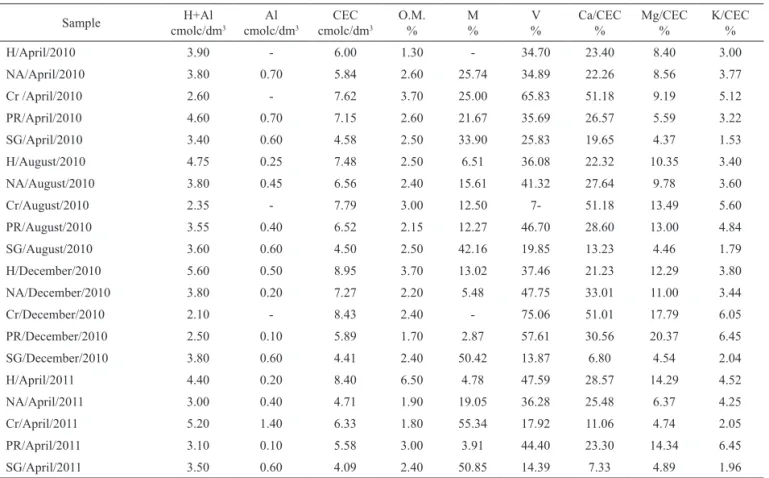
were extracted with Mehlich’s solution. Organic matter
(OM), cation exchange capacity (CEC), potential acidity
(H+Al), base saturation (V) and aluminum saturation (m)
were determined by standard techniques (Silva, 2009). The quantitative determination of minerals in samples of leaves (15 g) and soil was performed according to the procedure described by Silva (2009). Nitrogen was determined by distillation (semi-micro Kjeldahl method), phosphorus by colorimetry, potassium
by lame photometry and sulfur by turbidimetry. Calcium,
magnesium, copper, iron, manganese and zinc were determined by atomic absorption.
Statistical analyses
The relationship between phenolic compounds found in leaves of M. tomentosa and environmental factors were investigate by stepwise Multiple Regression and Pearson's Correlation Analysis implemented using SAS GLM and SAS CORR procedure, respectively (Draper & Smith, 1981). Average multiple comparisons between collections sites and between collection periods were
established by a Two-Way Analysis of Variance (ANOVA)
complemented by the Tukey's test, and in all comparisons,
p<0.05 was considered as indicating signiicance. Cluster
Analysis was also applied to study the similarity of samples on the basis of constituent distribution. The hierarchical clustering was performed according to the Ward's variance
Table 2. Levels of mineral nutrients and fertility parameters of soil from each collection site.
Sample Cu
mg/dm3
Fe mg/dm3
Mn mg/dm3
Zn mg/dm3
P mg/dm3
K mg/dm3
Ca mg/dm3
Mg mg/dm3
pH
(CaCl2)
H/April/2010 1.60 79.10 62.80 1.30 5.10 69.00 1.40 0.50 5.40
NA/April/2010 1.10 70.40 51.70 1.50 1.80 87.00 1.30 0.50 4.40
Cr /April/2010 0.40 46.50 25.00 1.00 2.10 151.00 3.90 0.70 5.50
PR/April/2010 0.30 100.60 24.40 2.20 2.70 89.00 1.90 0.40 4.20
SG/April/2010 0.40 175.70 12.30 1.30 1.50 27.00 0.90 0.20 4.00
H/August/2010 1.85 76.30 67.60 1.95 4.05 101.50 1.65 0.80 4.90
NA/August/2010 1.20 153.35 52.05 1.75 2.10 91.50 1.85 0.65 4.50
Cr/August/2010 0.60 54.55 27.25 1.10 2.55 175.50 4.10 1.11 5.55
PR/August/2010 2.35 82.20 25.50 1.85 1.95 118.50 1.85 0.80 4.50
SG/August/2010 0.75 128.95 8.00 1.10 1.50 31.00 0.60 0.20 3.85
H/December/2010 2.10 73.50 72.40 2.60 3.00 134.00 1.90 1.11 4.40
NA/December/2010 1.30 236.30 52.40 2.00 2.40 96.00 2.40 0.80 4.60
Cr/December/2010 0.80 62.60 29.50 1.20 3.00 20- 4.30 1.50 5.60
PR/December/2010 1.70 63.80 26.60 1.50 1.20 148.00 1.80 1.20 4.70
SG/December/2010 1.10 82.20 3.70 0.90 1.50 35.00 0.30 0.20 3.70
H/April/2011 1.60 84.70 100.80 2.10 2.10 8- 1.20 0.30 4.60
NA/April/2011 1.50 445.00 31.90 1.40 1.20 52.00 0.70 0.30 4.50
Cr/April/2011 1.70 66.80 11.80 0.50 1.20 14- 1.30 0.80 4.10
PR/April/2011 1.50 56.80 6.20 0.80 0.80 32.00 0.30 0.20 4.80
SG/April/2011 1.30 84.00 11.00 0.60 - - - - 3.90
minimization method (Ward, 1963). For these procedures were used the softwares SAS (Statystical Analysis System) and Statistica 7.
Results and Discussion
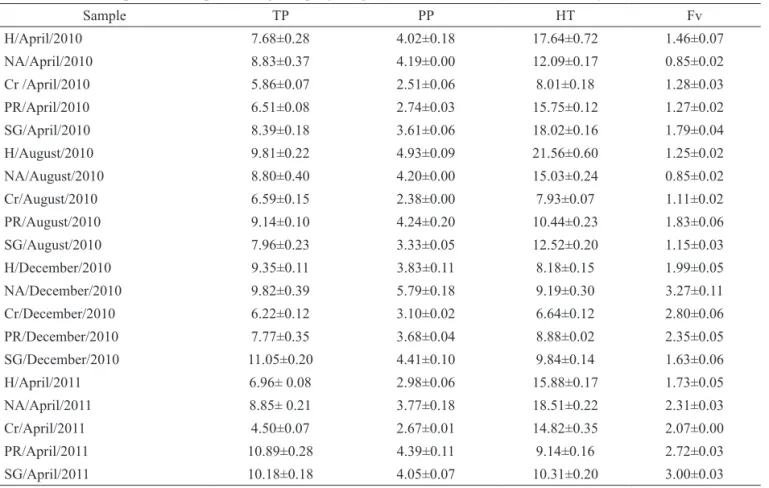
The environmental variables are presented in Tables 1, 2, 3 and 4. The phenolic compounds found in leaves of M. tomentosa are shown in Table 5.
From the stepwise Multiple Regression, was
obtained the following equations with signiicant
(p-values less than 0.05) variables (l=leaf and s=soil):
TP(%)=15.755 - 0.2033Nl - 0.1994Cal - 0.6152Mgl (r2=0.7982; r=0.8934) Equation 1
PP(%)=4.8458 - 0.0864Cal (r2=0.4591; r=0.6775)
Equation 2
HT(%)=9.8413 + 0.0171Mnl - 0.4699Rainfall
(r2=0.4622; r=0.6798) Equation 3
From Table 6, was possible identify that calcium
levels found in soil and leaves presented signiicant
negative correlation, weak (r<0.50) and strong (r>0.70), respectively, with total phenols (TP) and medium correlation (0.50<r<0.70) between foliar calcium and tannins by protein precipitation (PP) (Piaw, 2006). This
result can be attributed to fact that plants with high Ca levels have a higher resistance to diseases (Yamada, 2004), then it is possible that the plant needs to employ protection mechanisms such increase synthesis of phenols to keep its resistance.
The hydrolysable tannins were negatively correlated with the concentration of Ks (medium correlation). Among the macronutrients, K is the element that shows consistent positive results to reducing the incidence of diseases, suggesting a possible mechanism of compensation for the lack of K, with increasing resistance to pathogens by synthesis of hydrolysable
tannins (HT) (Yamada, 2004).
Multiple coeficient of determination (r2) means
the proportion of the total variation that is explained by the overall regression model, so when r2 is higher, the
model its better to data (Bowerman et al., 2005). The
value of r2 is 0.7982 for equation 1 and shows that there
are 79.82% changes in response variables (total phenols), and by comparing models, the equation 1 is the best
model that its the data.
Multiple correlation coeficient (r) is used to
look how far the relationship between one dependent variable and a set of independent variables (Ghani & Ahmad, 2010). The value of r is 0.8934 for equation 1 and shows the multiple correlation strength between total phenols and N, Ca and Mg found in leaves. The foliar nutrients was the principal set of independent variables
Sample H+Al
cmolc/dm3
Al cmolc/dm3
CEC cmolc/dm3
O.M. %
M %
V
%
Ca/CEC %
Mg/CEC %
K/CEC %
H/April/2010 3.90 - 6.00 1.30 - 34.70 23.40 8.40 3.00
NA/April/2010 3.80 0.70 5.84 2.60 25.74 34.89 22.26 8.56 3.77
Cr /April/2010 2.60 - 7.62 3.70 25.00 65.83 51.18 9.19 5.12
PR/April/2010 4.60 0.70 7.15 2.60 21.67 35.69 26.57 5.59 3.22
SG/April/2010 3.40 0.60 4.58 2.50 33.90 25.83 19.65 4.37 1.53
H/August/2010 4.75 0.25 7.48 2.50 6.51 36.08 22.32 10.35 3.40
NA/August/2010 3.80 0.45 6.56 2.40 15.61 41.32 27.64 9.78 3.60
Cr/August/2010 2.35 - 7.79 3.00 12.50 7- 51.18 13.49 5.60
PR/August/2010 3.55 0.40 6.52 2.15 12.27 46.70 28.60 13.00 4.84
SG/August/2010 3.60 0.60 4.50 2.50 42.16 19.85 13.23 4.46 1.79
H/December/2010 5.60 0.50 8.95 3.70 13.02 37.46 21.23 12.29 3.80
NA/December/2010 3.80 0.20 7.27 2.20 5.48 47.75 33.01 11.00 3.44
Cr/December/2010 2.10 - 8.43 2.40 - 75.06 51.01 17.79 6.05
PR/December/2010 2.50 0.10 5.89 1.70 2.87 57.61 30.56 20.37 6.45
SG/December/2010 3.80 0.60 4.41 2.40 50.42 13.87 6.80 4.54 2.04
H/April/2011 4.40 0.20 8.40 6.50 4.78 47.59 28.57 14.29 4.52
NA/April/2011 3.00 0.40 4.71 1.90 19.05 36.28 25.48 6.37 4.25
Cr/April/2011 5.20 1.40 6.33 1.80 55.34 17.92 11.06 4.74 2.05
PR/April/2011 3.10 0.10 5.58 3.00 3.91 44.40 23.30 14.34 6.45
SG/April/2011 3.50 0.60 4.09 2.40 50.85 14.39 7.33 4.89 1.96
Table 4. Levels of macronutrients (Nl, Pl, Kl, Cal, Mgl, Sl in g/kg) and micronutrients (Cul, Fel, Mnl, Znl in mg/kg) in the leaves of Myrcia tomentosa from each collection site over the period from April 2010 to April 2011.
Sample N P K Ca Mg S Cu Fe Mn Zn
H/April/2010 16.00 0.80 12.80 14.00 2.50 1.20 6.00 162.00 420.00 19.00
NA/April/2010 18.00 1.30 9.20 10.50 3.00 1.60 9.00 247.00 308.00 25.00
Cr /April/2010 17.00 1.10 10.40 23.00 4.30 1.40 8.00 162.00 137.00 16.00
PR/April/2010 17.50 1.20 7.60 13.50 4.20 1.50 10.00 183.00 320.00 18.00
SG/April/2010 19.50 1.10 8.00 14.20 1.80 1.50 7.00 141.00 215.00 16.00
H/August/2010 9.60 1.00 5.60 16.10 1.60 1.00 8.00 329.00 340.00 16.00
NA/August/2010 16.80 1.20 0.80 6.30 2.80 1.10 4.00 199.00 87.00 18.00
Cr/August/2010 12.00 1.00 5.00 23.40 3.20 1.00 5.00 257.00 123.00 14.00
PR/August/2010 16.00 1.20 8.00 6.10 4.50 1.40 8.00 217.00 109.00 20.00
SG/August/2010 15.00 0.90 5.20 9.60 2.10 1.10 7.00 165.00 218.00 15.00
H/December/2010 16.60 1.10 6.80 8.00 2.80 1.20 8.00 179.00 172.00 18.00
NA/December/2010 15.80 1.10 6.00 5.80 3.80 1.30 6.00 213.00 168.00 16.00
Cr/December/2010 16.00 1.20 5.20 12.20 4.60 1.20 9.00 99.00 68.00 13.00
PR/December/2010 19.00 1.10 8.80 7.10 2.10 1.10 9.00 131.00 54.00 16.00
SG/December/2010 12.00 1.00 6.00 7.40 2.10 0.80 5.00 116.00 407.00 15.00
H/April/2011 16.80 1.00 8.00 18.00 2.00 1.10 11.00 180.00 500.00 19.00
NA/April/2011 15.60 1.00 8.00 12.00 2.00 1.20 5.00 264.00 485.00 16.00
Cr/April/2011 17.00 1.10 6.60 31.00 2.60 1.50 8.00 144.00 117.00 16.00
PR/April/2011 18.00 1.10 8.40 9.40 1.50 1.00 7.00 174.00 80.00 17.00
SG/April/2011 15.60 1.00 8.00 8.00 1.70 1.10 8.00 147.00 401.00 18.00
H: Hidrolândia; NA Nova América; Cr: Crixás; PR: Pires do Rio; SG: São Gonçalo do Abaeté.
Table 5. Amounts of phenolic compounds in g/100 g dry weight (±standard deviation) of leaves of Myrcia tomentosa.
Sample TP PP HT Fv
H/April/2010 7.68±0.28 4.02±0.18 17.64±0.72 1.46±0.07
NA/April/2010 8.83±0.37 4.19±0.00 12.09±0.17 0.85±0.02
Cr /April/2010 5.86±0.07 2.51±0.06 8.01±0.18 1.28±0.03
PR/April/2010 6.51±0.08 2.74±0.03 15.75±0.12 1.27±0.02
SG/April/2010 8.39±0.18 3.61±0.06 18.02±0.16 1.79±0.04
H/August/2010 9.81±0.22 4.93±0.09 21.56±0.60 1.25±0.02
NA/August/2010 8.80±0.40 4.20±0.00 15.03±0.24 0.85±0.02
Cr/August/2010 6.59±0.15 2.38±0.00 7.93±0.07 1.11±0.02
PR/August/2010 9.14±0.10 4.24±0.20 10.44±0.23 1.83±0.06
SG/August/2010 7.96±0.23 3.33±0.05 12.52±0.20 1.15±0.03
H/December/2010 9.35±0.11 3.83±0.11 8.18±0.15 1.99±0.05
NA/December/2010 9.82±0.39 5.79±0.18 9.19±0.30 3.27±0.11
Cr/December/2010 6.22±0.12 3.10±0.02 6.64±0.12 2.80±0.06
PR/December/2010 7.77±0.35 3.68±0.04 8.88±0.02 2.35±0.05
SG/December/2010 11.05±0.20 4.41±0.10 9.84±0.14 1.63±0.06
H/April/2011 6.96± 0.08 2.98±0.06 15.88±0.17 1.73±0.05
NA/April/2011 8.85± 0.21 3.77±0.18 18.51±0.22 2.31±0.03
Cr/April/2011 4.50±0.07 2.67±0.01 14.82±0.35 2.07±0.00
PR/April/2011 10.89±0.28 4.39±0.11 9.14±0.16 2.72±0.03
that can inluence the levels of total phenols in leaves
of M. tomentosa. The tannins by protein precipitation and hydrolysable tannins presented medium multiple correlation with its sets of independent variables.
Equations 1 and 2 also showed the negative influence of foliar calcium (Cal) over phenolic compounds, due to the negative coefficients obtained in both models, which agree with Pearson's correlation found (Table 6).
Plants with manganese deiciency has the ligniication process impaired and phenolic compounds
accumulate in the plant tissues (Marschner, 1997; Lin et al., 2005). Moreover, several studies showed the
inluence of Mn in the schikimic acid pathway, resulting
in the biosynthesis of many phenolic compounds, such
as lavonoids, tannins and lignin (Santiago et al., 2000;
Diaz et al., 2001; Loponen et al., 2001; Lin et al., 2005;
Guangqiu et al., 2007 ). The positive inluence of Mn over hydrolysable tannins (HT) found in equation 3 and
in Table 6 are in agreement with the previous results about this micronutrient. The potencial base saturation
(V) and hydrolysable tannins were negatively corretaled,
which reveals that fertile soils are not ideal to increase the synthesis of this metabolite group.
Overall, nutritional stress results in increased production of secondary metabolites, except under
sulphur deiciency, when the biosynthesis of secondary
metabolites increases, which is consistent with the
signiicant negative correlation found between foliar
sulphur and total phenols in Table 6 (Gobbo-Neto & Lopes, 2007; Treutter, 2010).
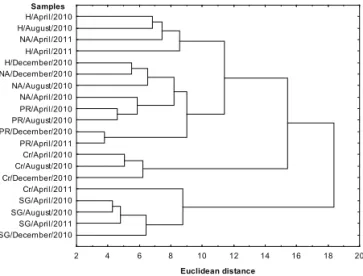
The Hierarchical Cluster Analysis employing
Ward's variance minimizing method showed a highly variability within phenolic compounds of M. tomentosa
leaves. Figure 1 presents the similarities of the samples on the basis of the distribution of the constituents and this may indicate that the main factor responsible in chemical variability is the collection site with their
TP PP HT Fv
OM -0.11517 -0.29846 -0.0765 -0.12997
m -0.0259 -0.19538 0.040816 -0.10326
V -0.35979 -0.26345 -0.44365 0.058814
pH -0.36529 -0.21829 -0.21283 -0.02999
H+Al 0.072197 0.17297 0.4261 -0.18037
Al -0.11461 -0.09713 0.26918 -0.11438
CEC -0.40183 -0.22526 -0.21352 -0.07536
Cus 0.079454 0.14465 0.24212 0.060823
Fes 0.19976 0.26069 0.38799 0.22326
Mns -0.02359 0.17585 0.29728 -0.18366
Zns 0.12052 0.24072 0.18619 -0.16572
P -0.1885 -0.02027 0.38652 -0.23853
Ks -0.28945 -0.26528 -0.47866 0.10125
Cas -0.47639 -0.37524 -0.41946 -0.03442
Mgs -0.19712 -0.10268 -0.43229 0.18771
N -0.2347 -0.18922 -0.12277 0.19683
Pf -0.07167 0.006579 -0.2863 -0.00519
Kf -0.09021 -0.09153 0.060722 0.10824
Caf -0.75588 -0.67759 0.198 -0.25834
Mgf -0.43144 -0.2321 -0.43274 -0.04312
Sf -0.45361 -0.21472 0.13529 -0.10374
Cuf -0.34821 -0.30829 -0.03567 0.084079
Fef 0.21308 0.28569 0.42442 -0.33477
Mnf 0.21845 0.10317 0.56255 -0.11515
Znf 0.1902 0.22312 0.17946 -0.29905
Temperature -0.24626 -0.03541 -0.28829 0.36725
Rainfall 0.24151 0.24987 -0.3463 0.30164
Table 6. Values of Pearson's coeficient between environmental variables and phenolic compounds found in leaves of Myrcia tomentosa.
different environmental factors, the collection time would have less influence in phenols variability
between the different months. A two-way ANOVA also
showed that the collection site was more important in differences than collection time, as can be seen in Table 7. Total phenols, tannins by protein precipitation and hydrolysable tannins don't showed significant
differences. However, April/2010 and August/2010
were different to December/2010 and April/2011, when was considered the total flavonoids (Fv). The differences were greater when considering the means of collecting localities, except for total flavonoids, whose means were not significantly different between the
specimens collected. The Analysis of Variance agrees
with the results obtained from the Cluster Analysis. The chemical variability in M. tomentosa leaves determined by statistical analyses may relect environmental inluence on phenolic compounds contents,
however it may also have been caused by genetic factor in the samples. This work suggests that the main factors
capable to inluence in phenolic compounds concentration
of leaves of M. tomentosa are the foliar nutrients such as: Cal, Mgl, Mnl and Nl. The rainfall also showed capable to change the hydrolysable tannins amounts. The Ks was the only soil nutrient that presented correlation with
hydrolysable tannins, exerting a negative inluence on
this macronutrient. From Cluster Analysis and Analysis
of Variance, was possible conclude that the collection site exercised more inluence than the collection time, due the
similarities of samples of a same site.
Acknowledgment
The authors thank to CAPES and CNPq for
inancial support.
Authors contributions
LLB contributed in the execution of the experimental part of the paper and development of statistical analyses and discussion. SFA gave direct assistance in implementing experimental methods and also in the article writing. BLS contributed with
assistance in collecting plant material and had important help in performing assays of tannins by precipitation of proteins. ECC contributed in writing, especially in the discussion of the manuscript. MTFB contributed in writing, especially in the organization of the data. JRP
contributed in the identiication of specimens, helped in
the collection and processing of plant material, beyond the intellectual contribution to the work.
2 4 6 8 10 12 14 16 18 20
Euclidean distance
SG/December/2010 SG/April/2011 SG/August/2010 SG/April/2010 Cr/April/2011 Cr/December/2010 Cr/August/2010 Cr/April/2010 PR/April/2011 PR/December/2010 PR/August/2010 PR/April/2010 NA/April/2010 NA/August/2010 NA/December/2010 H/December/2010 H/April/2011 NA/April/2011 H/August/2010 H/April/2010
Samples
Figure 1. Dendrogram representing chemical composition similarity
relationships among leaves of Myrcia tomentosa, linking the climatic data, soil nutrients, foliar nutrients and phenolic compounds according to Ward's variance minimization method.
References
Borges LL, Alves SF, Carneiro FM, Conceição EC, Bara MTF, Paula JR 2012. Inluence of environmental factors on
the concentration of phenolic compounds in barks of
Myrcia tomentosa (Aubl.) DC. J Pharm Res 5: 1323-1327.
Bowerman BL, O’Connell RT, Koehler AB 2005. Forecasting, time series and regression. United States of America: Brooks/Cole Thomson Learning Inc.
Cardoso CMV, Proença SL, Sajo MG 2009. Foliar anatomy of
the subfamily Myrtoideae (Myrtaceae). Aust J Bot 57: 148-161.
Table 7. Analysis of phenolic compounds regarding to difference between the collection sites of Myrcia tomentosa specimens and collection period.
FT TPP TH Fv FT TPP TH Fv
Ha,b Ha,b Ha Ha Apr/2010a Apr/2010a Apr/2010a Apr/2010a
NAa NAa NAa NAa Aug/2010a Aug/2010a Aug/2010a Aug/2010a
Crb Crb Cra Cra Dec/2010a Dec/2010a Dec/2010a Dec/2010b
PRa,b PRa,b PRa PRa Apr/2011a Apr/2011a Apr/2011a Apr/2011b
SGa SGa,b SGa SGa
Tukey groups (a and b) are given to show signiicant differences (p<0.05) between specimens and each period. H: Hidrolândia; NA Nova
Cardoso CMV, Sajo MG 2006. Leaf venation in Brazilian
species of Myrtaceae Adans. Acta Bot Bras 20: 657-669.
Dianese JC, Medeiros RB, Santos LTP, Sutton BC 1993.
Coniella costae sp. nov. on leaves of Myrcia tomentosa
from Brazilian cerrado. Mycol Res 97: 1234-1236. Diaz J, Bernal A, Pomar F, Merino F 2001. Induction of
shikimate dehydrogenase and peroxidase in pepper (Capsicum annuum L.) seedlings in response to copper
stress and its relation to ligniication. Plant Sci 161: 179-188.
Draper NR, Smith H 1981. Applied regression analysis. (2 ed.). New York: John Wiley.
Ghani IMM, Ahmad S 2010. Stepwise multiple regression
method to forecast ish landing. Procedia - Soc Behav Sci 8: 549-554.
Gobbo-Neto L, Lopes NP 2007. Plantas medicinais: fatores
de inluência no conteúdo de metabólitos secundários.
Quim Nova 30: 374-381.
Guangqiu Q, Chongling Y, Haoliang L 2007. Inluence of heave
metals on the carbohydrate and phenolics in mangrove,
Aegiceras corniculatum L., seedlings. Bull Environ Contam Toxicol 78: 440-444.
Hagerman AE, Butler LG 1978. Protein precipitation method
for the quantitative determination of tannins. J Agric Food Chem 26: 809-812.
Hatano T, Kira R, Yoshizaki M, Okuda T 1986. Seasonal changes
in the tannins of Liquidanbar formosana relecting their
biogenesis. Phytochemistry 25: 2787-2789.
Holetz FB, Pessini GL, Sanches NR, Cortez DAG, Nakamura CV, Filho BPD 2002. Screening of some plants used in
Brazilian folk medicine for the treatment of infeccious diseases. Mem Inst Osw Cruz 97: 1027-1031.
INPE 2011. Instituto Nacional de Pesquisas Espaciais, Brazil. http://www.inpe.br/, accessed May 8, 2011.
Kouki M, Manetas Y 2002. Resource availability affects differentially the levels of gallotannins and condensed tannins in Ceratonia siliqua. Bioch Syst Ecol 30: 631-639.
Landrum LR, Kawasaki ML 1997. The genera of Myrtaceae in Brazil: an illustrated synoptic treatment and
identiication keys. Brittonia 49: 508-536.
Lin CC, Chen LM, Lui ZH 2005. Rapid effect of copper on
lignin biosynthesis in soybean roats. Plant Sci 168: 855-861.
Loponen J, Lempa K, Ossipov V, Kozlov MV, Girs A, Hangasmaa K, Haukioja E, Pihlaja K 2001. Patterns in
content of phenolic compounds in leaves of mountain birches along a strong pollution gradient. Chemosphere 45: 291-301.
Mabberley DJ 1997. The Plant-book. Cambridge, UK: Cambridge University Press.
Marschner H 1997. Mineral Nutrition of Higher Plants. (2 ed.). London: Academic Press.
Monteiro JM, Albuquerque UP, Lins Neto EMF, Araújo EL,
Albuquerque MM, Amorim ELC 2006. The effects of seasonal climate changes in the Caatinga on tannin level. Rev Bras Farmacogn 16: 338-344.
Piaw CY 2006. Asas statistik penyelidikan Kuala Lumpur:
McGraw-Hill.
Ramos MFS, Monteiro SS, Silva VP, Nakamura MJ, Siani
AC 2010. Essential oils from Myrtaceae species of the Brazilian southeastern maritime forest (restinga). J Essent Oil Res 22: 109-113.
Rolim A, Maciel CPM, Kaneko TM, Consiglieri VO, Salgado-Santos IMN, Velasco MVR 2005. Validation assay for total lavonoids, as rutin equivalents, from Trichilia
catigua Adr. Juss. (Meliaceae) and Ptychopetalum olacoides Bentham (Olacaceae) Commercial Extract. J AOAC Int 88: 1015-1019.
Rossatto DR, Hoffmann WA, Franco AC 2009. Características estomáticas de pares congenéricos de cerrado e mata de galeria crescendo numa região transicional no Brasil
Central. Acta Bot Bras 23: 499-508.
Russo EM, Reichelt AA, De-Sá JR, Furlanetto RP, Moisés RC,
Kasamatsu TS, Chacra AR 1990. Clinical trial of Myrcia unilora and Bauhinia foricata leaf extracts in normal and diabetic patients. Braz J Med Biol Res 23: 11-20.
Sá FAS 2010. Morfoanatomia, composição química do óleo
essencial e atividade antimicrobiana das folhas e casca do caule de Myrcia tomentosa (Aubl.) DC. In: Faculdade de Farmácia, pp. 117. Universidade Federal de Goiás,
Goiânia.
Sá FAS, Borges LL, Paula JAM, Sampaio BL, Ferri PH, Paula JR
2012. Essential oils in aerial parts of Myrcia tomentosa: composition and variability. Rev Bras Farmacogn 22: 1233-1240.
Salminen JP, Ossipov V, Haukioja E, Pihlaja K 2001. Seasonal
variation in the content of hydrolysable tannins in leaves of Betula pubescens. Phytochemistry 57: 15-22.
Santiago LJM, Louro RP, Oliveira DE 2000. Compartimentation of phenolic compounds and phenylalanine ammonialyase in leaves of Phyllanthus tenellus Roxb. and their induction by copper sulphate.
Ann Botany 86: 1023-1032.
Santos SC, Costa WF, Batista F, Santos LR, Ferri PH, Ferreira HD, Seraphin JC 2006. Seasonal variation tannins in
barks of barbatimao. Rev Bras Farmacogn 16: 552-556.
Silva SC 2009. Manual de análises químicas de solos, plantas e fertilizantes. (2 ed.) Brasília: Embrapa Informação
Tecnológica.
Souza VC, Lorenzi H 2005. Botânica Sistemática: Guia Ilustrado para a Identiicação das Famílias de Angiospermas da
Flora Brasileira, Baseado em APG II. Insituto Plantarum de Estudos da Flora, Nova Odessa.
Treutter D 2010. Managing phenol contents in crop plants by phytochemical farming and breeding-visions and constraints. Int J Mol Sci 11: 807-857.
function. J Am Stat Assoc 58: 66-103.
Waterman PG, Mole S 1987a. A critical analysis of techniques for measuring tannins in ecological studies I: techniques
for chemically deining tannins. Oecologia 72: 137-147.
Waterman PG, Mole S 1987b. A critical analysis of techniques for measuring tannins in ecological studies II:
techniques for chemically deining tannins. Oecologia 72: 148-156.
Willis RB, Allen PR 1998. Improved method for measuring hydrolysable tannins using potassium iodate. Analyst 123: 435-439.
Yamada T 2004. Resistência de plantas às pragas e doenças: pode ser afetada pelo manejo da cultura? (vol. 108).
*Correspondence
Leonardo Luiz Borges
Laboratório de Pesquisa de Produtos Naturais, Faculdade de
Farmácia, Universidade Federal de Goiás [email protected]