Ar
ti
cl
e
*e-mail: [email protected]
Environmental Inluence on Phenols and Essential Oils of
Myrciaria caulilora
Leaves
Alessandra R. Duarte,a Suzana C. Santos,a José C. Seraphinb and Pedro H. Ferri*,a
aLaboratório de Bioatividade Molecular, Instituto de Química, Universidade Federal de Goiás, CP 131, 74001-970 Goiânia-GO, Brazil
bNúcleo de Estatística Aplicada, Instituto de Matemática e Estatística, Universidade Federal de Goiás, CP 131, 74001-970 Goiânia-GO, Brazil
O conteúdo foliar de fenóis totais e de taninos, bem como a composição química dos óleos essenciais em populações de Myrciaria caulilora cultivadas em seis diferentes sítios de amostragem
indicou a presença de quatro grupos de amostras de acordo com as características químicas da folha e do solo de cultivo. O grupo I incluiu as amostras oriundas do solo franco-arenoso (S1), caracterizado pela maior e menor percentagem de γ-eudesmol (11,55%) e germacreno D(20,48%), respectivamente, e alto conteúdo de fenóis totais (136,68 mg g−1) e taninos (60,72 mg g−1). O grupo II, rico em elemol (4,61%), incluiu as amostras cultivadas nos solos franco-arenoso-argilosos (S2, S3 e S6), enquanto que as amostras dos solos argilosos S4 (grupo III) e S5 (grupo IV) apresentaram as mais elevadas percentagens de germacreno D (III: 27,20%; IV: 26,83%) e os mais baixos teores de elemol (2,12–2,55%), fenóis totais (79,69 e 111,77 mg g−1) e taninos (34,04 e 44,51 mg g−1). A análise de redundância canônica revelou como o balanço de nutrientes do solo e das folhas inluenciou a distribuição dos constituintes químicos nos diferentes agrupamentos. A variação química parece ser determinada por fatores ambientais.
Foliar contents of total phenols and tannins and the essential oil composition of Myrciaria caulilora populations cultivated in six sampling sites have shown the presence of four clusters
related to soil types and foliar nutrients. Cluster I included samples which originated from sandy loam soil (S1) with the highest and lowest percentages of γ-eudesmol(11.55%) and germacrene D (20.48%), respectively, as well as high total phenol (136.68 mg g−1) and tannin (60.72 mg g−1) contents. Cluster II, rich in elemol (4.61%), included all the samples cultivated from clay sand loam soils (S2, S3, and S6), whereas clay soils S4 (cluster III) and S5 (cluster IV) had the highest amounts of germacrene D (III: 27.20%; IV: 26.83%) and the lowest levels of elemol (2.12-2.55%), total phenols (79.69 and 111.77 mg g−1), and tannins (34.04 and 44.51 mg g−1). The canonical redundancy analysis revealed the relationship between chemical balances in the soil and leaf nutrients in different clusters. Chemovariations may be environmentally determined.
Keywords:Myrciaria caulilora, essential oil, phenol, chemical variability, environmental
inluence, multivariate analysis
Introduction
Jaboticaba, also known as guaperu or sabara, is a small native Brazilian fruit of the caulilorus Myrtle (Myrtaceae). It is grape-like in appearance and texture, although its skin is thicker and tougher, and its color varies from grown to deep purple or black due to high anthocyanin content.1
The ripened berries are highly perishable – postharvest decay occurs within 2-3 days – which is a problem for both transport and storage.2 The plant is distributed in
southern and central Brazilian regions and consists of about nine species of trees and shrubs, among which Myrciaria caulilora (Mart.) O. Berg. and M. jaboticaba (Vell.) O.
Berg. are the most widely cultivated species.3 However,
some of them have been included in the group of threatened Brazilian species due to population decline.3 Recently,
cryopreservation by somatic embryogenic cultures has been successfully applied to the conservation of Myrciaria spp.4
In the Brazilian Cerrado, M. caulilora grows wild or
it is cultivated and its berries are consumed in natura or
and in other parts of South America.5 Citadin et al.6 have
reported that natural shade or full sunlight tree development have not shown differences as regards physico-chemical features of fruit quality. The jaboticaba bagasse lour, which is a good source of iber, proteins and minerals is made up of ine particles which have the fruit’s aroma and its taste is slight salty and bitter.7 Traditionally, an astringent decoction
of sun-dried skins is used as a treatment for hemoptysis, asthma, diarrhea, and chronic inlammation of the tonsils.8
Previous chemical investigations have been restricted to phenolic compounds, including lavonoids, organic acids, anthocyanins, and depsides in fruits, which have also shown strong antiradical activity in DPPH assays.9 Leaf
ethanolic extract has revealed antimicrobial activities on
Streptococcus in the oral cavity responsible for dental
plaque10 and anthocyanin-rich extracts of crushed skins
have been reported as a natural source of dye sensitizer and may be a less costly alternative for the production of solar cells.11
Despite the great potential and growing regional market for M. caulilora, including cosmetics and fragrance,12 the
essential oil compositions from its leaves and fruits as well as the environmental inluence on phenolic contents have not yet been investigated.
We now report on the results obtained for the composition of volatiles and phenolic contents of M. caulilora leaves.
They were collected from cultivated populations on six different soils of Jabuticabal Winery, located in the Central Brazilian Cerrado. For this purpose, total phenols and tannins and the essential oils of representative population samples of each soil origin were analyzed by colorimetric assays and GC-MS. Soil parameters and foliar nutrients in representative samples from each site origin were also determined and regarded as environmental variables. To study environmental inluence on chemical variability, chemical constituents were submitted to canonical redundancy (RDA) and linear discriminant (LDA) analyses in order to detect samples’ distribution pattern and to identify which chemical constituents are able to distinguish between these groups of individuals.
Results and Discussion
In this study, M. caulilora leaf oils and total phenol
and tannin contents were obtained from cultivated plants grown in six different soil types, which form two spatially discontinuous sampling sites at Jabuticabal Winery (S1-S4 and S5-S6 sampling sites). This winery is currently one of Brazil’s biggest producers of jaboticaba, and 11.000 of its 31.000 trees are used in production; furthermore, it commercializes the fruit on an exclusive basis, turning it
into various industrial products.13 The cultivated plants were
made up of 10 to 40 year-old individuals obtained by seed propagation from indigenous populations.
The sampling sites differed considerably with regard to texture and mineral nutrients. Soil textures range from sandy loam (S1) and clay sand loam (S2, S3, and S6) to clay (S4 and S5). The last two soil types are fertilized with organic fertilizer (S4) or a dark purple soil known as terra roxa (S5), whereas S1 and S6 soils showed lower nutrient
balance (see Supplementary Information, SI, Table S1). Similarly, foliar nutrients from representative samples of each site showed that samples growing on S1 and S6 soils had the lowest balance (see SI, Table S2).
The essential oils of M. caulilora collected in the six
sampling sites had an average yield of 0.37 ± 0.13 wt.%. The mean yield of oils from plants growing on the S5 site (0.26 ± 0.04%) was lower than that of plants from soil types S1 (0.48 ± 0.15%) and S6 (0.48 ± 0.08%) (Table 1). As regards the content of essential oils, some species have shown higher content in soils fertilized with chemical or organic fertilizers, such as basil (Ocimum basilicum L.), Mentha arvensis L. and M. piperita L. (Lamiaceae). Other species
are indifferent to fertilization, such as Thymus vulgaris L
(Lamiaceae). Quite different results were observed for M. arvensis and M. villosa Huds., for which the content of
essential oils was progressively reduced as manure amounts increased.14
A total of 28 compounds were identiied, accounting for 97-100 of volatile constituents. All essential oils predominantly reveal sesquiterpene hydrocarbon compositions (47.50-57.22%), even though the oxygenated sesquiterpene content for some sample sites is over 49% (Table 1).
Furthermore, important differences in the amounts of major oil constituents and phenolic contents were found according to samples’ site origin (Table 1). The analysis of variance (ANOVA) indicated that S1 samples had the lowest percentage of germacrene D, bicyclogermacrene and sesquiterpene hydrocarbons, although it showed the highest percentages of oxygenated sesquiterpenes, α-,
Table 1. Percentagesa and yields in essential oils and phenolics (mg g-1) from M. caulilora leaves according to sampling sites
Constituent RIb Sampling sites
S1 S2 S3 S4 S5 S6
1 α-Pinenec 931 0.24 a 0.47 a 0.40 a t t 0.35 a
2 β-Pinenec 975 1.32 a 1.91 a 1.56 a 0.89 a 1.25 a 1.60 a
3 Limonenec 1026 0.53 abc 1.00 a 1.01 ab 0.36 bc 0.22 c 0.90 ab
4 1,8-Cineolec 1029 0.48 a 0.81 a 0.78 a t 0.45 a 0.76 a
5 δ-Elemeneg 1337 1.28 b 1.31 b 1.71 a 1.70 a 1.54 ab 1.75 ab
6 α-Copaenec 1376 1.99 b 2.17 ab 2.35 ab 2.70 a 2.32 ab 2.28 ab
7 β-Bourbonene 1385 1.54 a 1.73 a 1.67 a 0.22 c 0.74 bc 1.12 ab
8 Unknown (M = 204) 1390 0.37 ab 0.75 ab 1.40 a 0.91 ab 0.80 ab 0.19 b
9 β-Elemenee 1392 0.83 ab 0.67 ab 0.16 b 0.07 b 0.59 ab 1.24 a
10 β-Caryophyllened,e 1421 7.55 a 8.58 a 8.95 a 8.13 a 7.92 a 8.34 a
11 β-Copaene 1429 0.41 a 0.44 a 0.50 a 0.20 a 0.18 a 0.30 a
12 6,9-Guaiadiene 1443 0.39 a 0.12 a 0.77 a 0.34 a t 0.61 a
13 α-Humulenec,g 1454 1.27 a 1.36 a 1.52 a 1.33 a 1.28 a 1.40 a
14 allo-Aromadendrenec,g 1461 0.51 a 0.63 a 0.56 a 0.32 a 0.51 a 0.67 a
15 Germacrene De 1484 20.48 c 22.23 bc 23.59 abc 27.20 a 26.83 a 24.24 ab
16 δ-Selinene 1492 0.09 a 0.08 a 0.12 a 0.30 a t t
17 Bicyclogermacrenee 1498 6.29 c 6.72 bc 7.06 abc 7.82 a 7.33 ab 7.55 ab
18 α-Muurolene 1501 0.42 a 0.37 a 0.31 a 0.34 a 0.21 a 0.22 a
19 Germacrene Ah 1506 0.07 b 0.31 ab 0.86 ab 0.52 ab t 0.82 a
20 δ-Cadinenee 1524 2.69 b 2.75 b 2.81 ab 3.32 a 2.96 ab 2.78 b
21 Elemol 1550 3.69 b 4.39 a 4.77 a 2.12 c 2.55 c 4.73 a
22 Germacrene B 1558 1.34 d 1.42 cd 1.49 bcd 1.79 a 1.59 b 1.58 bc
23 Unknown (M = 220) 1578 1.04 b 1.52 a 1.13 ab 0.38 c 0.46 c 1.15 ab
24 Guaiolc 1601 0.29 a 0.15 a 0.33 a 0.32 a t 0.27 a
25 Eremoligenol 1630 0.54 a 1.07 a 0.57 a 0.91 a 0.97 a 0.36 a
26 γ-Eudesmol 1634 11.55 a 9.64 ab 8.12 b 7.81 b 8.75 b 8.81 b
27 β-Eudesmolf 1653 19.20 a 15.68 ab 14.91 b 16.91 ab 17.46 ab 14.84 b
28 α-Eudesmolf 1656 12.72 a 11.24 ab 10.28 ab 12.41 ab 12.94 a 10.31 b
Monoterpenes 2.57 ab 4.19 a 3.75 ab 1.27 b 1.93 ab 3.61 ab
Monoterpene hydrocarbons 2.09 ab 3.39 a 2.97 ab 1.26 b 1.48 ab 2.85 ab
Oxygenated monoterpenes 0.48 a 0.81 a 0.78 a t 0.45 a 0.76 a
Sesquiterpenes 96.54 ab 95.33 b 95.96 ab 98.08 a 97.98 a 95.54 b
Sesquiterpene hydrocarbons 47.50 b 51.64 ab 55.83 a 57.22 a 54.83 a 55.08 a
Oxygenated sesquiterpenes 49.04 a 43.70 ab 40.13 b 40.86 b 43.15 ab 40.46 b
Oil yield (%) 0.48 a 0.32 ab 0.35 ab 0.29 ab 0.26 b 0.48 a
Total phenols 136.68 b 120.91 c 119.94 c 79.69 e 111.77 d 145.04 a
Tannins 60.72 a 57.60 b 54.53 b 34.04 d 44.51 c 63.08 a
aAverage based on original data. bRetention index. cCo-injection with standard. dCo-injection with clove essential oil. eCo-injection with ylang-ylang
essential oil. fCo-injection with sage clary essential oil. gRank and harcsine-transformed in ANOVA analysis (see Experimental section). t = trace ( < 0.05%).
Averages followed by the same letter in the rows did not share signiicant differences at 5% probability by Tukey’s test. Similarly to the M. caulilora fruit, whose oils did not
differ markedly from leaf oils,15 the Amazonian
camu-camu (M. dubia (Kunth) McVaugh) showed higher relative
abundance of two monoterpene hydrocarbons, α-pinene (17.5-74.3%) and limonene (10.8-40.8%), in both fruit and leaf oils. Among the sesquiterpenes, β-caryophyllene had the highest relative abundance (1.1-15.9%).16 On the
other hand, leaves of M. tenella (DC.) O. Berg. (cambuí)
from the Brazilian Northeast revealed higher contents of β-caryophyllene (32.0%),17 whereas samples from
the Brazilian Southeast showed α-pinene (31.5%) and
β-pinene (19.5%) as principal constituents.18 In addition,
leaf oils of M. truncilora O. Berg (jaboticaba de cabinho)
showed high contents of curcumene (18.1%), benzyl tiglate (12.9%), cis-calamenene (12.4%), and α-humulene (11.7),19 whereas M. glazioviana (Kiaersk) G. M. Barroso
& Sobral (cabeludinha) suffered clear seasonal inluence,
The oil constituents including biosynthetic classes and total phenol/tannin contents (treated as species data set) and soil parameters and foliar nutrients (environmental data set) were analyzed jointly via canonical redundancy
analysis (RDA), a multivariate treatment that assesses the way environmental variables may account for species’ data sets.21 In RDA, each canonical ordination axis corresponds
to a direction in the multivariate scatter of species data, which is maximally related to a linear combination of explanatory environmental variables. The species-environmental correlation equals the correlation between sampled site scores that are weighted sums of species and site scores, which in turn are a linear combination of environmental variables.22 RDA canonical axis is
thus similar to principal component analysis, but it has a restriction on sampled site scores.21
Figure 1 shows RDA’s ordination results of leaf oils and phenol content data set, whose soil and foliar nutrients were treated as environmental variables (6 sites (36 samples) × 36 oil/phenol contents × 26 environmental variables). Oil/ phenol-environmental correlations were higher for the irst two canonical axes (0.943 and 0.620), explaining 84.7% of the cumulative variance in the oil/phenol-environmental relation. These results suggest a strong association between oil composition/phenol content and the measured soil/foliar nutritional parameters (environmental factors) shown in the data set.
According to the triplot shown in Figure 1,21 RDA’s axis 1
clearly correlated to nutrient balance in clayey soil S4 (Mg,
Ca, K, Zn, Mn, P, organic matter, and cationic change capacity), which shows a strong relationship with total sesquiterpenes, germacrene B, germacrene D, δ-cadinene and α-copaene, whereas total monoterpenes, β-bourbonene, elemol, total phenols, and tannins load fairly strongly onto the sand soils (S1-S3 and S6) rich in Al and Fe. On the other hand, an increase in the value of RDA’s axis 2 is associated with an increase in foliar micronutrients (Cu, Mn) of S1 sample origin, which also showed high contents of total oxygenated sesquiterpenes and eudesmols. In addition, the value increase of axis 2 is also highly linked with a reduction in foliar macronutrients (N, P, S, Mg, and Fe) of S3/S6 samples, which show high amounts of total sesquiterpene hydrocarbons, germacrene A, and limonene. Thus, whereas axis 1 shows changes in soil fertility, axis 2 describes a differential nutrient accumulation in sampled leaves from different sites. A signiicance test with an unrestricted Monte Carlo permutation test (9,999 permutations) found Fischer’s
F-ratio for the eigenvalues of RDA axes 1 (F-value =11.215; p < 0.0001) and 2 (F =5.017; p < 0.0179). Trace statistics
were highly signiicant, giving signs that patterns did not arise by chance.21
Several studies have reported the involvement of Cu and Mn in the shikimic acid pathway leading to the biosynthesis of several phenols, such as lavonoids, tannins, and lignin.23,24
In plants with copper and manganese deiciency, ligniication is impaired and phenolics accumulate in plant tissues.25 A
dose-response effect of copper on foliar tannins has been reported in seedlings of Aegiceras corniculatum (L.) Blanco
(Myrsinaceae).24 At irst tannins decreased with an increase
in copper supply; however, when copper reached toxic levels the tannin concentration also increased. These results show that the biosynthesis of phenolic compounds is dependent on Cu and Mn levels: ligniication is inhibited in deicient tissues and the production of other phenolics is enhanced, which is probably the case of cluster I. When Cu and Mn achieve suficient levels, lignin biosynthesis increases, most likely using other phenolics as intermediates.
The observed positive and negative correlation between foliar Mg and Mn, respectively, and δ-cadinene is in agreement with the requirement of sesquiterpene synthases for a divalent metal ion as cofactor.26 In peppermint, the only by-product
(δ-cadinene) produced by (E)-β-farnesene synthase in the presence of Mg2+ was entirely absent in the presence of Mn2+
ions.27 In addition, the formation of sesquiterpenes such as
germacrenes D and B and bicyclogermacrene from farnesyl diphosphate by germacrene D synthase in ginger (Zingiber oficinale Roscoe; Zingiberaceae) is favored with Mg2+ as
cofactor, but it is inactive in the presence of Cu2+ ions.28
Similar negative effects of foliar Mn on δ-cadinene and foliar Cu on germacrenes D and B, and bicyclogermacrene
Figure 1. RDA ordination of the irst two axes showing the distribution
are in agreement with the negative correlation observed in this study.
As regards foliar phenolic distributions, we found correlations with some volatile constituents in samples from low fertilized sand soils. An explanation for this correlation is that phenolics − especially lavonoids − were protecting leaves by acting as antioxidants and a higher concentration was required to protect leaves from abiotic stresses.29
Phenolic contents in plant tissues have been related to nutrient availability. In most studies, phenolic production decreases at high nitrogen availability and increases under nitrogen deiciency.30 This trend was not followed by M.
caulilora, which showed no correlation in total phenol/
tannin contents with nitrogen levels; this phenomenon has also been reported for tannins in Colophospermum mopane (J. Kirk ex Benth.) J. Léonard (Fabaceae).31 In our
experiment, phenols and foliar nutrients revealed signiicant relationships with three foliar micronutrients (Mn, Cu, and Zn) and only one foliar macronutrient (K).
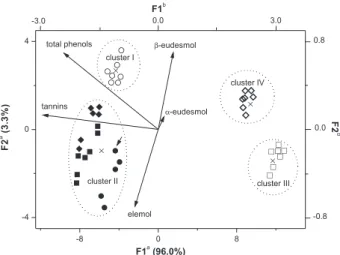
When the LDA analysis was applied to the data set, samples from the six soils were grouped as shown in Figure 2. The itted model has elemol, α-eudesmol, β-eudesmol, total phenols, and tannins as predictor variables. The irst discriminant function (F1) accounts for 96% of total variability and distinguishes (F-value = 43.944; degree of
freedom, DF = 15 and 85; p < 0.0001) cluster I (S1) and II
(S2, S3, and S6) samples from clusters III (S4) and IV (S5) due to the former’s high negative scores of total phenols and tannins. On the other hand, F2 highlights (F = 10.564; DF = 8 and 64; p < 0.0001) cluster III (S2, S3, and S6) as
a result of elemol’s high negative scores.
In addition, the two discriminant functions make it possible to correctly classify 98.6% of samples in the original clusters by means of a cross-validation approach.32 This
involves making a number of slightly reduced modiications to the parent data set, estimating parameters from each of these modiied data sets and then calculating the accuracy of predictions by each of the resulting models. The only mismatched classiication was a sample originating from an S3 soil (cluster II) which had been classiied as belonging to cluster I (S1). Such misclassiication could be caused by a higher level of α-eudesmol and β-eudesmol in the sample, which is a feature of the S1 sampling site. Percentages of oil constituents/total phenol and tannin contents, as well as soil parameters in clustered samples are shown in a supplementary information ile (see SI, Tables S4 and S5, respectively).
Previous studies have also revealed that the chemical polymorphism of essential oils of Hyptis,33 Thymus,34 Baccharis,35 Lychnophora,36 and Eugenia species vary
signiicantly under different environmental abiotic factors,37
such as temperature, latitude, moisture, and chemical soil composition. It has also been reported that abiotic conditions such as soil nutrients, water stress, pollution, light, and altitude can affect the production of plant phenols and tannins.38
Although most of the total variance in this study was accounted for by environmental relations among populations, a signiicant amount (about 15.3% of total variability) could be associated with genetic variations in the sampled populations.
Conclusions
The chemical variability in M. cauliflora leaves
determined by multivariate chemometric techniques may relect environmental inluence on oil compositions and phenol/tannin contents, although it may also have been caused by genetic factors in cultivated samples. In this work, the percentage of oil constituents or the accumulated percentage of grouped volatiles based on carbon skeletons afforded similar results in chemical polymorphism.
Experimental
Plant material
Cultivated M. cauliflora leaves were collected
in November 2008 at Jabuticabal Winery, located in Hidrolândia, Goiás State, Brasil. Leaf samples were obtained from 39 trees grown in six different soils (sampling sites): S1 (S 16° 55′ 22.9″, W 49° 21′ 49.9″), 7 sampled trees; S2 (S 16° 55′ 24.5″, W 49° 21' 53.3''), 7 samples; S3
Figure 2. Canonical discriminant scatterplot of M. caulilora originating
from six sampling sites to which clusters I (S1, ), II (S2, ; S3, and S6, ), III (S4, £), and IV (S5, ) belong. aAxes refer to scores from
samples. bAxes refer to loadings from discriminant variables represented
(S 16° 55′ 25.9″, W 49° 21′ 41.0″), 5 samples; S4 (S 16°
55′ 24.3″, W 49° 21′ 36.0″), 7 samples; S5 (S 16° 54′ 40.6″, W 49° 21′ 26.4″), 7 samples; S6 (S 16° 54′ 43.9″, W 49° 21′ 25.4″), 6 samples. Trees were from 10 to 40 years old and originated from the seeds of the same progenies.
To assess chemical composition, leaf samples were dried for 7 days at 30 °C until constant weight. After having been powdered, each dried phytomass (ca. 50 g) was
submitted to hydrodistillation (4 h) by means of a modiied Clevenger-type apparatus. At the end of each distillation oils were collected, dried with anhydrous Na2SO4, transferred to glass lasks, and kept at a temperature of
−18 °C until analysis. Oil yields (%) were based on the dried weight of plant samples.
Soil and leaf analyses
Soil samples were collected at a depth of 40 cm in all localities. Three soil samples were collected around the canopy of each tree and pooled together to form a composite sample for each site (S1-S6); they were subsequently air-dried, thoroughly mixed, and sieved (2 mm). The portion finer than 2 mm was kept for physical and chemical analysis.39 The pH was determined in a 1:1 soil/water
volume ratio. Ca, Mg, and Al were extracted with KCl 1M, and P, K, Zn, Cu, Fe, and Mn were extracted with Mehlich solution. Organic matter, cationic exchange capacity (CEC), potential acidity (H+Al), and soil texture were determined by the usual methods.39
The dried and powdered leaves of each tree were pooled to form a composite sample for each site and foliar nutrients (N, S, P, K, Ca, Mg, Mn, Zn, Cu, and Fe) were also determined by the usual methods.39 Soil parameters
and foliar nutrients were ordered in an environmental data matrix with 26 variables for each sampling site.
Oil analyses
Oil sample analyses were performed on a GC-MS Shimadzu QP5050A instrument under the following conditions: a CBP-5 (Shimadzu) fused silica capillary column (30 m×0.25 mm i.d., 0.25 µm ilm thickness) connected to a quadrupole detector operating in the EI mode at 70 eV with a scan mass range of 40-400 m/z at a
sampling rate of 1.0 scan s−1; carrier gas: He (1 mL min−1);
injector and interface temperatures of 220 °C and 240 °C, respectively, with a split ratio of 1:20. The injection volume was 0.4 µL (ca. 20% in hexane) and the oven
temperature was raised from 60 to 246 °C with an increase of 3 °C min−1, then 10 °C min−1 to 270 °C, holding the
final temperature for 5 min. Individual components
were identiied by a comparison of their linear retention indices,40 which were determined by a co-injection with a
C8-C32 n-alkanes series,41 co-injection with standards, clove
(Syzygium aromaticum (L.) Merrill & Perry, Myrtaceae),
ylang-ylang (Cananga odorata (Lam.) Hook. F. & Thoms.,
Annonaceae) and sage clary (Salvia sclarea L., Lamiaceae)
essential oils,40 mass spectra with those of the literature,40
and a computerized MS-database using NIST libraries.40
Total phenolic content
The powdered and dried leaves (0.2 g) of each soil site were extracted at room temperature with 50% v/v aqueous ethanol in an ultrasonic bath. Samples were extracted twice with 10 mL of solvent, irst during 30 min and later during 15 min, and then with 5 mL for 15 min. The extracts were combined to a inal volume of 25 mL. Total phenolic analysis was performed by the Folin-Ciocalteu method.42
Extracts or tannic acid (Merck) (0.5 mL) and 0.5 mL of 2 mol L-1 Folin-Ciocalteu reagent (Sigma, St. Louis, MO,
USA) diluted 10-fold were mixed in a 25 mL volumetric lask. After 5 min, 10 mL of 20% Na2CO3 solution were added and the volume reached 25 mL with distilled water. This mixture was then allowed to stand for 60 min at room temperature and the absorbance was determined at 750 nm. The standard curve was constructed with tannic acid at the following dilutions: 0.02, 0.1, 0.2, 0.3, 0.4, 0.5, 0.6 mg mL−1.
The correlation coeficient was r = 0.9987. Total phenolic
content was calculated as tannic acid equivalents (TAE) per g
of dry weight. All solutions were analyzed in triplicate.
Tannin content
The extract solutions (1.0 mL) were precipitated with 2.0 mL of bovine serum albumine (BSA; fraction V, Sigma) solution (1.0 mg mL−1) in 0.2 mol L-1 acetate buffer
(pH 4.9).43 After centrifugation the precipitate was dissolved
in sodium dodecyl sulfate (Sigma)/triethanolamine (Merck) solution (4.0 mL) and the tannins were complexed with 1.0 mL of FeCl3 solution; the colored complex was then read at 510 nm. Measurements were made in the range 0.2 < A < 0.9. All solutions were analyzed in triplicate. The standard curve was constructed with tannic acid at the following dilutions: 0.2, 0.3, 0.4, 0.5, 0.6, 0.8, 1.0 mg mL−1.
The linearity range went from 0.2 to 0.6 mg mL−1. The
correlation coeficient for this range was r = 0.9964.
Chemical variability
Ordination) version 4.5 was used jointly with CanoDraw for Windows 4.1 packages.21,44 Oil compositions (28 volatile
constituents in addition to 6 biosynthetic classes) and total phenol/tannin contents were ordered in a species data matrix with rows (36) = localities (samples from six sites) and columns (36) = oil/phenolic variables. Soil parameters and foliar nutrients were ordered in an environmental data matrix with rows (36) = localities (samples from six sites) and columns (26) = ecological variables.
The preliminary analyses applied the default options of the detrended canonical analysis (DCA) to CANOCO21 to
check the magnitude of change in oil/phenolic composition along the first ordination axis (i.e. gradient length in
standard deviation units, SD). In this study, DCA estimated the compositional gradient in the species data to be shorter than 0.4 SD units, thus canonical redundancy analysis (RDA) was the appropriate ordination method to perform linear direct gradient analysis.21
Redundancy analysis was applied to elucidate the patterns of the only explained variation of interrelationships between oil composition/phenolic content and the variation within populations as a function of soil parameters and foliar nutrients, treated as environmental variables. An unrestricted Monte Carlo permutation test (9,999 permutations) was used to test the signiicance of the eigenvalues of the first two canonical axes. Intra-set correlations from the RDA were therefore used to assess the importance of environmental variables.
Linear discriminant analysis (LDA) via CANOCO
was used to differentiate populations in which the set of environmental variables involved single nominal variables deining a priori recognized clusters.21 Thus,
clusters were coded as dummy environmental variables based on RDA analyses. Forward stepwise procedure on the oil/phenol data set was used as variable selection. Partial Monte Carlo permutation tests (999 permutations) adjusted by Bonferroni corrections were used to calculate the statistical signiicance of variables’ effects.45 The
predictive ability of linear discriminant functions was evaluated by a cross-validation approach.32 Prior to the
multivariate analysis the data was preprocessed by auto-scaling and mean centering.
In all tables, average multiple comparisons were established by one-way ANOVA using SAS GLM analyses. All data was checked for homoscedasticity with the use of Hartley’s test. This test revealed signiicant deviations from the basic assumption for oil constituents 19 and 5, 13, 14 (Table 1), which were arcsine- and rank-transformed, respectively. Whenever a difference was established a
post-hoc Tukey test was performed. Results are shown as
mean values and are joined by the standard deviation of
independent measurements in some cases. P-values below
0.05 were regarded as signiicant.
Supplementary Information
Supplementary data are available free of charge at http://jbcs.sbq.org.br, as a PDF ile.
Acknowledgments
The authors are indebted to CNPq, PADCT III, and FUNAPE/UFG for inancial support, as well as to CAPES for granting A.R.D. a fellowship. We also acknowledge Dr. Paulo Antônio Silva of Jabuticabal Winery for providing valuable plant information and for helping with data collection and Dr. Anita J. Marsaioli (IQ-Unicamp) for supplying the standards.
References
1. Trevisan, L. V.; Bobbio, P. A.; Bobbio, F. O.; J. Food Sci.1972,
37, 818.
2. Brunini, M. A.; Oliveira, A. L.; Salandini, C. A. R.; Bazzo, F. R.;
Cienc. Tecnol. Aliment.2004, 24, 378; Sato, A. C. K.; Cunha,
R. L.; J. Food Eng.2009, 91, 566.
3. Mattos J. R.; Jaboticabeiras, Instituto de Pesquisas de Recursos
Naturais Renováveis: Porto Alegre, Brasil, 1983; Donadio, L. C.; Jabuticaba (Myrciaria jaboticaba (Vell.) Berg). Série Frutas Nativas. Funep: Jaboticabal, SP, Brasil, 2000.
4. Motoike, S. Y.; Saraiva, E. S.; ventrella, M. C.; Silva, C. V.; Salomão, L. C. C.; Plant Cell Tisue Organ Cult.2007, 89, 75. 5. Asquieri, E. R.; Candido, M. A.; Damiani, C.; Assis, E. M.;
Alimentaria2004, 355, 97; Asquieri, E. R.; Damiani, C.; Candido, M. A.; Assis, E. M.; Alimentaria2004, 355, 111;
Popenoe, W.; Manual of Tropical and Subtropical Fruits, Hafner Press: New York, 1974.
6. Citadin, I.; Vicari, I. J.; Silva, T. T.; Danner, M. A.; Rev. Bras. Agrocienc.2005, 11, 373.
7. Ascheri, D. P. R.; Ascheri, J. L. R.; Carvalho, C. W. P.; Cienc. Tecnol. Aliment.2006, 26, 897.
8. Morton, J.; Fruits of Warm Climates, Winterville: NC, 1987. 9. Einbond, L. S.; Reynertson, K. A.; Luo, X.-D.; Basile, M. J.;
Kennelly, E. J., Food Chem. 2004, 84, 23; Montes, C.; Vicario, I. M.; Raymundo, M.; Fett, R.; Heredia, F. J.; Food Res. Int.
2005, 38, 983; Reynertson, K. A.; Wallace, A. M.; Adachi, S.; Gil, R. R.; Yang, H.; Basile, M. J.; D’Armiento,, J.; Weinstein, I. B.; Kennell, E. J.; J. Nat. Prod. 2006, 69, 1228; Jham, G. N.; Fernandes, S. A.; Garcia, C. F.; Quim. Nova2007, 30, 1529;
Lima, A. J. B.; Corrêa, A. D.; Alves, A. P. C.; Abren, C. M. P.; Dantas-Barros, M.; Arch. Latinoam. Nutr.2008, 58, 416;
E. J.; Food Chem.2008, 109, 883; Assis, S. A.; Velllosa, J. C. R.; Brunetti, I. L.; Khalil, N. M.; Cerqueira Leite, K. M. S.; Martins, A. B. G.; Oliveira, O. M. M. F.; Int. J. Food Sci. Nutr.
2009, 60, 439.
10. Carvalho, C. M.; Macedo-Costa, M. R.; Pereira, M. S. V.; Higino, J. S.; Carvalho, L. F. P. C.; Costa, L. J.; Rev. Bras. Pl. Med.2009,11, 79.
11. Polo, A. S.; Iha, N. Y. M.; Sol. Energy Mater. Sol. Cells2006,
90, 1936.
12. Lüdders, P.; Duarte, O.; Erwerbs-Obstbau 1997, 39, 72; Ascheri,
D. P. R.; Andrade, C. T.; Carvalho, C. W. P.; Mitsuharu, O.; Masako, T.; Mitsuco, K.; JP 2001122731, 2001;Ascheri, J. L.
R.; Cienc. Tecnol. Aliment.2006, 26, 325.
13. http://www.vinicolajabuticabal.com.br, accessed in October 2009.
14. Anwar, M.; Patra, D. D.; Chand, S.; Alpesh, K.; Naqvi, A. A.; Khanuja, S. P. S.; Comm. Soil Sci. Plant Analysis2005, 36, 1737; Munsi, P. S.; Acta Hort. 1992, 306, 436; Mitchell, A.
R.; Farris, N. A.; J. Plant Nutr.1996, 19, 955; Shalaby, A. S.; Razin, A. M.; J. Agron. Crop Sci.1992, 168, 243; Singh, K.;
Singh, V.; Ram, P.; Indian J. Agron. 1988, 33, 287. 15. Duarte, A. R.; Ferri, P. H.; personal communication.
16. Franco M. R.; Shibamoto, T.; J. Agric. Food Chem.2000, 48, 1263; Quijano, C. E.; Pino, J. A.; J. Essent. Oil Res.2007, 19,
527; Quijano, C. E.; Pino, J. A.; J. Essent. Oil Res.2008, 20, 205.
17. Andrade, E. H. A.; Silva, A. C. M.; Zoghbi, M. G. B.; J. Essent. Oil Res.2006, 18, 93.
18. Schneider, N. F. Z.; Moura, N. F.; Colpo, T.; Marins, K.; Marangoni, C.; Flach, A.; Rev. Bras. Farm.2008, 89, 131.
19. Pereira, A. C. M.; Martins, R. C. C.; Rev. Pibic, Centro Universitário UNIFIEO, Osasco, 2007, 4, 49.
20. Lopes, M. M.; MSc Dissertation, Universidade Federal de Viçosa, Brasil, 2008. (www.tede.ufv.br/tedesimplificado/ tde_busca/arquivo.php?codArquivo=1839, accessed in May 2010)
21. Ter Braak, C. J. F.; Šmilauer, P.; CANOCO Reference Manual and CanoDraw for Windows User’s Guide: Software for Canonical Community Ordination (version 4.5), Microcomputer Power: New York, 2002; Jongman, R. H. G.; Ter Braak, C. J. F.; Van Tongeren, O. F. R.; Data Analysis in Community and Landscape Ecology, Cambridge University Press: Cambridge, 2002; Lepš,
J.; Šmilauer, P.; Multivariate Analysis of Ecological Data Using CANOCO, Cambridge University Press: Cambridge, 2007.
22. Legendre, P.; Legendre, L.; Numerical Ecology, 2nd ed., Elsevier
Science: Amsterdam, 2003.
23. Diaz, J.; Bernal, A.; Pomar, F.; Merino, F.; Plant Sci.2001, 161, 179.
24. Guangqiu, Q.; Chongling, Y.; Haoliang, L.; Bull. Environ. Contamin. Toxicol.2007, 78, 440.
25. Lin, C. C.; Chen, L. M.; Lui, Z. H.; Plant Sci.2005, 168, 855.
26. Picaud, S.; Olofsson, L.; Brodelius, M.; Brodelius, P. E.; Arch. Biochem. Biophys. 2005, 436, 215.
27. Crock, J.; Wildung, M.; Croteau, R.; Proc. Natl. Acad. Sci. USA
1997, 94, 12833.
28. Picaud, S.; Olsson, M. E.; Brodelius, M.; Brodelius, P. E.; Arch. Biochem. Biophys. 2006, 452, 17.
29. Close, D. C.; McArthur, C.; Hagerman, A. E.; Fitzgerald, H.;
Phytochemistry2005, 66, 215.
30. Haukioja, E.; Ossipov, V.; Koricheva, J.; Honkanen, T.; Larsson, S.; Lempa, K.; Chemoecology1998, 8, 133.
31. Ferwerda, J. G.; Wieren, S. E.; Skidmore, A. K.; Prins, H. H. T.; Plant Soil2005, 273, 203.
32. Wold, A.; Eriksson, L. In Chemometric Methods in Molecular Design, vol. 2; Waterbeemd, H.; ed.; VCH: Weinheim, Germany,
1995, ch. 5.
33. Azevedo, N. R.; Campos, I. F. P.; Ferreira, H. D.; Portes, T. A.; Seraphin, J. C.; Paula, J. R.; Santos, S. C.; Ferri, P. H.; Biochem. Syst. Ecol.2002, 30, 205; Oliveira, M. O.; Campos, I. F. P.;
Oliveira, C. B. A.; Santos, M. R.; Souza, P. S.; Santos, S. C.; Seraphin, J. C.; Ferri, P. H.; Biochem. Syst. Ecol.2005, 33, 275.
34. Loziene, K.; Venskutonis, P. R.; Biochem. Syst. Ecol.2005, 33, 517. 35. Silva, F. G.; Oliveira, C. B. A.; Pinto, J. E. B. P.; Nascimento,
V. E.; Santos, S. C.; Seraphin, J. C.; Ferri, P. H.; J. Braz. Chem. Soc.2007, 18, 990.
36. Curado, M. A.; Oliveira, C. B. A.; Jesus, J. G.; Santos, S. C.; Seraphin, J. C.; Ferri, P. H.; Phytochemistry2006, 67, 2363.
37. Duarte, A. R.; Naves, R. R.; Santos, S. C.; Seraphin, J. C.; Ferri, P. H.; J. Braz. Chem. Soc.2009, 20, 967.
38. Hatano, T.; Kira, R.; Yoshizaki, M.; Okuda, T.; Phytochemistry
1986, 25, 2787; Mole, S.; Ross, J. A. M.; Waterman, P. G.; J. Chem. Ecol. 1988, 14, 1; Loponen, J.; Lempa, K.; Ossipov, V.; Kozlov, M. V.; Girs, A.; Hangasmaa, K.; Haukioja, E.; Pihlaja, K.;
Chemosphere 2001, 45, 291; Santos, S. C.; Costa, W. F.; Ribeiro, J. P.; Guimarães, D. O.; Ferri, P. H.; Ferreira, H. D.; Seraphin, J. C.; Fitoterapia2002, 73, 292; Scogings, P. F.; Dziba, L. E.; Gordon, I. J.; Austral Ecol. 2004, 29, 278; Zidorn, C.; Schubert,
B.; Stuppner, H.; Biochem. Syst. Ecol.2005, 33, 855; Santos, S. C.; Costa, W. F.; Batista, F.; Santos, L. R.; Ferri, P. H.; Ferreira, H. D.; Seraphin, J. C.; Braz. J. Pharmacog. 2006,16, 552. 39. Silva, S. C.; Manual de Análises Químicas de Solos, Plantas e
Fertilizantes, 1a ed.; Embrapa: Brasília, Brasil, 1999.
40. Adams, R. P.; Identiication of Essential Oil Components by Gas Chromatography/Mass Spectrometry, 4th ed., Allured:
Illinois, 2007; National Institute of Standards and Technology;
PC version of the NIST/EPA/NIH Mass Spectral Database, U.S. Department of Commerce: Gaithersburg, 1998; Kubeczka, K. -H.; Formáček, V.; Essential Oils Analysis by Capillary Gas Chromatography and Carbon-13 NMR Spectroscopy, 2nd ed.,
John Wiley & Sons: New York, 2002; Pitarokili, D.; Couladis, M.; Petsikos-Panayotarou, N.; Tzakou, O.; J. Agric. Food Chem.
41. Van Den Dool, H.; Kratz, P. D.; J. Chromatogr.1963, 11, 463. 42. Singleton, V. L.; Rossi, J. A. Jr.; Am. J. Enol. Vitic.1965, 16,
144.
43. Hagerman, A. E.; Butler, L. G.; J. Agric. Food Chem.1978, 26,
809.
44. Šmilauer, P.; CanoDraw for Windows 4.1, Microcomputer Power: New York, 2003.
45. Cabin, R. J.; Mitchell, R. J.; Bull. Ecol. Soc. Am.2000, 81, 246.
Su
pp
le
m
enta
ry
Inf
or
m
ati
on
*e-mail: [email protected]
Environmental Inluence on Phenols and Essential Oils of
Myrciaria caulilora
Leaves
Alessandra R. Duarte,a Suzana C. Santos,a José C. Seraphinb and Pedro H. Ferri*,a
aLaboratório de Bioatividade Molecular, Instituto de Química, Universidade Federal de Goiás, CP 131, 74001-970 Goiânia-GO, Brazil
bNúcleo de Estatística Aplicada, Instituto de Matemática e Estatística, Universidade Federal de Goiás, CP 131, 74001-970 Goiânia-GO, Brazil
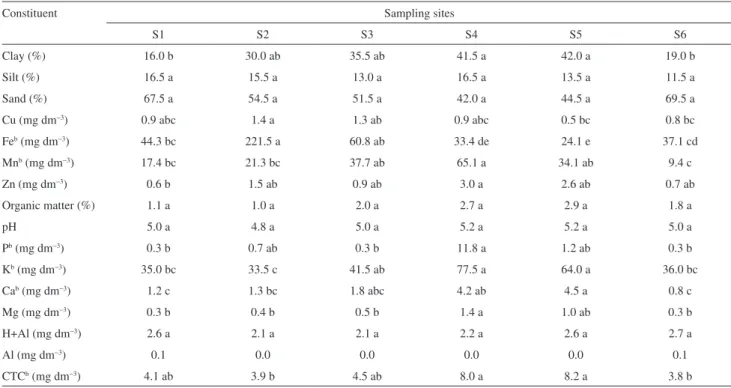
Table S1. Chemical characteristicsa of M. caulilora sampling sites
Constituent Sampling sites
S1 S2 S3 S4 S5 S6
Clay (%) 16.0 b 30.0 ab 35.5 ab 41.5 a 42.0 a 19.0 b
Silt (%) 16.5 a 15.5 a 13.0 a 16.5 a 13.5 a 11.5 a
Sand (%) 67.5 a 54.5 a 51.5 a 42.0 a 44.5 a 69.5 a
Cu (mg dm−3) 0.9 abc 1.4 a 1.3 ab 0.9 abc 0.5 bc 0.8 bc
Feb (mg dm−3) 44.3 bc 221.5 a 60.8 ab 33.4 de 24.1 e 37.1 cd
Mnb (mg dm−3) 17.4 bc 21.3 bc 37.7 ab 65.1 a 34.1 ab 9.4 c
Zn (mg dm−3) 0.6 b 1.5 ab 0.9 ab 3.0 a 2.6 ab 0.7 ab
Organic matter (%) 1.1 a 1.0 a 2.0 a 2.7 a 2.9 a 1.8 a
pH 5.0 a 4.8 a 5.0 a 5.2 a 5.2 a 5.0 a
Pb (mg dm−3) 0.3 b 0.7 ab 0.3 b 11.8 a 1.2 ab 0.3 b
Kb (mg dm−3) 35.0 bc 33.5 c 41.5 ab 77.5 a 64.0 a 36.0 bc
Cab (mg dm−3) 1.2 c 1.3 bc 1.8 abc 4.2 ab 4.5 a 0.8 c
Mg (mg dm−3) 0.3 b 0.4 b 0.5 b 1.4 a 1.0 ab 0.3 b
H+Al (mg dm−3) 2.6 a 2.1 a 2.1 a 2.2 a 2.6 a 2.7 a
Al (mg dm−3) 0.1 0.0 0.0 0.0 0.0 0.1
CTCb (mg dm−3) 4.1 ab 3.9 b 4.5 ab 8.0 a 8.2 a 3.8 b
a Average based on original data. b Rank-transformed in ANOVA analysis (see Experimental section). Averages followed by the same letter in the rows did
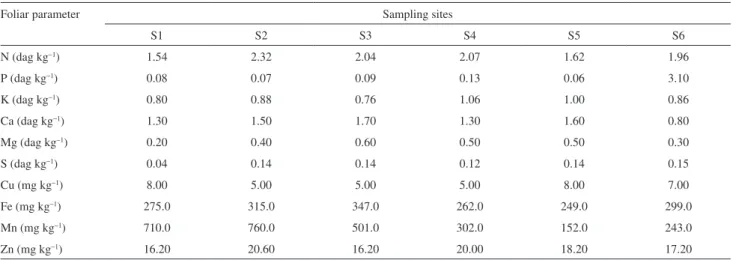
Table S2. Chemical characteristics of M. caulilora leaves from different sampling sites
Foliar parameter Sampling sites
S1 S2 S3 S4 S5 S6
N (dag kg−1) 1.54 2.32 2.04 2.07 1.62 1.96
P (dag kg−1) 0.08 0.07 0.09 0.13 0.06 3.10
K (dag kg−1) 0.80 0.88 0.76 1.06 1.00 0.86
Ca (dag kg−1) 1.30 1.50 1.70 1.30 1.60 0.80
Mg (dag kg−1) 0.20 0.40 0.60 0.50 0.50 0.30
S (dag kg−1) 0.04 0.14 0.14 0.12 0.14 0.15
Cu (mg kg−1) 8.00 5.00 5.00 5.00 8.00 7.00
Fe (mg kg−1) 275.0 315.0 347.0 262.0 249.0 299.0
Mn (mg kg−1) 710.0 760.0 501.0 302.0 152.0 243.0
Zn (mg kg−1) 16.20 20.60 16.20 20.00 18.20 17.20
Table S3. Accumulated percentagea of volatile constituents from M. caulilora leaves according to carbon skeletons
Carbon skeleton Sampling sites
S1 S2 S3 S4 S5 S6
Pinane 1.58 ab 2.43 a 1.98 ab 0.91 b 1.26 ab 1.98 ab
Menthaneb 1.02 ab 1.84 a 1.81 a 0.38 b 0.68 ab 1.69 a
Elemane 5.91 b 6.50 ab 6.74 ab 3.93 c 4.71 bc 7.87 a
Copaane 2.44 a 2.67 a 2.89 a 2.93 a 2.51 a 2.63 a
Bourbonane 1.56 a 1.77 a 1.69 a 0.22 c 0.75 bc 1.14 b
Caryophyllane 7.70 a 8.75 a 9.07 a 8.21 a 7.96 a 8.50 a
Guaianec 0.69 a 0.27 a 1.12 a 0.68 a 0.02 a 0.89 a
Humulaneb 1.30 ab 1.39 ab 1.54 a 1.35 ab 1.28 b 1.42 ab
Aromadendraneb 0.52 a 0.65 a 0.57 a 0.32 a 0.51 a 0.68 a
Germacrane 22.31 c 24.43 bc 26.31 b 29.80 a 28.58 ab 27.17 ab
Eudesmane 44.83 a 38.17 ab 35.37 b 38.75 ab 40.19 a 34.88 b
Bicyclogermacrane 6.41 b 6.86 b 7.16 ab 7.89 a 7.37 ab 7.71 ab
Cadinane 3.17 a 3.19 a 3.16 a 3.71 a 3.19 a 3.06 a
Eremophilane 0.56 a 1.09 a 0.58 a 0.93 a 0.98 a 0.37 a
Total 100.00 100.00 100.00 100.00 100.00 100.00
a Average based on original data. b Rank and c arcsine-transformed in ANOVA analysis (see Experimental section). Averages followed by the same letter
Table S4. Percentagesa and yields in essential oils and total phenol/tannin contents (mg g−1) of M. caulilora clustered samples
Constituent RIb Clustersc
I II III IV
1 α-Pinene 931 0.24 a 0.41 a t t
2 β-Pinene 975 1.32 a 1.71 a 0.89 a 1.25 a
3 Limonene 1026 0.53 ab 0.97 a 0.36 b 0.22 b
4 1,8-Cineole 1029 0.48 a 0.78 a t 0.45 a
5 δ-Elemened 1337 1.28 b 1.57 ab 1.70 a 1.54 ab
6 α-Copaened 1376 1.99 b 2.26 b 2.70 a 2.32 ab
7 β-Bourbonene 1385 1.54 a 1.51 a 0.22 b 0.74 b
8 Unknown (M = 204) 1390 0.37 a 0.74 a 0.91 a 0.80 a
9 β-Elemenee 1392 0.83 a 0.72 a 0.07 a 0.59 a
10 β-Caryophyllene 1421 7.55 a 8.60 a 8.13 a 7.92 a
11 β-Copaene 1429 0.41 a 0.41 a 0.20 a 0.18 a
12 6,9-Guaiadiene 1443 0.39 a 0.46 a 0.34 a t
13 α-Humulene 1454 1.27 a 1.42 a 1.33 a 1.28 a
14 allo-Aromadendrene 1461 0.51 ab 0.63 a 0.32 b 0.51 ab
15 Germacrene D 1484 20.48 c 23.27 b 27.20 a 26.83 a
16 δ-Selinene 1492 0.09 a 0.07 a 0.30 a t
17 Bicyclogermacrene 1498 6.29 b 7.09 a 7.82 a 7.33 a
18 α-Muurolene 1501 0.42 a 0.31 a 0.34 a 0.21 a
19 Germacrene Ae 1506 0.07 a 0.63 a 0.52 a t
20 δ-Cadinene 1524 2.69 b 2.77 b 3.32 a 2.96 ab
21 Elemol 1550 3.69 b 4.61 a 2.12 c 2.55 c
22 Germacrene Bd 1558 1.34 c 1.49 b 1.79 a 1.59 ab
23 Unknowne (M = 220) 1578 1.04 b 1.29 a 0.38 c 0.46 c
24 Guaiol 1601 0.29 a 0.24 a 0.32 a t
25 Eremoligenol 1630 0.54 a 0.70 a 0.91 a 0.97 a
26 γ-Eudesmol 1634 11.55 a 8.94 b 7.81 b 8.75 b
27 β-Eudesmol 1653 19.20 a 15.19 b 16.91 ab 17.46 ab
28 α-Eudesmold 1656 12.72 ab 10.66 b 12.41 ab 12.94 a
Monoterpenesd 2.57 ab 3.88 a 1.27 b 1.93 b
Monoterpene hydrocarbonsd 2.09 ab 3.09 a 1.26 b 1.48 b
Oxygenated monoterpenes 0.48 a 0.78 a t 0.45 a
Sesquiterpenes 96.54 ab 95.57 b 98.08 a 97.98 a
Sesquiterpene hydrocarbons 47.50 b 53.95 a 57.22 a 54.83 a
Oxygenated sesquiterpenes 49.04 a 41.63 b 40.86 b 43.15 b
Oil yield (%) 0.48 a 0.39 ab 0.29 ab 0.26 ab
Total phenols 136.68 a 128.68 b 79.69 d 111.77 c
Tannins 60.72 a 58.57 a 34.04 c 44.51 b
a Average based on original data. b Retention index. c I (site 1, n = 7); II (sites 2, 3 and 6, n = 18); III (site 4, n = 7); IV (site 5, n = 7). d Rank and e
Table S5. Chemical characteristicsa of M. caulilora clustered sampling sites
Soil parameter Clustered sampling sites
I II III IV
Clay (%) 16.0 c 28.2 b 28.2 b 42.0 a
Silt (%) 16.5 a 13.3 a 13.3 a 13.5 a
Sand (%) 67.5 a 58.5 a 58.5 a 44.5 a
Cu (mg dm-3) 0.9 ab 1.1 a 1.1 ab 0.5 b
Feb (mg dm-3) 44.3 ab 106.4 a 106.4 ab 24.1 b
Mn (mg dm-3) 17.4 b 22.8 b 22.8 a 34.1 ab
Zn (mg dm-3) 0.6 b 1.0 b 1.0 a 2.6 a
Organic matter (%) 1.1 b 1.6 ab 1.6 ab 2.9 a
pH 5.0 a 4.9 a 4.9 a 5.2 a
Pb (mg dm-3) 0.3 a 0.4 a 0.4 a 1.2 a
K (mg dm-3) 35.0 d 37.0 c 37.0 a 64.0 b
Ca (mg dm-3) 1.2 b 1.3 b 1.3 a 4.5 a
Mg (mg dm-3) 0.3 b 0.4 b 0.4 a 1.0 a
H+Al (mg dm-3) 2.6 a 2.3 a 2.3 a 2.6 a
Al (mg dm-3) 0.1 a 0.0 a 0.0 a 0.0 a
CTC (mg dm-3) 4.1 b 4.0 b 4.0 a 8.2 a
a Average based on original data. b Rank-transformed in ANOVA analysis (see Experimental section). Averages followed by the same letter in the rows did