Gene Expression Profile in the Long-Living
Lotus: Insights into the Heat Stress Response
Mechanism
Xiaojing Liu*☯, Fengfeng Du☯, Naiwei Li, Yajun Chang, Dongrui Yao *
Institute of Botany, Jiangsu Province and Chinese Academy of Sciences, Nanjing 210014, China
☯These authors contributed equally to this work.
*liuxiaojingcau@126.com(XL);shuishengzu@126.com(DY)
Abstract
Lotus (Nelumbo Adans) is an aquatic perennial plant that flourished during the middle Albian stage. In this study, we characterized the digital gene expression signatures for China Antique lotus under conditions of heat shock stress. Using RNA-seq technology, we sequenced four libraries, specifically, two biological replicates for control plant samples and two for heat stress samples. As a result, 6,528,866 to 8,771,183 clean reads were mapped to the reference genome, accounting for 92–96% total clean reads. A total of 396 signifi-cantly altered genes were detected across the genome, among which 315 were upregu-lated and 81 were downreguupregu-lated by heat shock stress. Gene ontology (GO) enrichment of differentially expressed genes revealed protein folding, cell morphogenesis and cellular component morphogenesis as the top three functional terms under heat shock stress. Kyoto Encyclopedia of Genes and Genomes (KEGG) analysis led to the identification of protein processing in endoplasmic reticulum, plant-pathogen interactions, spliceosome, endocytosis, and protein export as significantly enriched pathways. Among the upregulated genes, small heat shock proteins (sHsps) and genes related to cell morphogenesis were particularly abundant under heat stress. Data from the current study provide valuable clues that may help elucidate the molecular events underlying heat stress response in China Antique lotus.
Introduction
Changes in temperature especially heat shock will inevitably affect plant performance, the moisture distribution and biomass of plants, in particular, aquatic plants. More than 200 mil-lion years ago, extremely high temperatures drove most Early Triassic plants and animals away from the equator, and probably constituted the major cause of the end-Permian mass extinc-tion [1]. Heat stress is currently considered the major abiotic stress in many areas worldwide. More focus on the heat tolerance of plants is therefore essential. Elucidation of the relationship between excessive temperatures and cellular response is an important step for optimization of thermotolerance in aquatic plants.
a11111
OPEN ACCESS
Citation:Liu X, Du F, Li N, Chang Y, Yao D (2016) Gene Expression Profile in the Long-Living Lotus: Insights into the Heat Stress Response Mechanism. PLoS ONE 11(3): e0152540. doi:10.1371/journal. pone.0152540
Editor:Xiang Jia Min, Youngstown State University, UNITED STATES
Received:January 31, 2016
Accepted:March 15, 2016
Published:March 28, 2016
Copyright:© 2016 Liu et al. This is an open access article distributed under the terms of theCreative Commons Attribution License, which permits unrestricted use, distribution, and reproduction in any medium, provided the original author and source are credited.
Data Availability Statement:All relevant data are within the paper and its Supporting Information files.
Funding:The National Natural Science Foundation of China, Grant No.31400604,http://www.nsfc.gov.cn/
Lotus (Nelumbo Adans) is a family of aquatic perennial plants that flourished during the middle Albian period [2]. Areas in north-eastern China provided an important refuge for sur-vival of the lotus species during the Quaternary glaciation era [3]. Only two remaining species have survived from the late Cretaceous, specifically,N.nuciferaGaertn. andN.luteaWild [4].
N.nuciferais mainly distributed and cultivated in Asia and north Oceania whileN.luteais native to North America. In Asia, the lotus has been cultivated as food for over 7,000 years, and grows in a wide range of climatic zones in China from longitudes of E86° to 133° and latitudes of N18° to 48° [5].
One of the oldest surviving flora, the lotus is a land plant that has adapted to aquatic envi-ronments. Unlike the well-characterized model plants, lotus is considered the ancestor of eudi-cots, and lies outside of the core eudicots [6]. Significant progress has been made in identifying heat-regulated genes and the related pathways inArabidopsis, rice, maize and wheat [7]. How-ever, limited information on the genes and pathways activated in lotus experiencing heat stress conditions is currently available. The lotus seed is extremely tolerant to heat stress, with 13.5% seeds germinating after treatment at 100°C for 24 h, which is destructive to maize seeds [8]. In addition, embryo axes and cotyledons of lotus show heat-hardiness [9]. However, the pathways contributing to the heat response mechanism in long-living lotus remain to be clarified.
Here, we analyzed the gene expression profile of China Antique lotus under conditions of 37°C heat treatment using RNA-seq. Numerous differentially and specifically expressed tran-scripts of heat-regulated genes were identified. Expression patterns of candidate genes were further validated using quantitative real-time PCR (qRT-PCR). Our results should aid in eluci-dating the molecular events underlying the heat stress response in China Antique lotus and provide valuable resources for genetic studies on abiotic stress in lotus.
Materials and Methods
Sampling
The seed of‘China Antique’lotus (over 1000 years old) was initially identified in northeastern China. Vegetatively propagated lotus root was donated by Nanjing Yileen Flower Company. Plants were cultivated in a greenhouse for one month in the Institute of Botany, Jiangsu prov-ince and Chinese academy of Sciences. Lotus plants were used as experimental materials. Con-trol plants were cultivated in a growth chamber under continuous light (160–180μm sec-1m-2)
at 22°C. For heat shock treatment, plants were transferred to 37°C for 1 h under the same light source. Fresh samples of young leaves above water were collected and frozen in liquid nitrogen for further analysis.
RNA extraction and library preparation for RNA-seq
Total RNA was isolated using TRIzol reagent (Invitrogen, Carlsbad, CA). A total of 3μg RNA
per sample was used as input material. Sequencing libraries were generated using the NEB-Next1
Ultra™RNA Library Prep Kit for Illumina1
(NEB, USA) following the manufacturer’s recommendations. Briefly, mRNA was purified from total RNA using poly-T oligo-attached magnetic beads. Fragmentation was performed using divalent cations under elevated tempera-ture. First-strand cDNA was synthesized with random hexamer primer and M-MuLV reverse transcriptase. Second-strand cDNA synthesis was subsequently performed using DNA Poly-merase I and RNase H. Remaining overhangs were converted into blunt ends via exonuclease/ polymerase activities. After adenylation of 3’ends of DNA fragments, NEBNext adaptor with a hairpin loop structure was ligated to prepare for hybridization. To preferentially select cDNA fragments 150–200 bp in length, library fragments were purified with the AMPure XP system (Beckman Coulter, Beverly, USA). Next, 3μl USER Enzyme (NEB, USA) was incubated with
size-selected, adaptor-ligated cDNA at 37°C for 15 min, followed by 5 min at 95°C before PCR. Amplification was performed with Phusion High-Fidelity DNA polymerase, universal PCR primers and index (X) primer. PCR products were subsequently purified (AMPure XP system), and the library quality assessed on the Agilent Bioanalyzer 2100 system.
The clustering of the index-coded samples was performed on a cBot Cluster generation sys-tem using TruSeq PE Cluster Kit v3-cBot-HS (Illumina) according to the manufacturer’s instructions. Following cluster generation, library preparations were sequenced on an Illumina 2500 platform and 50 bp single-end reads generated. The raw data are available in NCBI Sequence Read Archive (SRA,http://www.ncbi.nlm.nih.gov/Traces/sra) with accession number SRP070871.
Analysis and mapping of RNA-seq reads
Raw data in the Fastq format were initially processed through in-house perl scripts. In this step, clean reads were obtained by removing reads containing adapters, empty reads or reads with unknown sequences‘N’from raw data. Simultaneously, Q20 and GC contents were calcu-lated from clean data. All downstream analyses were based on high-quality, clean data. Refer-ence genome and gene model annotation files were downloaded directly from the genome website (http://www.ncbi.nlm.nih.gov/genome/genomes/14095). An index of the reference genome was built using Bowtie v2.0.6, and single-end clean reads aligned to the reference genome using TopHat v2.0.9.
Differential expression analysis
HTSeq v0.5.4p3 was employed to count read numbers mapped to each gene. Reads per Kilo-base per Million mapped Reads (RPKM) of individual genes were calculated Kilo-based on gene length and read counts mapped to each gene. Differential expression analysis was performed using the DESeq R package (1.10.1). The resultingP-values were adjusted using the Benjamini and Hochberg’s approach for controlling the false discovery rate. Genes with adjustedP-values
<0.05 determined using DESeq were assigned as‘differentially expressed’.
GO and KEGG enrichment analysis of differentially expressed genes
Gene Ontology (GO) enrichment analysis of differentially expressed genes was implemented using the GOseq R package, correcting for gene length bias [10]. GO terms with correctedP
values less than 0.05 were considered significantly enriched by differentially expressed genes. For KEGG pathways analysis, we used KOBAS software to determine the statistical enrichment of differentially expressed genes [11–12].
Quantitative real-time PCR analysis
Quantitative real-time PCR analysis was used to validate gene expression patterns. Under heat stress treatment (37°C), fresh samples of stems and leaves above water were collected at various time-points (0, 0.5, 1, 3, 6 h). Total RNA (1μg) was used to synthesize cDNA with random
primer pd (N)9. The genes and primer pairs for real-time PCR analysis are listed in Table A in
Results
Sequencing of China Antique lotus
Illumina single-end sequencing technology was used to generate digital expression signatures for China Antique lotus under heat shock stress. Using RNA-seq technology, we sequenced four libraries, specifically, two biological replicates for control plant samples under 23°C (C1, C2) and two for heat stress samples treated for 1 h at 37°C after transfer (H1, H2). In total, the four libraries generated between 7.1 and 9.2 million raw reads. After removing reads containing adapters or poly-N and low quality reads, the total number of clean reads per library ranged from 7.1 to 9.1 million. Simultaneously, Q20 and GC contents of clean data were calculated. The Q20 values were>98% and GC content was relatively stable at ~46%, indicating the high
quality of the sequencing libraries (Table 1).
Mapping sequences to the
Nelumbo nucifera
reference genome
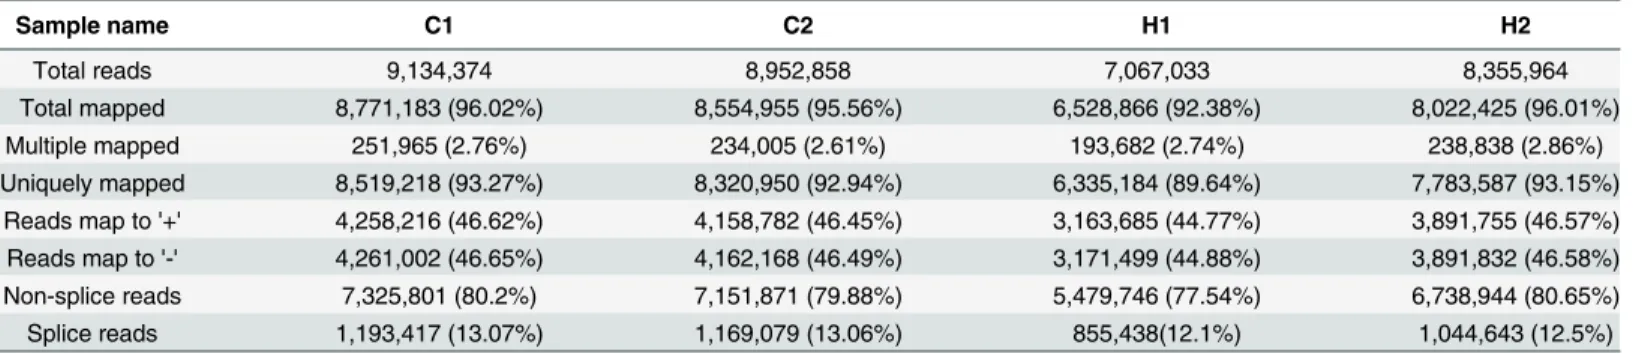
To reveal the molecular events associated with RNA-seq data, single-end clean reads were aligned to theNelumbo nuciferareference genome (http://www.ncbi.nlm.nih.gov/genome/ genomes/14095) using TopHat. Compared with the non-splice mapping tool, TopHat usually obtains better results for the generation of a splice junction database based on gene model annotation. Consequently, 6,528,866 to 8,771,183 clean reads were mapped to the reference genome (Table 2), accounting for 92% to 96% of the total clean reads. Only 4–8% of total reads could not be mapped to theNelumbo nuciferagenome. These tags may represent regions where the references are incomplete.
Among the mapped reads, mapping ratios to exon, intron and intergenic regions were cal-culated. Over 94% reads could be mapped to the exon regions. Reads mapped to the intron regions (2.30% to 2.5%) were most likely derived from residue of pre-mRNA or stranded Table 1. Sequence statistics ofNelumbo nuciferaunder heat stress.
Sample name Rawreads Clean reads clean bases Error rate(%) Q20(%) Q30(%) GC content(%)
C1 9,209,534 9,134,374 0.46G 0.01 98.78 96.05 46.2
C2 9,078,297 8,952,858 0.45G 0.01 98.77 96.03 46.19
H1 7,133,967 7,067,033 0.35G 0.01 98.75 95.91 46.95
H2 8,430,780 8,355,964 0.42G 0.01 98.79 96.07 46.29
Q20, Q30: 20, 30 are Phred scores; Qphred = -10log10(e); Q20 and Q30 represent sequencing error rates of 0.01 and 0.001, respectively.
doi:10.1371/journal.pone.0152540.t001
Table 2. Summary of statistics for mapping reads to theNelumbo nuciferagenome.
Sample name C1 C2 H1 H2
Total reads 9,134,374 8,952,858 7,067,033 8,355,964
Total mapped 8,771,183 (96.02%) 8,554,955 (95.56%) 6,528,866 (92.38%) 8,022,425 (96.01%)
Multiple mapped 251,965 (2.76%) 234,005 (2.61%) 193,682 (2.74%) 238,838 (2.86%)
Uniquely mapped 8,519,218 (93.27%) 8,320,950 (92.94%) 6,335,184 (89.64%) 7,783,587 (93.15%) Reads map to '+' 4,258,216 (46.62%) 4,158,782 (46.45%) 3,163,685 (44.77%) 3,891,755 (46.57%) Reads map to '-' 4,261,002 (46.65%) 4,162,168 (46.49%) 3,171,499 (44.88%) 3,891,832 (46.58%) Non-splice reads 7,325,801 (80.2%) 7,151,871 (79.88%) 5,479,746 (77.54%) 6,738,944 (80.65%)
Splice reads 1,193,417 (13.07%) 1,169,079 (13.06%) 855,438(12.1%) 1,044,643 (12.5%)
introns in the alternative splicing process. Approximately 3% reads were mapped to intergenic regions, probably owing to incomplete annotation of the genome (Fig A inS1 File).
The gene expression levels were estimated based on RPKM values [13]. The normalized final counts are summarized in Table B inS1 File, and RPKM density distribution in Fig B in
S1 File. Only a small number of genes displayed relatively high expression, and over 75% genes had fewer than 15 reads. To evaluate the quality of RNA-seq data, analysis of the mean cover-age of gene distribution was performed. As shown in Fig C inS1 File, all the libraries showed bell-shaped distribution from 5’to 3’and were highly normalized. In addition, relatively high correlation was observed between biological replicates, with Pearson correlation values of 0.96 and 0.94 for control and heat stress treatments, respectively (Fig D inS1 File).
Analysis of differential gene expression
To compare gene expression profiles of heat shock-exposed and control plants, DEseq was applied for differential gene expression analysis [14]. Genes with an adjustedP-value<0.05
were categorized as differentially expressed. A total of 396 genes with significant alterations were detected across the genome, among which 315 were upregulated while 81 were downregu-lated by heat shock stress (Fig 1). To evaluate the genome-wide expression profiles between control and heat-treated plants, we performed linkage hierarchical clustering using
Fig 1. Volcano plot of differentially expressed genes under heat stress inNelumbo nucifera.To eliminate biological variation of DESeq, screening criterion for differentially expressed genes is Padj<0.05. Log2 Ratio, log fold changes using the ratio base 2 logarithm.
comparative data (Fig E inS1 File). The cluster indicated that some gene transcripts were in high abundance under both heat treatment and control conditions, while others display spe-cific expression changes by heat stress.
Gene Ontology enrichment
To functionally classify the genes affected by heat shock stress, Gene Ontology (GO) enrich-ment of differentially expressed genes were investigated. Based on Wallenius non-central hyper-geometric distribution, genes were categorized using GOseq software [15]. As a result, 296 (74.74%) differentially expressed genes were annotated, and 11 specific terms were signifi-cantly enriched (correctedP-value<0.05) in two main categories: biological process and
molecular function. Notably, protein folding (GO:0006457), cell morphogenesis (GO:0000902) and cellular component morphogenesis (GO:0032989) were identified as the top three terms under heat shock stress (Fig 2, Table C inS1 File). TopGO analysis indicated that protein fold-ing and cell morphogenesis were the most important biological processes (Fig F inS1 File),
Fig 2. Histogram of Gene Ontology (GO) classification using GOseq.GO terms with corrected P-values<0.05 were considered significantly enriched for differentially expressed genes.
while specific enrichment of unfolded protein binding and chaperone binding were observed for molecular function (Fig G inS1 File).
Metabolic pathway analysis of differentially expressed genes using
KEGG
To further determine the biological functions of differentially expressed genes, we mapped these genes to terms in the KEGG database. Among the mapped pathways, four were signifi-cantly enriched (CorrectedP-value0.05) under heat shock stress. Notably, protein processing in endoplasmic reticulum, plant-pathogen interaction, spliceosome, endocytosis, and protein export pathways were specifically enriched (Fig 3). Detailed information on the protein process-ing in endoplasmic reticulum pathway in the KEGG database indicated that ER-associated deg-radation and ubiquitin ligase complex are markedly affected by heat stress (Fig H inS1 File).
Fig 3. Scatter plot showing enrichment of differentially expressed genes (DEG) with KEGG classification.Pathways with q values0.05 were significantly enriched in DEGs.
Heat-shock proteins and molecular chaperones in China Antique lotus
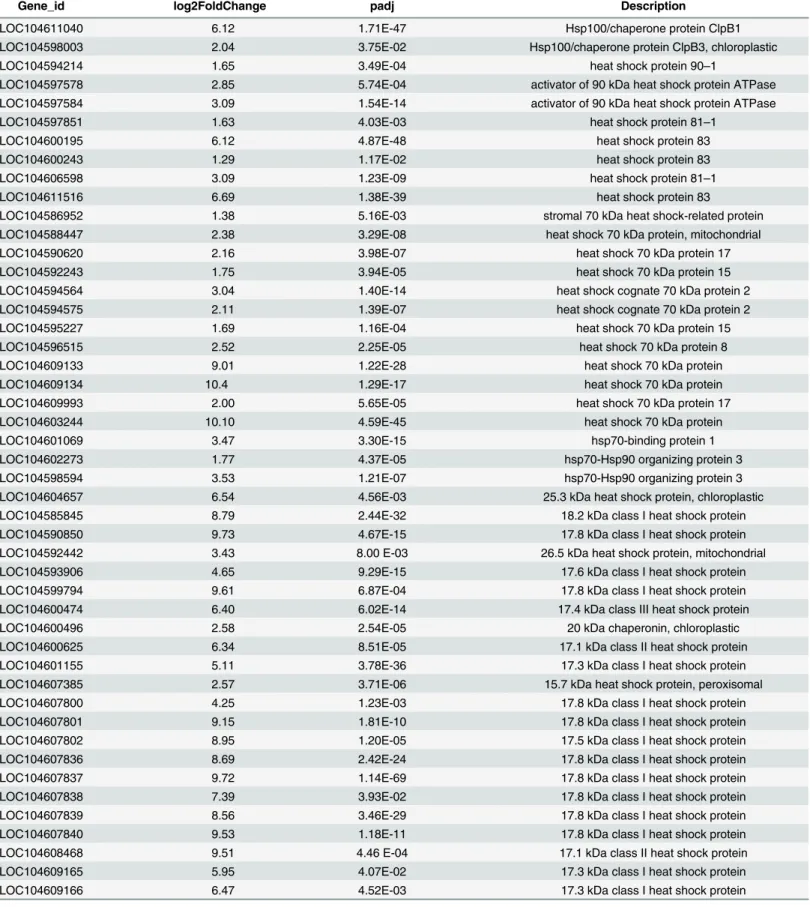
In plants, Hsps/chaperones responsible for the events of protein folding, assembly, transloca-tion and degradatransloca-tion play a crucial role in heat stress [7]. Data from this study revealed upregu-lation of heat-shock proteins and molecular chaperones under conditions of heat stress in lotus. As shown inTable 3, a total of 74 Hsps/chaperones were identified, including Hsp100 (Clp), Hsp90, Hsp70, chaperones (Hsp60) and small Hsp (sHsp) family members. Among these, 27 genes belonged to the sHsp family, accounting for 36.49% of the Hsps/chaperones identified. In terms of gene expression levels, 57.69% Hsps/chaperones were more than 3-fold increased under heat stress. Remarkably, 13 sHsps (nearly 50%) showed greater than 7-fold increased expression, indicating an important role in protein processing in lotus (Table 3).
Cell morphogenesis-related genes in China Antique lotus
We identified 19 genes related to cell morphogenesis and cellular component morphogenesis that were significantly induced by heat stress, including cell wall structural genes, xyloglucan related genes, transmembrane genes, aquaporins, extensins and lipid transfer genes. Four xylo-glucan-related genes (LOC104591922, LOC104599119, LOC104607928, LOC104591734) were identified as heat-inducible, supporting a critical role of cell wall remodeling under conditions of heat stress inNelumbo nucifera. Increased expression of three aquaporins (LOC104603647, LOC104594630, LOC104604560) was additionally observed, indicating positive roles during the early stages of heat stress in lotus (Table 4).
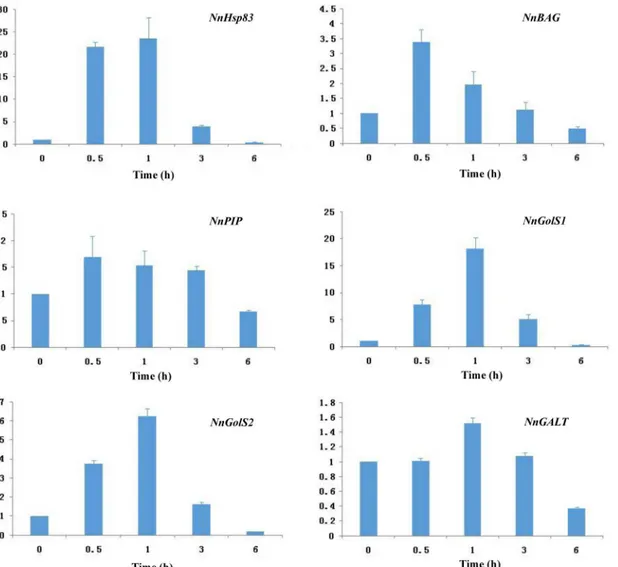
Quantitative real-time PCR data
To validate RNA-seq data, expression patterns of candidate genes were further analyzed using quantitative qRT-PCR. As shown inFig 4,NnHsp83,NnBAG,NnPIP,NnGolSs,NnGALTwere upregulated by heat stress, but the induction patterns varied among those genes. Generally, the findings were consistent with RNA-seq results. As verified by qRT-PCR, twoNnGolSgenes were significantly induced by heat stress, with an expression peak at 1 h, indicating a fast-acting role of raffinose biosynthesis under heat stress (Fig 4).
Discussion
Analysis of differentially expressed genes
Response to heat stress is a complex phenomenon involving extensive gene expression changes in plants [7]. Under heat shock stress, the number of induced genes is 3–6 times more than the number of repressed genes in maize, barley, wheat and rice [16–19]. Following long-term heat stress over 6 h, the proportions of heat-induced and suppressed genes were similar, with the number of upregulated genes being slightly lower than that of downregulated genes [17,20–
21]. In this study, we focused on the response of lotus to heat shock stress. Overall, 396 genes were differentially expressed under heat stress conditions in lotus, with a 3.89 times greater number of upregulated than downregulated genes. The results indicate that the rapid response of lotus to heat shock stress shares similar characteristics with that of specific land plants. How-ever, ~23.74% of the differentially expressed genes remained uncharacterized, since no homo-logs have been identified in the NCBI database. Some of these genes may represent novel heat-responsive transcripts unique to aquatic plants.
Roles of Hsps and chaperones in heat response
Table 3. HSPs and molecular chaperones upregulated by heat stress inNelumbo nucifera.
Gene_id log2FoldChange padj Description
LOC104611040 6.12 1.71E-47 Hsp100/chaperone protein ClpB1
LOC104598003 2.04 3.75E-02 Hsp100/chaperone protein ClpB3, chloroplastic
LOC104594214 1.65 3.49E-04 heat shock protein 90–1
LOC104597578 2.85 5.74E-04 activator of 90 kDa heat shock protein ATPase
LOC104597584 3.09 1.54E-14 activator of 90 kDa heat shock protein ATPase
LOC104597851 1.63 4.03E-03 heat shock protein 81–1
LOC104600195 6.12 4.87E-48 heat shock protein 83
LOC104600243 1.29 1.17E-02 heat shock protein 83
LOC104606598 3.09 1.23E-09 heat shock protein 81–1
LOC104611516 6.69 1.38E-39 heat shock protein 83
LOC104586952 1.38 5.16E-03 stromal 70 kDa heat shock-related protein
LOC104588447 2.38 3.29E-08 heat shock 70 kDa protein, mitochondrial
LOC104590620 2.16 3.98E-07 heat shock 70 kDa protein 17
LOC104592243 1.75 3.94E-05 heat shock 70 kDa protein 15
LOC104594564 3.04 1.40E-14 heat shock cognate 70 kDa protein 2
LOC104594575 2.11 1.39E-07 heat shock cognate 70 kDa protein 2
LOC104595227 1.69 1.16E-04 heat shock 70 kDa protein 15
LOC104596515 2.52 2.25E-05 heat shock 70 kDa protein 8
LOC104609133 9.01 1.22E-28 heat shock 70 kDa protein
LOC104609134 10.4 1.29E-17 heat shock 70 kDa protein
LOC104609993 2.00 5.65E-05 heat shock 70 kDa protein 17
LOC104603244 10.10 4.59E-45 heat shock 70 kDa protein
LOC104601069 3.47 3.30E-15 hsp70-binding protein 1
LOC104602273 1.77 4.37E-05 hsp70-Hsp90 organizing protein 3
LOC104598594 3.53 1.21E-07 hsp70-Hsp90 organizing protein 3
LOC104604657 6.54 4.56E-03 25.3 kDa heat shock protein, chloroplastic
LOC104585845 8.79 2.44E-32 18.2 kDa class I heat shock protein
LOC104590850 9.73 4.67E-15 17.8 kDa class I heat shock protein
LOC104592442 3.43 8.00 E-03 26.5 kDa heat shock protein, mitochondrial
LOC104593906 4.65 9.29E-15 17.6 kDa class I heat shock protein
LOC104599794 9.61 6.87E-04 17.8 kDa class I heat shock protein
LOC104600474 6.40 6.02E-14 17.4 kDa class III heat shock protein
LOC104600496 2.58 2.54E-05 20 kDa chaperonin, chloroplastic
LOC104600625 6.34 8.51E-05 17.1 kDa class II heat shock protein
LOC104601155 5.11 3.78E-36 17.3 kDa class I heat shock protein
LOC104607385 2.57 3.71E-06 15.7 kDa heat shock protein, peroxisomal
LOC104607800 4.25 1.23E-03 17.8 kDa class I heat shock protein
LOC104607801 9.15 1.81E-10 17.8 kDa class I heat shock protein
LOC104607802 8.95 1.20E-05 17.5 kDa class I heat shock protein
LOC104607836 8.69 2.42E-24 17.8 kDa class I heat shock protein
LOC104607837 9.72 1.14E-69 17.8 kDa class I heat shock protein
LOC104607838 7.39 3.93E-02 17.8 kDa class I heat shock protein
LOC104607839 8.56 3.46E-29 17.8 kDa class I heat shock protein
LOC104607840 9.53 1.18E-11 17.8 kDa class I heat shock protein
LOC104608468 9.51 4.46 E-04 17.1 kDa class II heat shock protein
LOC104609165 5.95 4.07E-02 17.3 kDa class I heat shock protein
LOC104609166 6.47 4.52E-03 17.3 kDa class I heat shock protein
play a crucial role in maintaining cellular homeostasis and functional conformation, and some Hsps/chaperones are correlated with acquisition of thermotolerance inArabidopsis[16,22]. In this study, 74 Hsps/chaperones were identified in China Antique lotus, among which sHsps constituted the largest subfamily induced by heat stress.
sHsps are low molecular mass Hsps of 12–40 kDa [22]. Among the five families of Hsps, sHsps are the most prevalent in terms of cellular location with diverse functions in plants [23–
24]. sHsps generally function as molecular chaperones through binding, stabilizing and pre-venting non-native aggregation, facilitating subsequent refolding [25–27]. InArabidopsis, around 13 sHsps have been identified [22], with some playing a non-redundant role in acquired thermotolerance [28]. In tobacco, chloroplast-localized sHsp protects photosystem II to ensure survival under heat stress conditions [29], and overexpression of mitochondrial sHsp has been shown to significantly enhance thermotolerance in tobacco [30]. Wang and co-work-ers (2004) revealed that accumulation of sHsp is strongly correlated with plant thermotoler-ance inArabidopsis. In China Antique lotus, 27 sHsps were significantly elevated by heat stress, representing twice the number of sHsps, relative toArabidopsis. In terms of cellular loca-tion, sHsps accumulating under heat stress conditions in lotus were predicted as chloroplastic, Table 3. (Continued)
Gene_id log2FoldChange padj Description
LOC104609367 8.28 5.46E-18 17.1 kDa class II heat shock protein
LOC104604658 3.28 2.44 E-03 17.8 kDa class I heat shock protein
LOC104592981 4.99 7.08E-04 small heat shock protein, chloroplastic
LOC104598537 6.86 2.74E-08 small heat shock protein, chloroplastic
LOC104602326 8.19 7.25E-21 small heat shock protein, chloroplastic
LOC104602123 1.88 7.48E-06 chaperonin CPN60-2, mitochondrial
LOC104587652 2.38 2.38E-09 chaperonin CPN60-2, mitochondrial
LOC104600478 1.93 7.68E-06 chaperone protein dnaJ 6
LOC104608050 2.67 1.12E-10 dnaJ homolog subfamily B member 1
LOC104609916 4.45 1.63E-03 dnaJ homolog subfamily B member 8
LOC104585999 1.86 1.48E-04 chaperone protein dnaJ 1, mitochondrial
LOC104589095 3.17 2.15E-15 dnaJ homolog subfamily B member 13
LOC104594942 2.47 2.21E-03 dnaJ protein ERDJ3A
LOC104605116 3.08 6.29E-11 dnaJ protein ERDJ3B
LOC104602647 2.05 8.17E-06 dnaJ protein P58IPK homolog
LOC104598847 2.52 8.24E-04 dnaJ homolog subfamily B member 3
LOC104599473 2.21 6.02E-07 dnaJ homolog subfamily B member 1
LOC104605136 4.04 3.81E-04 dnaJ homolog subfamily B member 3
LOC104601430 1.50 9.22E-04 dnaJ protein
LOC104601432 2.81 3.14E-13 dnaJ protein
LOC104606412 1.60 5.21E-04 20 kDa chaperonin, chloroplastic
LOC104600655 3.77 7.96E-22 10 kDa chaperonin
LOC104600279 6.64 4.41E-04 BAG family molecular chaperone regulator 6
LOC104594149 2.34 2.22 E-04 BAG family molecular chaperone regulator 5, mitochondrial
LOC104595069 4.87 2.27E-18 T-complex protein 1 subunit gamma
LOC104591565 1.44 2.44 E-03 T-complex protein 1 subunit epsilon
LOC104601564 1.23 3.02 E-02 T-complex protein 1 subunit zeta
Screening criteria for upregulated genes (DEGs):Padj<0.05. Log2 Ratio, log fold changes using the ratio base 2 logarithm.
mitochondrial and peroxisomal. The abundance and diversity of sHsps in lotus suggests an important role in acquired thermotolerance.
Hsp70 chaperones, together with co-chaperones (e.g., DnaJ/Hsp40), assist in a range of pro-tein folding processes [22]. InArabidopsis, at least 18 genes encoding members of the Hsp70 family have been identified. Some members are significantly induced by heat stress, as observed using expression profile analysis [31–32]. Hsp70 interacts directly with DnaJ/Hsp40 cochaper-ones and unfolded proteins to regulate interactions, thereby correcting protein folding in Ara-bidopsis[33–35]. In this study, 12 genes encoding Hsp70 and 12 encoding DnaJ members were significantly induced by heat stress. In view of these results, it is reasonable to suggest that Hsp70 interacts with DnaJ/Hsp40 cochaperones to facilitate correct protein folding under heat stress in lotus, potentially playing a positive role in acquisition of thermotolerance.
Recent studies have shown that HSP70 proteins interact directly with Bcl-2-associated atha-nogene (BAG) proteins and modulate their activity under heat stress [36]. Seven members of theArabidopsisBAG protein family have been identified to date. Among these, AtBAG6 is sig-nificantly induced by heat stress and AtBAG7 interacts directly with AtBiP2 proteins to regu-late their activity under heat stress [36]. In lotus, two BAG family genes were identified as heat-inducible genes, and one mitochondrial BAG gene was predicted to be a homolog ofAtBAG5, an ancient BAG gene in plants. However, the interactions between the BAG family and Hsp70 in lotus require further experimental research.
Expression analysis of genes related to cell morphogenesis
In general, genes related to cell growth, expansion and cell wall biosynthesis are repressed by heat stress, signifying a negative effect of heat stress on cell physiology in plants. InArabidopsis
shoots and barley caryopses, downregulation of genes related to extensins, cell membrane, lipid binding and dehydrin is commonly observed as a result of cellular damage under heat stress Table 4. Proteins related to cellular morphogenesis upregulated by heat stress inNelumbo nucifera.
Gene_id log2FoldChange padj Description Subcellular prediction
LOC104587372 2.05 1.45E-02 glycine-rich cell wall structural protein
-LOC104610879 2.82 5.88E-04 transmembrane protein Vacuole
LOC104603094 1.74 8.42E-05 transmembrane protein Nucleus
LOC104605640 2.49 3.68E-02 secretory carrier-associated membrane protein Plasma membrane
LOC104608147 2.58 1.98E-02 extensin-2 Nucleus
LOC104608452 3.73 1.99E-04 extensin-2 Secreted
LOC104602657 1.80 1.83E-02 tetraspanin-6 Plasma membrane
LOC104607928 1.30 2.62E-02 protein altered xyloglucan 4 Cytoplasm, Secreted
LOC104591922 1.80 1.03E-04 xyloglucan endotransglucosylase/hydrolase protein Secreted LOC104599119 3.59 6.13E-05 xyloglucan endotransglucosylase/hydrolase protein Secreted
LOC104591734 1.79 4.36E-02 glucuronoxylan 4-O-methyltransferase Nucleus
LOC104593176 1.74 1.92E-03 Polygalacturonase Secreted
LOC104594630 1.50 1.13E-03 aquaporin TIP1-3 Chloroplast
LOC104603647 1.56 4.23E-04 aquaporin PIP2-7 Plasma membrane
LOC104604560 1.71 8.43E-05 aquaporin TIP1-1 Cytoplasm, Membrane
LOC104597663 4.31 1.93E-12 lipid-transfer protein Secreted
LOC104607503 1.39 7.23E-03 1-acylglycerol-3-phosphate O-acyltransferase Nucleus
Screening criterion for upregulated genes (DEGs):Padj<0.05. Log2 Ratio, log fold changes using the ratio base 2 logarithm. The subcellular locations were predicted from The Plant Secretome and Subcellular Proteome KnowledgeBase (http://bioinformatics.ysu.edu/secretomes/plant/index.php).
[17,37]. In contrast, genes related to cell morphogenesis were rapidly induced under heat stress after only 1 h in China Antique lotus. Examples of elevated genes included extensins, cell wall structural genes, xyloglucan-related genes and lipid transfer genes (Table 4). Upregulation of these genes may be critical for cell remodeling, growth and expansion under heat stress. More-over, levels of twoTIPsand onePIPwere upregulated in lotus, indicating an active role in rapid water uptake and transportation under heat stress. Positive expression of aquaporin genes have been reported in rice, with constitutive upregulation ofOsNIP2;1andOsTIP1;2
genes during heat stress [19,38]. The rapid induction of genes related to cell morphogenesis in China Antique lotus may facilitate re-establishing of the cellular balance to cope with heat stress. Based on the collective findings, we propose that stabilization and maintenance of cell morphogenesis and physiology contribute to acquired thermotolerance in lotus.
Conclusions
In this study, we characterized the digital gene expression signatures for China Antique lotus under heat shock stress conditions, leading to the identification of significantly enriched Fig 4. Analysis of genes upregulated by heat stress inNelumbo nuciferausing quantitative RT-PCR.18s rRNA was used for normalization.
pathways and a number of candidate genes involved in heat stress response. Data from this study provide valuable clues that may aid in understanding the molecular events underlying response to heat stress in China Antique lotus.
Supporting Information
S1 File. Supporting tables and ures.
(PDF)
Acknowledgments
Authors acknowledge the helpful scientific guidance from Dr. Qiang Wei of Department of Molecular Physiology and Biophysics, Center for Human Genetics Research, Vanderbilt Uni-versity, for kind help with bioinformatics analysis.
Author Contributions
Conceived and designed the experiments: XJL DRY. Performed the experiments: FFD XJL. Analyzed the data: NWL YJC. Contributed reagents/materials/analysis tools: FFD NWL. Wrote the paper: DRY XJL. Drafted the manuscript: FFD.
References
1. Sun YD, Joachimski MM, Wignall PB, Yan CB, Chen YL, Jiang HS, et al. Lethally hot temperatures dur-ing the Early Triassic greenhouse. Science. 2012; 338: 366–370. doi:10.1126/science.1224126
PMID:23087244
2. Wu ZH, Gui ST, Quan ZW, Pan L, Wang SZ, Ke WD, et al. A precise chloroplast genome ofNelumbo nucifera(Nelumbonaceae) evaluated with Sanger, Illumina MiSeq, and PacBio RS II sequencing plat-forms: insight into the plastid evolution of basal eudicots. BMC Plant Biology. 2014; 14: 289. doi:10. 1186/s12870-014-0289-0PMID:25407166
3. Li JK, Zhou EX, Li DX, Huang SQ. Multiple northern refugia for Asian sacred lotus, an aquatic plant with characteristics of ice-age endurance. Australian Journal of Botany. 2010; 58: 463–472.
4. Shen-Miller J. Sacred lotus, the long-living fruits of China Antique. Seed Science Research. 2002; 12: 131–143.
5. Huang GH. Classification and geographic distribution ofNelumbo nucifera. in China Wuhan Institute of Botany (Eds) China lotus. Beijing, Academia Sinica, Science Publishers (in Chinese); 1987. pp. 9–12. 6. Ming R, VanBuren R, Liu YL, Yang M, Han YP, Li LT, et al. Genome of the long-living sacred lotus
(Nelumbo nuciferaGaertn.). Genome Biol. 2013; 14: 41.
7. Kotak S, Larkindale J, Lee U, Koskull-Döring PV, Vierling E, Scharf KD. Complexity of the heat stress response in plants. Current opinion in Plant Biology. 2007; 10: 310–316. PMID:17482504
8. Ding YF, Cheng HY, Song SQ. Changes in extreme high-temperature tolerance and activities of antiox-idant enzymes of sacred lotus seeds. Science in China (Series C: Life Sciences). 2008; 51: 842–853. 9. Shen-Miller J, Schopf JW, Harbottle G, Cao RJ, Ouyang S, Zhou KS, et al. Long-living sacred lotus:
Germination and soilγ-irradiation of centuries-old fruits, and cultivation, growth, and phenotypic
abnor-malities of offspring. Am. J. Bot. 2002; 89: 236–247. doi:10.3732/ajb.89.2.236PMID:21669732 10. Young MD, Wakefield MJ, Smyth GK, Oshlack A. Gene ontology analysis for RNA-seq: accounting for
selection bias. Genome Biology. 2010; 11(2):: R14. doi:10.1186/gb-2010-11-2-r14PMID:20132535
11. Kanehisa M, Araki M, Goto S, Hattori M, Hirakawa M, Itoh M, et al. KEGG for linking genomes to life and the environment. Nucleic acids research. 2008; 36(suppl 1): D480–D484.
12. Mao XZ, Cai T, Olyarchuk JG, Wei LP. Automated genome annotation and pathway identification using the KEGG Orthology (KO) as a controlled vocabulary. Bioinformatics. 2005; 21(19): 3787–3793.
PMID:15817693
13. Mortazavi A, Williams BA, McCue K, Schaeffer L, Wold B. Mapping and quantifying mammalian tran-scriptomes by RNA-Seq. Nature Methods. 2008; 5: 621–628. doi:10.1038/nmeth.1226PMID:
14. Anders S. HTSeq: Analysing high-throughput sequencing data with Python. EMBL Heidelberg (Genome Biology Unit). 2010. Available:http://www.huber.embl.de/users/anders/HTSeq/doc/ overview.html.
15. Young MD, Wakefield MJ, Smyth GK, Oshlack A. Gene ontology analysis for RNA-seq: accounting for selection bias. Genome Biology. 2010; 11: R14. doi:10.1186/gb-2010-11-2-r14PMID:20132535
16. Qin DD, Wu HY, Peng HR, Yao YY, Ni ZF, Li ZX, et al. Heat stress-responsive transcriptome analysis in heat susceptible and tolerant wheat (Triticum aestivumL.) by using wheat genome array. BMC Genomics. 2008; 9: 432. doi:10.1186/1471-2164-9-432PMID:18808683
17. Mangelsen E, Kilian J, Harter K, Jansson C, Wanke D, Sundberg E. Transcriptome Analysis of High-Temperature Stress in Developing Barley Caryopses: Early Stress Responses and Effects on Storage Compound Biosynthesis. Molecular Plant. 2011; 4: 97–115. doi:10.1093/mp/ssq058PMID:20924027 18. Fernandes J, Morrow DJ, Casati P, Walbot V. Distinctive transcriptome responses to adverse
environ-mental conditions inZea maysL. Plant Biotechnology Journal. 2008; 6: 782–798. doi:
10.1111/j.1467-7652.2008.00360.xPMID:18643947
19. Zhang XW, Li JP, Liu AL, Zou J, Zhou XY, Xiang JH, et al. Expression profile in rice panicle: insights into heat response mechanism at reproductive stage. PloS One. 2012; 7: e49652. doi:10.1371/ journal.pone.0049652PMID:23155476
20. Rizhsky L, Liang HJ, Shuman J, Shulaev V, Davletova S, Mittler R. When Defense Pathways Collide. The Response ofArabidosisto a Combination of Drought and Heat Stress. Plant Physiology. 2004; 134: 1683–1696. PMID:15047901
21. Li YF, Wang YX, Tang YH, Kakani VG, Mahalingam R. Transcriptome analysis of heat stress response in switchgrass (Panicum virgatumL.). BMC Plant Biology. 2013; 13: 153. doi: 10.1186/1471-2229-13-153PMID:24093800
22. Wang W, Vinocur B, Shoseyov O, Altman A. Role of plant heat-shock proteins and molecular chaper-ones in the abiotic stress response. Trends Plant Sci. 2004; 9: 244–252. PMID:15130550
23. Vierling E. The roles of heat shock proteins in plants. Annu. Rev. Plant Physiol. Plant Mol. Biol. 1991; 42: 579–620.
24. Waters ER, Lee GJ, Vierling E. Evolution, structure and function of the small heat shock proteins in plants. J. Exp. Bot. 1996; 47: 325–338.
25. Lee GJ, Roseman AM, Saibil HR, Vierling E. A small heat shock protein stably binds heat-denatured model substrates and can maintain a substrate in folding-competent state. EMBO J. 1997; 16: 659–
671. PMID:9034347
26. Veinger L, Diamant S, Buchner J, Goloubinoff P. The small heat-shock protein IbpB fromE.coli stabi-lizes stress-denatured proteins for subsequent refolding by a multichaperone network. J. Biol. Chem. 1998; 273: 11032–11037. PMID:9556585
27. Lee GJ, Vierling E. A small heat shock protein cooperates with heat shock protein 70 systems to reacti-vate a heat-denatured protein. Plant Physiol. 2000; 122: 189–198. PMID:10631262
28. Dafny-Yelin M, Tzfira T, Vainstein A, Adam Z. Non-redundant functions of sHSP-CIs in acquired ther-motolerance and their role in early seed development inArabidopsis. Plant Mol. Biol. 2008; 67: 363–
373. doi:10.1007/s11103-008-9326-4PMID:18379884
29. Guo SJ, Zhou HY, Zhang XS, Li XG, Meng QW. Overexpression of CaHSP26 in transgenic tobacco alleviates photoinhibition of PSII and PSI during chilling stress under low irradiance. J. Plant Physiol. 2007; 164: 126–136. PMID:16513207
30. Sanmiya K, Suzuki K, Egawa Y, Shono M. Mitochondrial small heat-shock protein enhances thermoto-lerance in tobacco plants. FEBS Lett. 2004; 557: 265–268. PMID:14741379
31. Lin BL, Wang JS, Liu HC, Chen RW, Meyer Y, Barakat A, et al. Genomic analysis of the Hsp70 super-family inArabidopsis thaliana. Cell Stress Chaperones. 2001; 6: 201–208. PMID:11599561 32. Sung DY, Vierling E, Guy CL. Comprehensive expression profile analysis of theArabidopsisHsp70
gene family. Plant Physiology. 2001; 126: 789–800. PMID:11402207
33. Bhattacharya A, Kurochkin AV, Yip GN, Zhang YB, Bertelsen EB, Zuiderweg ER. Allostery in Hsp70 chaperones is transduced by subdomain rotations. J. Mol. Biol. 2009; 388: 475–490. doi:10.1016/j.
jmb.2009.01.062PMID:19361428
34. Bin-Zvi AP, Goloubinoff P. Review: mechanisms of disaggregation and refolding of stable protein aggregates by molecular chaperones. Journal of Structural Biology. 2001; 135: 84–93. PMID:
11580258
36. Doukhanina EV, Chen SR, Zalm EVD, Godzik A, Reed J, Dickman MB. Identification and functional characterization of the BAG protein family inArabidopsis thaliana. J. Bio. Chem. 2006; 281: 18793–
18801.
37. Kilian J, Whitehead D, Horak J, Wanke D, Weinl S, Batistic O, et al. The AtGenExpress global stress expression data set: protocols, evaluation and model data analysis of UV-B light, drought and cold stress response. Plant J. 2007; 50: 347–363. PMID:17376166
38. Sakurai J, Ishikawa F, Yamaguchi T, Uemura M, Maeshima M. Identification of 33 rice aquaporin genes and analysis of their expression and function. Plant Cell Physiology. 2005; 46: 1568–1577. PMID: