Large-Scale Biomonitoring of Remote and
Threatened Ecosystems via High-Throughput
Sequencing
Joel F. Gibson1,2, Shadi Shokralla1, Colin Curry3, Donald J. Baird3, Wendy A. Monk4, Ian King1, Mehrdad Hajibabaei1*
1Biodiversity Institute of Ontario and Department of Integrative Biology, University of Guelph, Guelph, Ontario, Canada,2Environment Canada, Canada Centre for Inland Waters, Burlington, Ontario, Canada,
3Environment Canada, Canadian Rivers Institute, University of New Brunswick, Fredericton, New Brunswick, Canada,4Canadian Rivers Institute, University of New Brunswick, Fredericton, New Brunswick, Canada
Abstract
Biodiversity metrics are critical for assessment and monitoring of ecosystems threatened by anthropogenic stressors. Existing sorting and identification methods are too expensive and labour-intensive to be scaled up to meet management needs. Alternately, a high-throughput DNA sequencing approach could be used to determine biodiversity metrics from bulk envi-ronmental samples collected as part of a large-scale biomonitoring program. Here we show that both morphological and DNA sequence-based analyses are suitable for recovery of individual taxonomic richness, estimation of proportional abundance, and calculation of bio-diversity metrics using a set of 24 benthic samples collected in the Peace-Athabasca Delta region of Canada. The high-throughput sequencing approach was able to recover all met-rics with a higher degree of taxonomic resolution than morphological analysis. The reduced cost and increased capacity of DNA sequence-based approaches will finally allow environ-mental monitoring programs to operate at the geographical and temporal scale required by industrial and regulatory end-users.
Introduction
Many ecological studies rely on measuring biodiversity within each sample (alpha biodiver-sity), between sampling locations (beta diverbiodiver-sity), and at the regional scale (gamma diversity). Incidence- and abundance-based metrics like taxon richness, taxon evenness, sample dissimi-larity, and assemblage variation can all be derived from direct measures of biodiversity within environmental samples. Using biodiversity metrics, the temporal and spatial drivers of ecosys-tems can be explored [1–3]. Also, maintenance of baseline alpha, beta, and/or gamma diversity corresponds with increased ecosystem functionality and provision of ecosystem services [4]. In order to determine the impact of anthropogenic and natural stressors on aquatic ecosystems, it is first necessary to establish baseline biodiversity metrics for communities in a variety of OPEN ACCESS
Citation:Gibson JF, Shokralla S, Curry C, Baird DJ, Monk WA, King I, et al. (2015) Large-Scale Biomonitoring of Remote and Threatened Ecosystems via High-Throughput Sequencing. PLoS ONE 10(10): e0138432. doi:10.1371/journal. pone.0138432
Editor:Diego Fontaneto, Consiglio Nazionale delle Ricerche (CNR), ITALY
Received:July 11, 2015
Accepted:August 29, 2015
Published:October 21, 2015
Copyright:© 2015 Gibson et al. This is an open access article distributed under the terms of the
Creative Commons Attribution License, which permits unrestricted use, distribution, and reproduction in any medium, provided the original author and source are credited.
Data Availability Statement:All sequencing data are available via Dryad (DOI:10.5061/dryad.vm72v).
Funding:This work was supported by the Ontario Genomics Institute; Genome Canada, NSERC, Environment Canada.
regions. The lack of such baseline data has made it difficult to determine the nature and magni-tude of biodiversity changes in response to stressors [5].
The Athabasca and Peace Rivers, together with the smaller Birch River, form a confluence in the Peace-Athabasca delta, the largest inland freshwater delta complex in the world, a UNESCO World Heritage Site (designated 1983), and a Ramsar Convention wetland of inter-national importance (designated 1982). The entire Peace-Athabasca delta is contained within Wood Buffalo National Park, the largest national park in Canada, and second largest in the world. Of particular concern is the proximity of the Peace-Athabasca delta to expanding energy extraction (Alberta Oil Sands) and hydroelectric projects. The need for ecological assessments of these important boreal regions for early detection and management of potential anthropo-genic effects is critical [5].
The goal of biomonitoring programs has been to assess human impacts against a back-ground of natural variability in ecosystem structure, and biodiversity metrics have played a key role in achieving this [6]. For example, Environment Canada’s Canadian Aquatic Biomonitor-ing Network (CABIN) and the Australian River Assessment System (AUSRIVAS) employ standardized methods to collect and analyze environmental samples in order to assess freshwa-ter site conditions and defreshwa-termine conservation and remediation actions. While varying widely in the exact protocols employed, existing efforts rely almost exclusively on sorting and mor-phological identification of collected benthic invertebrate specimens [6]. Such identification methods require a large investment of time, expertise, and money. These issues have greatly limited biomonitoring programs in remote sites, especially in ecosystems adjacent to large-scale energy and mining operations in less populated regions (e.g., Alberta Oil Sands, Canada). In order to maximize efficiency, identifications are often only conducted to higher taxonomic levels (e.g., family or order [7]).
As an alternative to morphological identification, the use of DNA sequence-based identifi-cation has been proposed [8]. The mitochondrial cytochromecoxidase subunit I (COI) region has been demonstrated to be effective for the identification of Metazoa and is represented by hundreds of thousands of curated sequences in online sequence databases [9,10]. In direct comparisons, the use of COI sequence data has increased the taxon richness estimates of ben-thic samples by as much as 50% over expert identifications and 400% over amateur identifica-tions [11]. Furthermore, direct tests of morphological identification versus DNA barcoding of individual benthic specimens indicate that DNA sequence data provide increased statistical power for bioassessment, mostly due to the addition of genus- and species-level identifications [12–15].
The conventional, Sanger method of DNA sequencing is capable of only producing single DNA sequences from individual specimens. High-throughput sequencing (HTS) employs par-allel sequencing to generate millions of DNA sequences simultaneously. The HTS approach has been employed to recover DNA sequence data from constructed or pre-sorted mixtures of organisms [16–18]. Detailed species-, genus-, family-, and order-level taxonomic information has also been successfully recovered from unsorted mixtures of metazoan tissue collected via freshwater benthic samples and terrestrial Malaise traps [19,20].
levels of taxonomic detail (e.g., genus versus order level) will provide similar patterns between samples, but with added statistical power.
Methods
Field sampling
Field permits were granted by Parks Canada at Wood Buffalo National Park and samplings were conducted by Environment Canada and Parks Canada staff. The field work did not involve endangered or protected species. Four riverine wetland sampling sites from each of the Peace and Athabasca deltas were sampled in June, 2012. Full collection site data is found in Table A inS1 File. Three replicate samples of the aquatic invertebrate assemblage were taken from the edge of the emergent vegetation zone into the submerged vegetation zone at each site. Replicates were located approximately 50 metres apart. Samples were collected using a stan-dard Canadian Aquatic Biomonitoring Network (CABIN) pond net with a sterile 400μm mesh net and attached collecting cup attached to a pole. Effort was standardized at two minutes per sample. Sampling was conducted by moving the net up and down through the vegetation in a sinusoidal pattern while maintaining constant forward motion. If the net became impeded by dislodged vegetation, sampling was paused so extraneous vegetation could be removed. Sam-pling typically resulted in a large amount of vegetation within the net. After samSam-pling, this veg-etation was vigorously rinsed to dislodge attached organisms and visually inspected to remove remaining individuals before discarding. The remaining material was removed from the net and placed in a sterile, white 1L polyethylene sample jar filled no more than half full. The net and collecting cup were rinsed and inspected to remove any remaining invertebrates. Samples were preserved in 95% ethanol in the field, and placed on ice in a cooler for transport to the field base. Here they were transferred to a freezer before shipment. A clean net was used to col-lect samples at each site and field crew wore clean nitrile gloves to colcol-lect and handle samples in the field and laboratory, thereby minimizing the risk of DNA contamination between sites.
Morphological identification
All samples were then submitted to morphological analysis in accordance with CABIN proto-col (heretofore referred to as CABIN). Samples were immediately placed in a -80˚C freezer upon receipt in the lab. Full procedures regarding morphological processing and identification are outlined in the CABIN laboratory manual [7]. Briefly, replicate samples were subsampled using a 100-cell Marchant box [21]. The cells to be identified are randomly selected in advance. Successive cells are processed completely until at least 300 individuals have been identified, with a minimum of five cells being processed. Total abundances are then extrapolated based on number of cells processed. Identification was conducted to family level, although for some groups only class- or order-level identification is recovered. Morphological abundance lists were generated based on mixed taxonomic levels. The morphological data is publicly available from Canada-Alberta Oil Sands Environmental Monitoring Information Portal (www. jointoilsandsmonitoring.ca). After sorting and identification, the samples were reconstituted and preserved again in 95% ethanol.
DNA extraction
sec. Total DNA of this homogenized slurry was extracted using a Nucleospin tissue kit (Macherey-Nagel Inc.) following the manufacturer’s instructions and eluted in 50μL of molec-ular biology grade water.
PCR amplification and high-throughput sequencing
Two fragments within the standard COI DNA barcode region were amplified with two primer sets in a two-step PCR amplification regime [19]. The F230 fragment of COI is approximately 230bp in length, is found at the 5’end of the standard barcoding region and is amplified using the standard Folmer et al. forward primer (F GGTCAACAAATCATAAAGATATTGG [22]) and a reverse primer newly designed for this study using sequences from a wide range of arthropod orders (230_R CTTATRTTRTTTATICGIGGRAAIGC). The BE fragment of COI is approximately 314bp in length, is found toward the 3’end of the standard barcoding region, and has no overlap with the F230 region. The BE fragment id amplified using the following primers, previously optimized for use with a broad range of arthropod orders: B CCIGAYAT RGCITTYCCICG [19], and R5 GTRATIGCICCIGCIARIAC [20]. The first PCR used COI specific primers and the second PCR involved Illumina-tailed primers. The PCR reactions were assembled in 25μL volumes. Each reaction contained 2μL DNA template, 17.5μL molecu-lar biology grade water, 2.5μL 10× reaction buffer (200mM Tris HCl, 500mM KCl, pH 8.4), 1μL MgCl2(50mM), 0.5μL dNTPs mix (10mM), 0.5μL forward primer (10mM), 0.5μL reverse primer (10mM), and 0.5μL Invitrogen’s Platinum Taq polymerase (5 U/μL). The PCR condi-tions were initiated with heated lid at 95°C for 5min, followed by a total of 30 cycles of 94°C for 40s, 46°C (for both primer sets) for 1min, and 72°C for 30s, and a final extension at 72°C for 5min, and hold at 4°C. Amplicons from each sample were purified using Qiagen’s MiniElute PCR purification columns and eluted in 30μL molecular biology grade water. The purified amplicons from the first PCR were used as templates in the second PCR with the same amplifi-cation condition used in the first PCR with the exception of using Illumina-tailed primers in a 30-cycle amplification regime. All PCRs were done using Eppendorf Mastercycler ep gradient S thermalcyclers and negative control reactions (no DNA template) were included in all ex-periments. PCR products were visualized on a 1.5% agarose gel to check the amplification suc-cess. All generated 48 amplicons plates were dual indexed and pooled into a single tube and sequenced on a Miseq flowcell using a V2 Miseq sequencing kit (250 × 2)(FC-131-1002 and MS-102-2003). All sequencing data generated has been submitted to Dryad and can be accessed at doi:10.5061/dryad.vm72v.
Bioinformatic processing
were retained for further processing. All filtered, non-chimeric reads from all 24 samples were pooled and clustered at 98% similarity using USEARCH. For those clusters including at least 100 sequences, membership in each cluster for each sample was recorded as an OTU sequence abundance matrix (DNA-OTU).
Both BE and F230 sequences were pooled for each sample and identified using the MEGA-BLAST algorithm [26] against a reference library. This reference library contained all verified COI sequences downloaded from the GenBank database September 5th2014 with a minimum length of 100bp (N = 985,210 sequences). All MEGABLAST searches were conducted with a minimum alignment length percentage of 85% and a minimum similarity of 90%. Taxonomic identifications were recovered based on unambiguous top matches. Genus, family, and order matrices for taxa with a minimum of ten sequences per sample were generated for each sample based on these matches (heretofore referred to as DNA-order, DNA-family, DNA-genus). Only taxon names within benthic metazoan phyla (i.e., Annelida, Arthropoda, Mollusca, Chor-data, Cnidaria) were included in analysis. A subset of matches with a minimum similarity of 98% was used to generate a species matrix (DNA-species). For all identification levels, except DNA-OTU, a subset of the matrix including only representatives of Ephemeroptera, Trichop-tera, and Odonata (ETO) was generated.
Biodiversity analysis
Species, genus, family, order, OTU, and mixed taxonomic level morphological matrices (hereby designated DNA-species, DNA-genus, DNA-family, DNA-order, DNA-OTU, and CABIN, respectively) were used to calculate richness and evenness values for each sample. Beta diversity metrics were calculated for eight sites (three samples each), two rivers (twelve samples each), and all samples combined (24 samples). Similarity between means of biodiversity metrics between river sites was determined using a Welch’s t-test, which accounts for unequal vari-ances between groups. All richness and dissimilarity metrics were calculated using thevegan 2.2–1 package [27] in R v3.1.2 [28]. We used a Pearson’s product-moment correlation test to determine correlation between alpha diversity metrics gathered through different methods and at different taxonomic levels.
We used average dissimilarity of samples from their group centroid in principal coordinate space to assess the assemblage variation [29,30]. The presence/absence-based Sørensen dissimi-larity index the abundance-based Bray-Curtis dissimidissimi-larity index based on raw observations (individuals for CABIN, sequences for DNA methods), and Bray-Curtis dissimilarity based on proportion of overall observations (individuals or sequences), were all used to analyze differences in assemblage variation using a distance-based test for homogeneity of multivariate dispersions. Analyses were completed using thebetadisperfunction invegan. Bray-Curtis dissimilarity values based on proportion of observations were also used to calculate a non-metric multi-dimensional scaling (nMDS) analysis using thevegdistandmetaMDScommands invegan.
Results and Discussion
Raw data
of sequences recovered through OTU clustering and identified at each taxonomic level varied from a mean of 77,252 (SD ± 37,224.68) sequences per sample at the species level up to 170,733 (± 56,179.01) sequences per sample at the order level (Fig 1).
Alpha diversity metrics
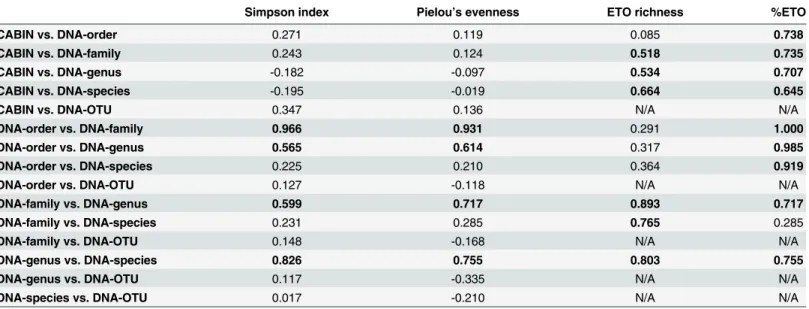
Estimated taxonomic richness varied from a mean of 21.88 (± 3.67) per sample at the CABIN level up to a mean of 2,539.00 (± 607.27) per sample at the DNA-OTU level (Fig 1). A signifi-cant, positive correlation was detected between Simpson index values calculated at the order and family levels, order and genus levels, family and DNA-genus levels, and DNA-DNA-genus and DNA-species levels (Table 1). A significant, positive correla-tion was detected between Pielou’s evenness values calculated at the order and DNA-Fig 1. Raw biodiversity data for 24 benthic samples from the Peace-Athabasca delta at six different taxonomic levels via morphological identification and HTS.Mean taxon richness (S) of all samples plus one standard deviation is depicted. N denotes the mean number of sequences identified at this taxonomic level per sample.
doi:10.1371/journal.pone.0138432.g001
Table 1. Pearson product moment correlations between alpha diversity metrics calculated at different taxonomic levels via morphological identifi-cation and HTS.
Simpson index Pielou’s evenness ETO richness %ETO
CABIN vs. DNA-order 0.271 0.119 0.085 0.738
CABIN vs. DNA-family 0.243 0.124 0.518 0.735
CABIN vs. DNA-genus -0.182 -0.097 0.534 0.707
CABIN vs. DNA-species -0.195 -0.019 0.664 0.645
CABIN vs. DNA-OTU 0.347 0.136 N/A N/A
DNA-order vs. DNA-family 0.966 0.931 0.291 1.000
DNA-order vs. DNA-genus 0.565 0.614 0.317 0.985
DNA-order vs. DNA-species 0.225 0.210 0.364 0.919
DNA-order vs. DNA-OTU 0.127 -0.118 N/A N/A
DNA-family vs. DNA-genus 0.599 0.717 0.893 0.717
DNA-family vs. DNA-species 0.231 0.285 0.765 0.285
DNA-family vs. DNA-OTU 0.148 -0.168 N/A N/A
DNA-genus vs. DNA-species 0.826 0.755 0.803 0.755
DNA-genus vs. DNA-OTU 0.117 -0.335 N/A N/A
DNA-species vs. DNA-OTU 0.017 -0.210 N/A N/A
Highlighted values indicate a significant (p<0.05), positive correlation between indices at two different taxonomic levels.
family levels, DNA-order and DNA-genus levels, DNA-family and DNA-genus levels, and DNA-genus and DNA-species levels (Table 1).
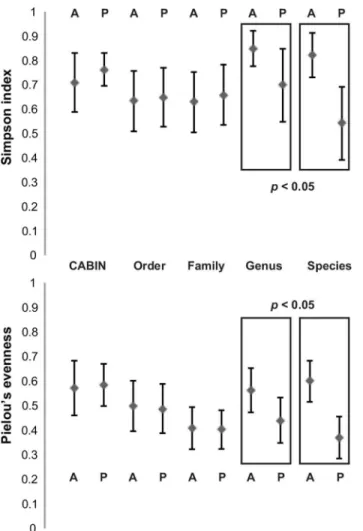
Mean Simpson index did not significantly differ between Athabasca wetland and Peace wet-land sites when calculated at CABIN, DNA-order, or DNA-family levels (Fig 2; Table B inS1 File). However, when calculated at DNA-genus and DNA-species levels, a significant difference between the two sets of sites was detected (Welch two sample t-test–DNA-genus t = 3.12, df = 15.90, p = 0.007; DNA-species t = 5.46, df = 18.15, p<0.001). Likewise, mean Pielou’s evenness did not significantly differ between Athabasca and Peace sites when calculated at CABIN, DNA-order, or DNA-family levels (Fig 2; Table B inS1 File). However, when calcu-lated at DNA-genus and DNA-species levels, a significant difference between the two sets of sites was detected (Welch two sample t-test–genus t = 3.29, df = 21.97, p = 0.003; DNA-species t = 6.69, df = 22.00, p<0.001). Additional alpha diversity metrics are included in Table B inS1 File.
Taxonomic richness varied between taxonomic levels in part due to differing levels of dis-crimination (Fig 1). Taxa recovered morphologically included a mix of classes, orders, and families. As such, the average richness reported is higher than when order richness, determined with DNA sequence data, is considered. Average family and genus richness, as determined
Fig 2. Alpha diversity metrics calculated for 24 benthic samples from the Peace-Athabasca delta at five different taxonomic levels via morphological identification and HTS.Means of all samples plus one standard deviation are depicted. Taxonomic levels at which a significant difference (p<0.05) between means
of values for Athabasca and Peace sites are highlighted. A—Athabasca River sites. P–Peace River sites.
with DNA sequence data, is higher than both morphological richness and DNA-order richness due to consistently increased discriminatory power at these levels. Average species richness, as determined with DNA sequence data, is lower compared to DNA-genus due to the stricter level of sequence similarity to published databases (i.e., 98% versus 90% sequence similarity) employed by our protocol. Average OTU richness is much higher than any other richness mea-sure despite a comparable number of observations used (Fig 1). The greatly increased richness at this level is likely due to the inclusion of a large number of taxa not included at other levels, namely plants, algae, bacteria, and fungi. A degree of genetic differentiation, beyond the species level (i.e., population and haplotype differences) is also reported as increased OTU richness.
Derived alpha diversity metrics (i.e., Shannon index and Pielou’s evenness) show a similar pattern between samples when measured at order, family, genus, or DNA-species levels (Table 1). However, there is a lack of significant, positive correlation between these metrics derived from morphology or DNA-OTU as compared to any other level. This would suggest that alpha diversity could be consistently reported at a variety of taxonomic lev-els using DNA sequence data. Morphology, as implemented in the CABIN protocol, however, reports differing values due to an inability to consistently observe a targeted, morphologically identifiable subset of organisms [31]. Conversely, alpha diversity as derived from OTUs repre-sents a much larger suite of included taxa and therefore different patterns. This lack of correla-tion between morphological and DNA-based alpha diversity metrics, especially when
morphological inclusion is limited, has been previously noted [18].
When attempting to distinguish between wetland sites based on alpha diversity metrics, CABIN identification, order-level DNA sequence data, and family level DNA sequence data did not display any discriminatory resolution (Fig 2). It is only with the greater number of tax-onomic units present in DNA-genus and DNA-species data that it is possible to observe differ-ences between the river deltas in regards to Shannon index and Pielou’s evenness.
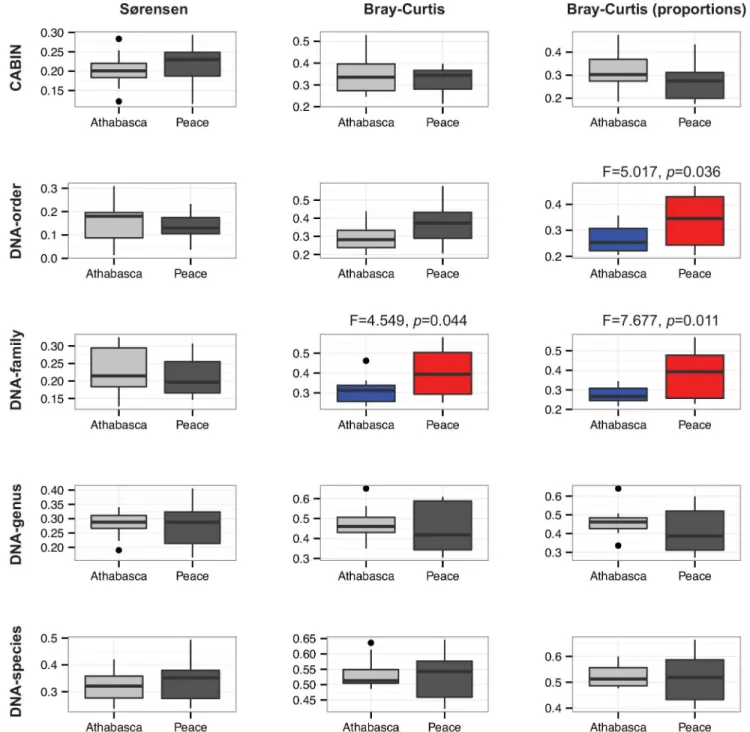
Beta diversity metrics
Permutational ANOVA tests based on Sørensen, Curtis (sequence number), and Bray-Curtis (proportion of sequences) dissimilarities revealed that wetland and individual site were both significant sources of variation at all levels (CABIN, DNA-Order, DNA-Family, DNA--Genus, DNA-Species) (Table B inS1 File).
Beta diversity, as measured by assemblage variation using average dissimilarity of samples from their group centroid in principal coordinate space, could be calculated at all taxonomic levels. This approach to beta diversity analysis is positively related to environmental heteroge-neity between groups of sites [30]. A greater degree of assemblage variation was recovered for the Peace River sites as compared to the Athabasca River sites (Fig 3). The detection of this dif-ference was dependent on the taxonomic level and dissimilarity metric employed. The DNA-order and DNA-family levels recovered a significant beta diversity difference between river sys-tems, whereas CABIN data did not. Once again, this is due to the increased discriminatory power afforded by DNA-based approaches. This ability to discriminate between groups of sam-ples based on beta diversity measures using only HTS data has been demonstrated in the past, albeit not with aquatic samples and not at multiple levels of taxonomic discrimination [18].
Previous, morphology-based, aquatic biomonitoring studies have demonstrated the dis-criminatory power of abundance metrics [35,36]. It has been claimed, however, that the com-plexities of sequence-based biodiversity measurement (e.g., PCR bias, gene copy number, individual biomass) will preclude the inclusion of abundance metrics [18]. The present study has sought to test this assumption. Incidence-based dissimilarity metrics (i.e., Sørensen) did not recover significant beta diversity differences whereas abundance-based metrics (i.e., Bray-Fig 3. Community assemblage measures for 24 benthic samples from the Peace-Athabasca delta at five different taxonomic levels via
morphological identification and HTS.Box and whisker plots of distance to centroid in principal coordinate space based on three dissimilarity measures–
Sørensen, Bray-Curtis based on sequence number, and Bray-Curtis based on proportions of sequences. Significant differences (p<0.05) between
Athabasca and Peace sites are highlighted in colour.
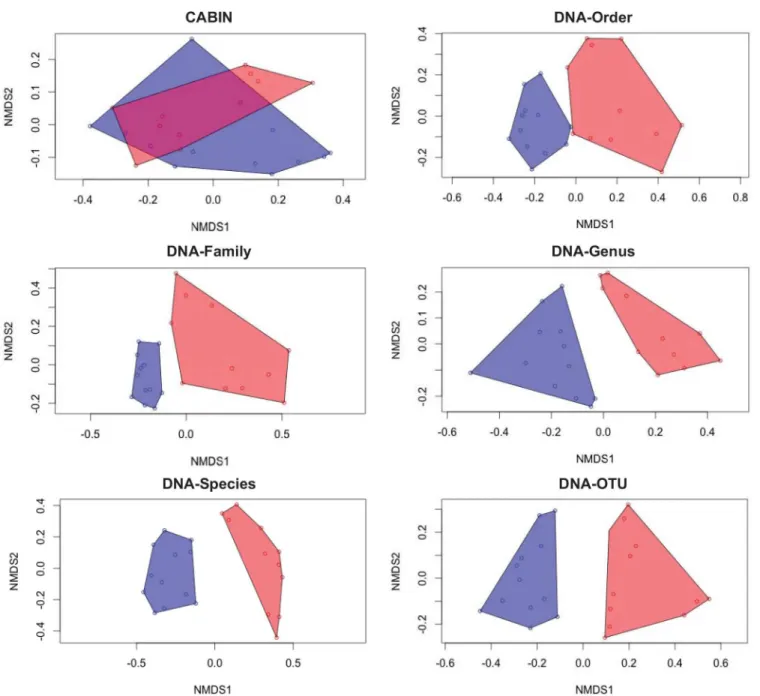
Curtis) either including raw or proportional abundance did. An nMDS illustration of beta diversity echoes the discriminatory power of DNA-based metrics as only morphology-based identification failed to discriminate between wetland sites (Fig 4).
Gamma diversity metrics
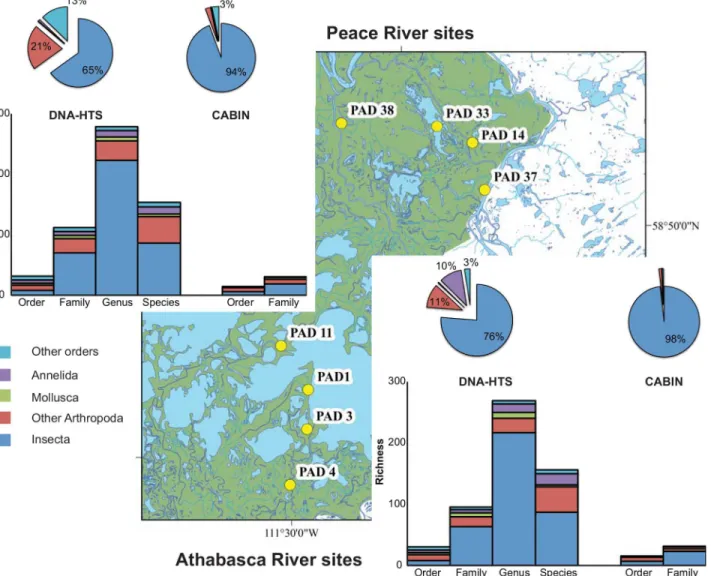
The number of taxa found in both Athabasca and Peace River wetland sites varied depending on taxonomic level (Fig 5). The proportion of taxa shared by both rivers ranged from 41.6% (DNA-species) to 63.2% (DNA-order). The proportion of taxa endemic to only one river Fig 4. Community assemblage measures for 24 benthic samples from the Peace-Athabasca delta at six different taxonomic levels via
morphological identification and HTS.Non-metric multidimensional scaling (nMDS) plots calculated from Bray-Curtis dissimilarities based on proportion of observations. Blue points and polygon represent Athabasca River sites. Red points and polygon represent Peace River sites.
system ranged from 15.7% (DNA-order Peace only) to 30.9% (DNA-family Athabasca only). CABIN recovered three order names and eleven family names not detected by HTS. While the level of morphological identification could have been increased with a greater investment of time and expertise, the adoption of a standardised CABIN protocol limits the diversity metrics to those recovered. Conversely, HTS recovered 22 order names and 108 family names not recovered by morphological identification. All 378 genus names and 219 species names were only recovered by HTS.
In the broadest sense, the total amount of biological information available regarding each of these river systems (i.e., gamma diversity) is greatly increased through the use of HTS technol-ogy. Over 700 family, genus, and species names are added to the reported biological richness by using DNA sequence-based identification as compared to morphological identification (Fig 5). Some of these names represent organisms present as DNA fragments (e.g., waste tissue, gut contents) and, therefore, not directly detectable using taxonomic keys. For example, the spottail shiner (Notropis hudsonius(Clinton)) and northern pike (Esox LuciusLinnaeus) were only Fig 5. Gamma diversity recovered from Athabasca River and Peace River sites at six different taxonomic levels via morphological identification (CABIN) and molecular methods (DNA-HTS).Column charts represent taxonomic richness separated by major groups and taxonomic levels. Pie charts represent proportion of observations (sequences or individuals) identified to the order level assigned to each major group.
detected in Athabasca sites. In other cases, DNA sequence identification affords greater levels of detail than family-level morphological identification. For example, three species of mayflies (Caenis amicaHagen,C.latipennisBanks, andC.punctataMcDunnough) are found only in Peace sites.
This ability to recover genus and species names with a high degree of confidence is linked to the availability of reference DNA sequences for targeted taxonomic groups (i.e., North Ameri-can arthropods). This same level of identification would not be likely if a group with a lower proportion of databased DNA barcode sequences was used (e.g., tropical arthropods [18,20]). Furthermore, the addition of family, genus, and species names allows the possibility of adding trait data, stressor tolerance, and trophic information to taxonomic lists [37–42].
Targeted biodiversity metrics
Focusing biodiversity metrics on key“indicator”taxa has been a means of focusing biomoni-toring efforts. Taxon-specific metrics (e.g., proportion of Ephemeroptera, Trichoptera, and Odonata—%ETO [41]) are used as proxies for overall biodiversity. Direct tests of such proxy approaches have revealed that taxon-limited biodiversity metrics may not accurately reflect general biodiversity patterns [11,43–45].
Genus level biodiversity metrics of targeted benthic macroinvertebrates (Ephemeroptera, Plecoptera, and Trichoptera) have been found to be important indicators of physical and chemical factors affecting aquatic systems [3,35,46]. In the present study, alpha diversity met-rics for a similar limited subset of benthic taxa (i.e., Ephemeroptera, Trichoptera, and Odonata) show high consistency regardless of the taxonomic level employed (Table 1). The pattern of intersample ETO diversity was consistent between taxonomic levels, albeit with a wide range of reported values—3.13 morphological taxa to 7.63 genera per sample and 0.86% to 37.63% of total observations. The notable exception is order richness. This is understandable due to the narrow range of values possible–zero to three. The use of an HTS barcoding approach pre-serves the ability to easily focus on indicator groups as well as total biodiversity.
Conclusion
The added taxonomic resolution supplied by HTS methods provides increased resolution of alpha, beta, and gamma biodiversity metrics. Critically, this information gain comes at a reduced cost, yet also provides increased discrimination between samples, sites, and river sys-tems over more traditional methods.
The use of multiple biodiversity metrics in concert and the development of a multimetric index (MMI) has been proposed [47]. In practice, different suites of metrics have been found to be informative in environments subjected to differing stressors [41]. The use of HTS sequence data allows for the rapid generation of numerous biodiversity indices, to be investigated and combined in any number of MMI frameworks. While the CABIN protocol was employed here, the current method is also adaptable to any of the many benthic sampling protocols employed worldwide [6]. By utilizing the power of HTS, an increase in spatio-temporal sampling effort, combined with increased efficiency and data resolution is possible. Improved biomonitoring will empower biologists and managers to detect and respond to stressors threatening ecosystems more rapidly, yielding new insights into large-scale spatial patterning of planetary biodiversity.
Supporting Information
S1 File. Table A, Collection and locality data for all samples included in analysis. Table B, Additional biodiversity metrics calculated via four methods.
Acknowledgments
The authors would like to acknowledge Kristie Heard and Adam Bliss for taxonomic support.
Author Contributions
Conceived and designed the experiments: JFG SS DJB MH. Performed the experiments: JFG SS CC DJB WAM IK MH. Analyzed the data: JEG SS CC DJB WAM IK MH. Contributed reagents/materials/analysis tools: DJB MH. Wrote the paper: JFG SS CC DJB WAM IK MH.
References
1. Florencio M, Díaz-Paniagua C, Gómez-Rodríguez C, Serrano L. Biodiversity patterns in a macroinver-tebrate community of a temporary pond network. Insect Conserv. Diver. 2013; 7: 4–21. doi:10.1111/ icad.12029
2. Astorga A, Death R, Death F, Paavola R, Chakraborty M, Muotka T. Habitat heterogeneity drives the geographical distribution of beta diversity: the case of New Zealand stream invertebrates. Ecol. Evol. 2014; 4: 2693–2702. doi:10.1002/ece3.1124PMID:25077020
3. Narangarvuu D, Hsu C-B, Shieh S-H, Wu F-C, Yang P-S. Macroinvertebrate assemblage patterns as indicators of water quality in the Xindian watershed, Taiwan. J. Asia-Pac. Entomol. 2014; 17: 505–513. doi:10.1016/j.aspen.2014.04.011
4. Pasari JR, Levi T, Zavaleta ES, Tilman D. Several scales of biodiversity affect ecosystem multifunction-ality. P. Natl. Acad. Sci. USA. 2013; 110: 10219–10222. doi:10.1073/pnas.1314920110
5. Anas MUM, Scott KA, Cooper RN, Wissel B. Zooplankton communities are good indicators of potential impacts of Athabasca oil sands operations on downwind boreal lakes. Can. J. Fish. Aquat. Sci. 2014; 71: 719–732. doi:10.1139/cjfas-2013-0472
6. Buss DF, Carlisle DM, Chon T- S, Culp J, Harding JS, Keizer-Vlek HE, et al. Stream biomonitoring using macroinvertebrates around the globe: a comparison of large-scale programs. Environ. Monit. Assess. 2015; 187: 4132. doi:10.1007/s10661-014-4132-8PMID:25487459
7. Environment Canada. Canadian Aquatic Biomonitoring Network Laboratory Methods: processing, tax-onomy, and quality control of benthic macroinvertebrate Samples. Ottawa: Environment Canada; 2012.
8. Hajibabaei M, Singer GAC, Hebert PDN, Hickey DA. DNA barcoding: how it complements taxonomy, molecular phylogenetics and population genetics. Trends Genet. 2007; 23: 167–172. PMID:17316886
9. Ratnasingham S, Hebert PDN. BOLD: the barcode of life data system (www.barcodinglife.org). Mol. Ecol. Notes. 2007; 7: 355–364. doi:10.1111/j.1471-8286.2006.01678.xPMID:18784790
10. Benson DA, Karsch-Mizrachi I, Lipman DJ, Ostell J, Sayers EW. GenBank. Nucleic Acids Res. 2010; 39: D32–D37. doi:10.1093/nar/gkq1079PMID:21071399
11. Sweeney BW, Battle JM, Jackson JK, Dapkey T. Can DNA barcodes of stream macroinvertebrates improve descriptions of community structure and water quality? J. N. Am. Benthol. Soc. 2011; 30: 195–
216. doi:10.1899/10-016.1
12. Pilgrim EM, Jackson SA, Swenson S, Turcsanyi I, Friedman E, Weigt L, et al. Incorporation of DNA bar-coding into a large-scale biomonitoring program: opportunities and pitfalls. J. N. Am. Benthol. Soc. 2011; 30: 217–231. doi:10.1899/10-012.1
13. Gill BA, Harrington RA, Kondratieff BC, Zamudio KR, Poff NL, Funk WC. Morphological taxonomy, DNA barcoding, and species diversity in southern Rocky Mountain headwater streams. Freshw. Sci. 2014; 33: 288–301. doi:10.1086/674526
14. Jackson JK, Battle JM, White BP, Pilgrim EM, Stein ED, Miller PE, et al. Cryptic biodiversity in streams: a comparison of macroinvertebrate communities based on morphological and DNA barcode identifica-tions. Freshw. Sci. 2014; 33: 312–324. doi:10.1086/675225
15. Stein ED, White BP, Mazor RD, Jackson JK, Battle JM, Miller PE, et al. Does DNA barcoding improve performance of traditional stream bioassessment metrics? Freshw. Sci. 2014; 33: 302–311. doi:10. 1086/674782
16. Hajibabaei M, Spall JL, Shokralla S, van Konynenburg S. Assessing biodiversity of a freshwater benthic macroinvertebrate community through nondestructive environmental barcoding of DNA from preserva-tive ethanol. BMC Ecol. 2012; 12: 28. doi:10.1186/1472-6785-12-28PMID:23259585
18. Ji Y, Ashton L, Pedley SM, Edwards DP, Tang Y, Nakamura A, et al. Reliable, verifiable and efficient monitoring of biodiversity via metabarcoding. Ecol. Lett. 2013; 16: 1245–1257. doi:10.1111/ele.12162 PMID:23910579
19. Hajibabaei M, Shokralla S, Zhou X, Singer GAC, Baird DJ. Environmental barcoding: a next-generation sequencing approach for biomonitoring applications using river benthos. PLoS One. 2011; 6: e17497. doi:10.1371/journal.pone.0017497PMID:21533287
20. Gibson J, Shokralla S, Porter TM, King I, van Konynenburg S, Janzen DH, et al. Simultaneous assess-ment of the macrobiome and microbiome in a bulk sample of tropical arthropods through DNA metasys-tematics. P. Natl. Acad. Sci. USA, 2014; 111: 8007–8012. doi:10.1073/pnas.1406468111
21. Marchant R. A subsampler for samples of benthic invertebrates. Bull. Australian Soc. Limnol. 1989; 12: 49–52.
22. Folmer O, Black M, Hoeh W, Lutz R, Vrijenhoek R. DNA primers for amplification of mitochondrial cyto-chromecoxidase subunit I from diverse metazoan invertebrates. Mol. Marine Biol. Biotech. 1994; 3: 294–299.
23. Schmieder R, Edwards R. Quality control and preprocessing of metagenomic datasets. Bioinformatics. 2011; 27: 863–864. doi:10.1093/bioinformatics/btr026PMID:21278185
24. Edgar RC. Search and clustering orders of magnitude faster than BLAST. Bioinformatics. 2010; 26: 2460–2461. doi:10.1093/bioinformatics/btq461PMID:20709691
25. Edgar RC, Haas BJ, Clemente JC, Quince C, Knight R. UCHIME improves sensitivity and speed of chi-mera detection. Bioinformatics. 2011; 27: 2194–2200. doi:10.1093/bioinformatics/btr381PMID: 21700674
26. Zhang Z, Schwartz S, Wagner L, Miller W. A greedy algorithm for aligning DNA sequences. J. Comput. Biol. 2000; 7: 203–214. PMID:10890397
27. Oksanen J, Blanchet FG, Kindt R, Legendre P, Minchin PR, O’Hara RB, et al.vegan: Community Ecol-ogy Package. 2.2–1 ed; 2015. Available:http://CRAN.R-project.org/package=vegan.
28. R Core Team. R: A language environment for statistical computing. 3.1.2 ed. Vienna, Austria: R Foun-dation for Statistical Computing; 2014.
29. Anderson MJ. Distance-based tests for homogeneity of multivariate dispersions. Biometrics. 2006; 62: 245–253. doi:10.1111/j.1541-0420.2005.00440.xPMID:16542252
30. Anderson MJ, Ellingsen KE, McArdle BH. Multivariate dispersion as a measure of beta diversity. Ecol. Lett. 2006; 9: 683–693. doi:10.1111/j.1461-0248.2006.00926.xPMID:16706913
31. Orlofske JM, Baird DJ. The tiny mayfly in the room: implications of size-dependent invertebrate taxo-nomic identification for biomonitoring data properties. Aquat. Ecol. 2013; 47: 481–494. doi:10.1007/ s10452-013-9460-1
32. Engelbrektson A, Kunin V, Wrighton KC, Zvenigorodsky N, Chen F, Ochman H, et al. Experimental fac-tors affecting PCR-based estimates of microbial species richness and evenness. ISME J. 2010; 4: 642–647. doi:10.1038/ismej.2009.153PMID:20090784
33. Gonzalez JM, Portillo MC, Belda-Ferre P, Mira A. Amplification by PCR artificially reduces the propor-tion of the rare biosphere in microbial communities. PLoS One. 2012; 7: e29973. doi:10.1371/journal. pone.0029973PMID:22253843
34. Leray M, Knowlton N. DNA barcoding and metabarcoding of standardized samples reveal patterns of marine benthic diversity. P. Natl. Acad. Sci. USA. 2015; 112: 2076–2081. doi:10.5883/ds-arms
35. Arce E, Archaimbault V, Mondy CP, Usseglio-Polatera P. Recovery dynamics in invertebrate communi-ties following water-quality improvement: taxonomy- vs trait-based assessment. Freshw. Sci. 2014; 33: 1060–1073. doi:10.1086/678673
36. Semprucci F, Frontalini F, Sbrocca C, du Châtelet EA, Bout-Roumazeilles V, Coccioni R, et al. Meio-benthos and free-living nematodes as tools for biomonitoring environments affected by riverine impact. Environ. Monit. Assess. 2015; 187: 251. doi:10.1007/s10661-015-4493-7PMID:25877645
37. Monaghan KA, Soares AMVM. Improving the accuracy of aquatic macroinvertebrate trait assignment—
the importance of taxon-weighting. Can. J. Fish. Aquat. Sci. 2013; 70: 885–894. doi: 10.1139/cjfas-2012-0402
38. Chang FH, Lawrence JE, Rios-Touma B, Resh VH. Tolerance values of benthic macroinvertebrates for stream biomonitoring: assessment of assumptions underlying scoring systems worldwide. Environ. Monit. Assess. 2014; 186: 2135–2149. doi:10.1007/s10661-013-3523-6PMID:24214297
40. Orlofske JM, Baird DJ. A geometric morphometric approach to establish body-shape trait criteria for aquatic insects. Freshw. Sci. 2014; 33: 978–994. doi:10.1086/676912
41. Huang Q, Gao J, Cai Y, Yin H, Gao Y, Zhao J, et al. Development and application of benthic macroin-vertebrate-based multimetric indices for the assessment of streams and rivers in the Taihu Basin, China. Ecol. Indic. 2015; 48: 649–659. doi:10.1016/j.ecolind.2014.09.014
42. Schmidt-Kloiber A, Hering D.www.freshwaterecology.info–An online tool that unifies, standardises and codifies more than 20,000 European freshwater organisms and their ecological preferences. Ecol. Indic. 2015; 53: 271–282. doi:10.1016/j.ecolind.2015.02.007
43. Heino J, Paavola R, Virtanen R, Muotka T. Searching for biodiversity indicators in running waters: do bryophytes, macroinvertebrates, and fish show congruent diversity patterns? Biodivers. Conserv. 2005; 14: 415–428.
44. Lindenmayer DB, Likens GE. Direct measurement versus surrogate indicator species for evaluating environmental change and biodiversity loss. Ecosystems. 2010; 14: 47–59. doi: 10.1007/s10021-010-9394-6
45. Curry CJ, Zhou X, Baird DJ. Congruence of biodiversity measures among larval dragonflies and caddis-flies from three Canadian rivers. Freshwater Biol. 2012; 57: 628–639. doi:10.1111/j.1365-2427.2011. 02724.x
46. Tonkin JD, Shah DN, Kuemmerlen M, Li F, Cai Q, Haase P, et al. Climatic and catchment-scale predic-tors of Chinese stream insect richness differ between taxonomic groups. PLoS One. 2015; 10: e0123250. doi:10.1371/journal.ponePMID:25909190