___________________________________
1 Engo Agrônomo, Doutor, Assistente Administrativo, Departamento de Engenharia Agrícola, Universidade Federal do Ceará, Fone: (0xx85) 33669764, [email protected].
2 Engo Agrícola, Doutor em Agricultural Irrigation Engineering pela Utah State University, Prof. Titular do Departamento de Engenharia Agrícola e Ambiental da Universidade Federal de Viçosa.
3 Engo Agrônomo, Doutor em Engenharia Agrícola e de Biossistemas pela University of California - Davis, Prof. Associado I do Departamento de Engenharia Agrícola da Universidade Federal do Ceará.
4 Engo Agrônomo, Doutor em Engenharia Agrícola pela Universidade Federal de Viçosa, Prof. Associado IV do Departamento de Engenharia Agrícola da Universidade Federal de Viçosa.
Recebido pelo Conselho Editorial em: 10-3-2011 Aprovado pelo Conselho Editorial em: 5-11-2012
HYDROLOGIC MOLDING IN RESERVOIRS OF THE HYDROGRAPHIC BASIN OF JAGUARIBE RIVER IN THE STATE OF CEARÁ, BRAZIL
RAIMUNDO A. DE O. LEÃO1, ANTÔNIO A. SOARES2, ADUNIAS DOS S. TEIXEIRA3, DEMETRIUS D. DA SILVA4
ABSTRACT: The edafoclimatic conditions of the Brazilian semiarid region favor the water loss by surface runoff. The state of Ceará, almost completely covered by semiarid, has developed public policies for the construction of dams in order to attend the varied water demand. Several hydrological models were developed to support decisive processes in the complex management of reservoirs. This study aimed to establish a methodology for obtaining a georeferenced database suitable for use as input data in hydrological modeling in the semiarid of Ceará. It was used images of Landsat satellite and SRTM Mission, and soil maps of the state of Ceará. The Landsat images allowed the determination of the land cover and the SRTM Mission images, the automatic delineation of hydrographic basins. The soil type was obtained through the soil map. The database was obtained for Jaguaribe River hydrographic basin, in the state of Ceará, and is applicable to hydrological modeling based on the Curve Number method for estimating the surface runoff.
KEYWORDS: geoprocessing, GIS, hydrologic models, curve number, Jaguaribe River, semiarid.
GERAÇÃO DE BASE DE DADOS GEORREFERENCIADA COM FINALIDADE DE MODELAGEM HIDROLÓGICA EM RESERVATÓRIOS DA BACIA HIDROGRÁFICA
DO RIO JAGUARIBE, CEARÁ, BRASIL
RESUMO: As condições edafoclimáticas do semiárido brasileiro favorecem a perda de água por escoamento superficial. O Estado do Ceará, quase totalmente abrangido pelo semiárido, desenvolveu políticas públicas voltadas para a construção de açudes, a fim de atender à demanda hídrica diversificada. Vários modelos hidrológicos foram desenvolvidos para subsidiar os processos decisórios no complexo manejo dos reservatórios. Este trabalho teve como objetivo estabelecer uma metodologia para a obtenção de uma base de dados georreferenciada e adequada para uso como dados de entrada na modelagem hidrológica, no semiárido cearense. Foram utilizadas imagens de satélite Landsat e da missão SRTM, e mapa de solos do Estado do Ceará. As imagens Landsat possibilitaram determinar a cobertura do solo, e as imagens da missão SRTM, a delimitação automática das bacias hidrográficas. O tipo de solo foi obtido por meio do mapa de solos. A base de dados foi obtida para a bacia hidrográfica do Rio Jaguaribe, Ceará, e é aplicável à modelagem hidrológica com base no método do Número da Curva para a estimativa do escoamento superficial.
INTRODUCTION
The Brazilian semiarid region is characterized by irregular spatiotemporal annual average precipitation of 600mm, concentrated within four months, and potential evapotranspiration of 2000mm per year, with vegetation in which predominates the Caatinga, that presents trees and leafless dry shrubs in the dry period (QUEIROZ et al., 2006) and shallow soil on a crystalline shield, practically waterproof, in much of its territory (ALVES et al., 2009). According to CAMPOS (2006), these characteristics make the formation of perennial rivers impossible.
These characteristics led to the tradition of over a century of policy that aims the construction of dams to perpetuate the rivers to overcome the water scarcity in the dry season (KROL & BRONSTERT, 2007). In the state of Ceará, Brazil, the dams perpetuate the rivers, supply cities, favor the production of crops of high economic value, aqua farming and shrimp farming, impel the trade and tourism and enable the industrialization, in addition to reduce the problems of possible floods.
The management of reservoirs is a key component in managing water resources (CASTELLETTI & SONCINI-SESSA, 2007) and of complex nature because it involves a wide variety of environmental, social, political and economic qualitative factors (FU, 2008).
Informatics contributes to the management of the reservoirs through Geographic Information Systems (GIS) and computational models toward the management of water resources and hydrology behavior of hydrographic basins. The summaries of some computational models can be found in the Hydrological Models Inventory maintained jointly by the Bureau of Reclamation and the Texas A&M University (TEXAS A&M UNIVERSITY, 2009).
It was emphasized that many of these models requires data, especially geographic data, for the hydrographic basins, which can be of great territorial extension, making clear the importance of GIS and Remote Sensing in order to provide them. The aim of this study was to develop a methodology for obtaining a georeferenced database to use in hydrological modeling of drainage of the hydrographic basin of the Jaguaribe River, in the state of Ceará.
MATERIAL AND METHODS
Jaguaribe River hydrographic basin characterization
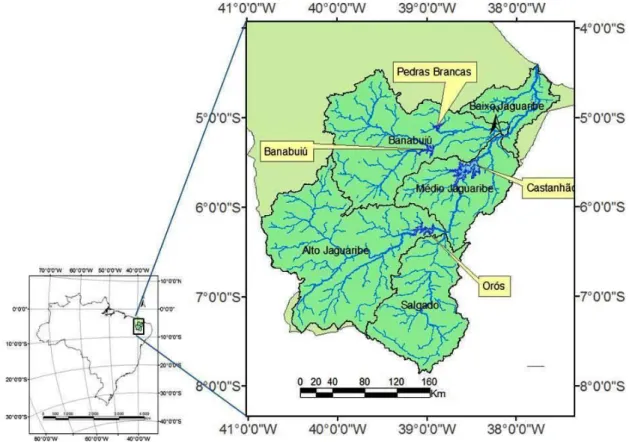
The Jaguaribe is the main river of the state of Ceará, with 633 km and hydrographic basin of 72,645 km2, located between parallels 4°30' and 7°45'S and meridians 37º30' and 41º00'W and subdivided in five regions: Alto Jaguaribe, Salgado, Médio Jaguaribe, Banabuiú and Baixo Jaguaribe (Figure 1).
According to COSTA et al. (2010), there are 11 classes of vegetation in the hydrographic basin of the Jaguaribe River: open shrubby Caatinga; dense shrubby Caatinga; Carrasco; Cerrado; vegetation complex of the coastal zone; arboreal Caatinga; riparian forest with carnauba; maritime evergreen swamp forest; dry forest; Cerradão and rainforests.
In the basin of Jaguaribe there are four climatic types, according to the IBGE (Brazilian Institute of Geography and Statistics) methodology: humid, sub-humid, semiarid and arid, and three types of transition: humid to sub-humid, sub-humid to semiarid and semi-arid to arid. The semiarid climate covers 60% of the basin (GATTO, 1999).
FIGURE 1. Location of the hydrographic basin of the Jaguaribe River.
Digital elevation model and automatic design of hydrographic basin of Jaguaribe River
For the automatic delineation of hydrographic basin of Jaguaribe River, it was obtained the digital elevation model (DEM) from the files provided by the U.S. Geological Survey (UNITED STATES GEOLOGICAL SURVEY, 2009).
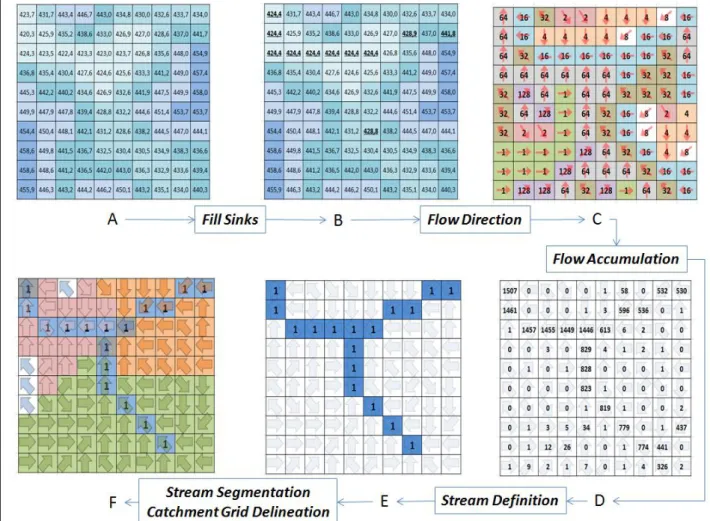
The DEM was submitted to the tools of ArcHydro model developed by the Center for Research in Water Resources (CRWR) of the University of Texas in Austin. The sequence of used tools (Figure 2) was: i) Fill Sinks, which fills the spurious depressions generating the Figure 2B; ii)
FIGURE 2. Steps to the automatic delineation of hydrographic basins.
The matrix data obtained were vectored to polylines and polygons using the tools of Drainage Line Processing and Catchment Line Processing, respectively. The automatically generated hydrography was compared visually with satellite images provided by the National Institute for Space Research (INPE - Instituto Nacional de Pesquisas Espaciais), through the Generation of Images Division (DGI - Divisão de Geração de Imagens) (NATIONAL INSTITUTE FOR SPACE RESEARCH, 2008). For a quantitative evaluation of the procedure it was compared the stretches of rivers obtained in the automatic delineation with lengths of the same stretches measured in high-definition images from Google Earth platform which, according to LUEDELING & BUERKERT (2008), are based on Quickbird satellite images, with submetric resolution. The obtained values were compared with those obtained through the efficiency index of Nash and Sutcliffe (NS) which, according to COLLINSCHONN (2001) cited by SILVA et al. (2008), may range from negative infinity to a unit, this being indicative of the perfect adjustment and the classification of modeling is Appropriate and Good when overcoming 0.75 and Acceptable when the value is between 0.36 and 0.75. The index is calculated by the following equation:
2
i 2 i i
O O
S O 1
NS (1)
In which,
i
O - length of the i-th stretch observed in Google Earth images;
O - average of the lengths measured in the Google Earth platform, and
i
Georeference of the satellite images and mosaic images to the composition of hydrographic basin of Jaguaribe River
The mosaic of images was performed in the ENVI 3.6 program. To reach the hydrographic basin of Jaguaribe River, it was used images of Landsat5, orbits 216 and 217, points 063; 064 and 065 and orbit 218, points 064 and 065. The satellite passage dates were 07/23/2006 to the images of the orbit 216, 07/14/2006 to the images of the orbit 217 and 07/21/2006 to the images of the orbit 218.
The georeference was initiated by band 4 of the central image (orbit 217, point 064). In this band, corresponding to the near IV, the water absorbs more radiation, reflecting very little and appearing in gray level near the black, facilitating the identification of water bodies whose dams coordinates served as control points for image registration. The other bands of this and other images were recorded based on the central image.
The images were georeferenced in SAD69 reference system, projection UTM, Time Zone 24, Southern Hemisphere. The pixel size was 30x30 m. The adjustment of images was performed by the Resampling, Scaling and Translation (RST) algorithm and the resampling by the Cubic Convolution method.
The composition of the mosaic had as its starting point the central image (217/064). The mosaic was setting image by image, first the images with overlap at 217/064 and then the other images. Before the addition of each image, the histogram was adjusted with other images. For the addition of each image to the mosaic, it was performed the fading on the overlap image of 100 pixels, ignoring the pixels of zero value.
Classification of the mosaic of satellite images for use and occupation of land in the hydrographic basin of Jaguaribe River
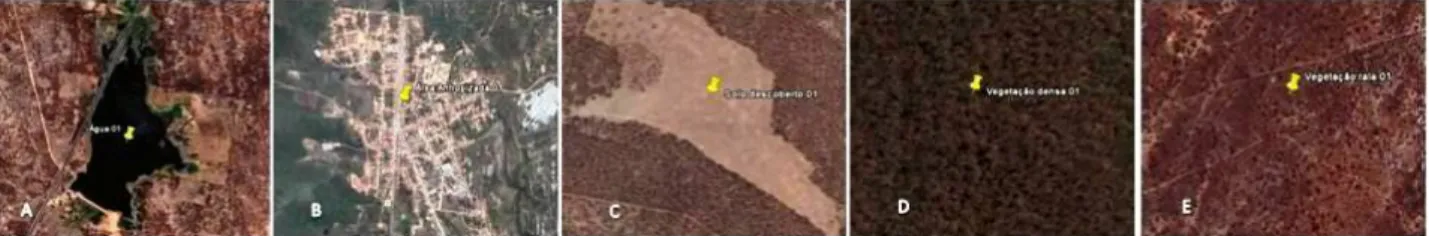
The mosaic was submitted, in the program ENVI 3.6, to the ISODATA method of unsupervised classification. It was defined a minimum of 5 and maximum of 20 classes with a maximum of three iterations. The 20 classes generated, based on prior knowledge of the study area and in comparison with high-resolution images from Google Earth platform 5.0 (Figure 3) were grouped into five classes of land cover: Water, Anthropic area, Uncovered soil, Dense vegetation and Sparse vegetation.
FIGURE 3. Sampling points for the five classes of land cover: A - Water; B - Anthropic area; C - Uncovered soil; D - Dense vegetation, and E) Sparse vegetation.
In Dense vegetation and Sparse vegetation classes, are the soils occupied with native vegetation, especially the hypoxerophytic and hyperxerophytic caatinga, predominant in the region, as described in JACOMINE et al. (1973). In Uncovered soil, are the areas of very little vegetation, or agricultural fallow land. Included in the anthropic area class are the urban and dense areas, degraded by human action or outcrop of matrix rock, typical of litholic neosols, with difficult infiltration. In water are included the bodies of water such as dams and lakes.
N x 100 GA r 1 i ii
(2) n x 100SA ii (3)
r 1 i i i 2 r 1 i i i r 1 i ii x x N x x x N K (4) In which, iix - value of the line i element and columni, of the matrix confusion;
i
x - value of the line isum;
i
x - value of the column isum, and
N - total number of samples.
The global accuracy indicates the percentage of correctly classified samples. The specific accuracy refers to the percentage of correct classification of sample points of a specific class. The Kappa index determines the rate of accuracy or confidence of the classification.
According to SOUSA et al. (2007), the classification performance is interpreted by the value of K as Terrible (K < 0.00), Poor (0.00 < K < 0.20), Average (0.20 < K < 0.40), Good (0.40 < K < 0.60), Very Good (0.60 < K < 0.80) and Excellent (0.80 < K < 1.00).
Soils map
The soil map of the hydrographic basin of Jaguaribe River was elaborated from the record of the soils map of the State of Ceará (BRAZIL, 1972), in a scale of 1:600.000, obtained from JACOMINE et al. (1973) and rescued from the page of the European Commission (EUROPEAN COMISSION, 2007). From the digitalized map in ArcGIS 9.3 software and based on soil texture, the soil types defined by the Soil Conservation Service of the United States Department of Agriculture (SCS-USDA) were obtained. It was considered the soils of type A, sandy texture or sandy and medium; type B, medium texture; type C, medium texture to clay and type D, clay texture.
Obtaining the spatial distribution of the Curve Number for the Hydrographic Basin of Jaguaribe River
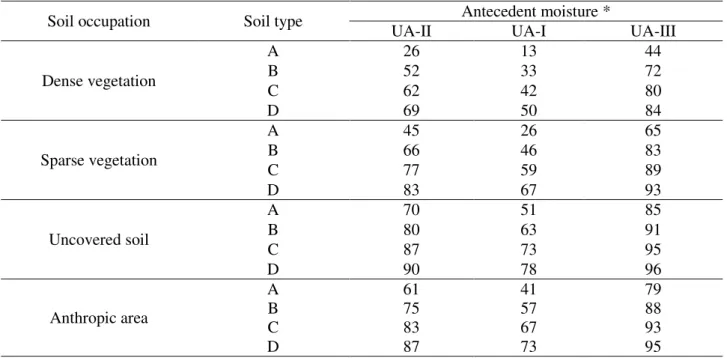
TABLE 1. CN values as a function of soil occupation, soil type and antecedent moisture.
Soil occupation Soil type Antecedent moisture *
UA-II UA-I UA-III
Dense vegetation
A 26 13 44
B 52 33 72
C 62 42 80
D 69 50 84
Sparse vegetation
A 45 26 65
B 66 46 83
C 77 59 89
D 83 67 93
Uncovered soil
A 70 51 85
B 80 63 91
C 87 73 95
D 90 78 96
Anthropic area
A 61 41 79
B 75 57 88
C 83 67 93
D 87 73 95
Adapted from PRUSKI et al. (2004) and TUCCI et al. (2004). * UA-I when the total precipitation in the five days is lower or equal to 35mm; UA-II, higher than 35 and lower or equal to 52,5 mm and UA-III when the accumulated precipitation is higher than 52,5 mm. RESULTS AND DISCUSSION
Automatic delineation
The automatic delineation of the hydrographic basin of the Jaguaribe River was successfully performed and generated inter-basins and natural drains consistent with those presented in the satellite images, as can be seen in Figure 4.
In Figure 4A, it can be observed part of the Landsat-5, orbit 217, Section 063, captured on 07/14/2006, in colorful composition, R5G4B3. In this image it is possible to see the natural drains (1 and 2) and the water dividers (3 and 4). In Figure 4B, is the same image with the overlap of the drainage network and the divisors obtained in automatic delineation, highlighting the same elements. This figure shows a good coincidence of the drainage network and the water dividers, validating the use of SRTM data in automatic delineation of hydrographic basins.
FIGURE 4. Landsat TM satellite image, with passage on 07/14/2006, composition R5G4B3 (A); same image with overlap of drainage network and dividers automatically delineated by means of the ArcHydro extension, at the ArcGIS 9.3 application (B).
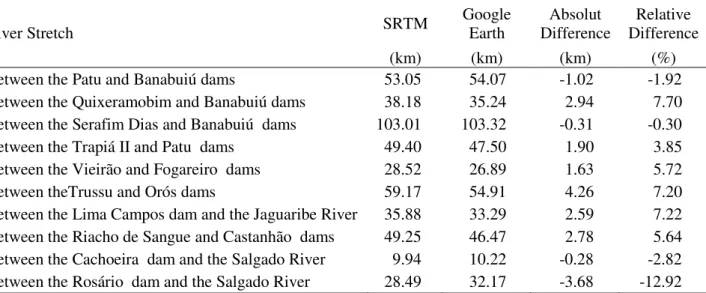
adjustment. In Table 2 are the lengths of different stretches of rivers obtained with the automatic delineation and measured on Google Earth platform in high-definition images. It is noteworthy that other authors have made use of images of Google Earth platform, either for validation of their study, either prior to selection of areas to be studied (SIMARD et al., 2008; VOLGEMANN et al., 2009; TOWNSEND et al., 2009; SURESH et al., 2010).
TABLE 2. Length of the stretches of rivers in the hydrographic basin of Jaguaribe River obtained with the automatic delineation and measured on Google Earth platform.
River Stretch SRTM
Google Earth
Absolut Difference
Relative Difference
(km) (km) (km) (%)
Between the Patu and Banabuiú dams 53.05 54.07 -1.02 -1.92
Between the Quixeramobim and Banabuiú dams 38.18 35.24 2.94 7.70
Between the Serafim Dias and Banabuiú dams 103.01 103.32 -0.31 -0.30
Between the Trapiá II and Patu dams 49.40 47.50 1.90 3.85
Between the Vieirão and Fogareiro dams 28.52 26.89 1.63 5.72
Between theTrussu and Orós dams 59.17 54.91 4.26 7.20
Between the Lima Campos dam and the Jaguaribe River 35.88 33.29 2.59 7.22
Between the Riacho de Sangue and Castanhão dams 49.25 46.47 2.78 5.64
Between the Cachoeira dam and the Salgado River 9.94 10.22 -0.28 -2.82
Between the Rosário dam and the Salgado River 28.49 32.17 -3.68 -12.92
Differences in the lengths of watercourses automatically delineated from the DEM, as shown in Table 2, were also observed in PAZ et al. (2008), SOBRINHO et al. (2010) and LI & WONG (2010) who considered the use of these data for the purpose of hydrological and environmental studies, either due to the easiness of obtaining, either due to the advantage in terms of cost-effectiveness, considering other sources of DEM. However, they warned the need of a preprocessing aiming the adaptation of the DEM to a network of pre-existing drainage or the refinement of DEM.
The automatic delineation of the Jaguaribe basin resulted in 9440 inter-basins and stretches of rivers. Table 3 shows the descriptive statistics of inter-basins generated for parameters area (AIB);
perimeter (PIB); length of main course (LCIB), and slope of main course (SoIB). From the 9440
generated inter-basins, 227 belong to the hydrographic basin of the Pedras Brancas dam, 1811 to the Banabuiú, 2633 to the Castanhão, 3263 to the Orós and the remaining inter-basins, the area downstream of the reservoirs. The largest area accounted for 65.2 km2, and over 90% of the inter-basins showed
areas lower than 15.3 km2.
TABLE 3. Descriptive statistics of inter-basins components of the hydrographic basin of Jaguaribe River.
Descriptive Statistics
IB
A
(ha)
IB
P
(m)
CIB
L
(m)
IB
So
(m m-1)
Maximum 6520.67 73600.00 25144.4 0.16960
Inter-basin-ID 17258 4611 6971 13002
Minimum 0.85 368.00 92.0 0.00001
Inter-basin-ID 3552 3552 6273 3584
Percentile 25% 425.7392 11960.0 1286.6 0.00222
Percentile 50% 636.4928 15824.0 2459.4 0.00433
Percentile 75% 1016.5264 20792.0 4107.1 0.00797
Percentile 90% 1530.2912 26128.0 6296.6 0.01472
Soil cover
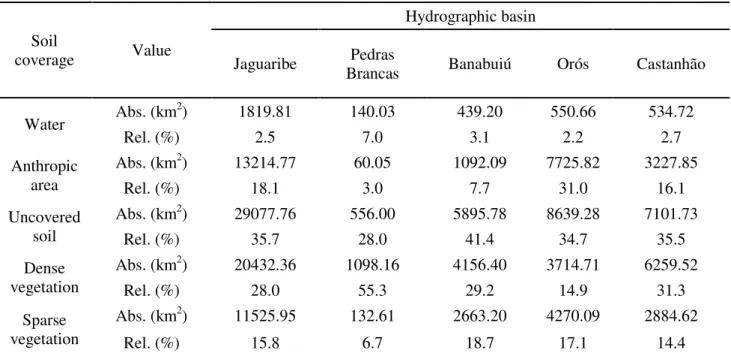
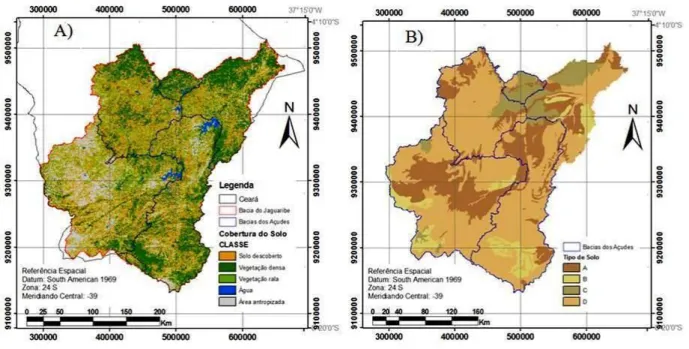
The relative distribution of soil cover in hydrographic basins of Jaguaribe River and the Pedras Brancas, Banabuiú, Orós and Castanhão dam is exposed in Table 4. For the same basins, the spatial distribution of the coverage can be seen in Figure 5A.
The hydrographic basin of the Pedras Brancas dam presented the highest percentage of coverage by dense vegetation, and also has the lowest percentage of anthropic area and uncovered soil. In contrast, the hydrographic basin of Orós dam shows the lowest percentage of vegetation (32%) and the highest percentage of anthropic area (31%), including the shallow soils with rock outcrop and without vegetal coverage or this being very sparse.
Another important aspect is the date of obtaining the classified images, from 07/14 to 07/26/2006, after the rainy season that extends from February to May. So, in this transition period, the caatinga, predominant in the basin of Jaguaribe, begins to lose foliage, as well as plants grown in the rainy season are at the end of harvest. As for the Caatinga vegetal coverage, RODRIGUES et al. (2009) consider the month of July representative of the rainy season and the month of October as the representative of the dry season.
TABLE 4. Absolute and percentage distribution of soil coverage in hydrographic basins of Jaguaribe River and the Pedras Brancas, Banbauiú, Orós and Castanhão dam.
Soil
coverage Value
Hydrographic basin Jaguaribe Pedras
Brancas Banabuiú Orós Castanhão
Water Abs. (km
2) 1819.81 140.03 439.20 550.66 534.72
Rel. (%) 2.5 7.0 3.1 2.2 2.7
Anthropic area
Abs. (km2) 13214.77 60.05 1092.09 7725.82 3227.85
Rel. (%) 18.1 3.0 7.7 31.0 16.1
Uncovered soil
Abs. (km2) 29077.76 556.00 5895.78 8639.28 7101.73
Rel. (%) 35.7 28.0 41.4 34.7 35.5
Dense vegetation
Abs. (km2) 20432.36 1098.16 4156.40 3714.71 6259.52
Rel. (%) 28.0 55.3 29.2 14.9 31.3
Sparse vegetation
Abs. (km2) 11525.95 132.61 2663.20 4270.09 2884.62
Rel. (%) 15.8 6.7 18.7 17.1 14.4
TABLE 5. Confusion matrix for evaluation of unsupervised classification, ISODATA method, of the mosaic of Landsat images covering the Jaguaribe River hydrographic basin.
Field truthing
Total of Lines
Water Anthropic area Uncovered
Soil
Dense Vegetation
Sparse Vegetation
C
las
si
fi
ca
tion
Water 8 8
Anthropic area 1 8 4 3 16
Uncovered soil 1 5 5 11
Dense vegetation 1 1 10 2 14
Sparse vegetation 1 1
Table 5 consists of confusion matrix generated for the evaluation of the classification. The global accuracy was 62%, this being the percentage of image elements which are classified according to the sample images captured in Google Earth. The specific accuracy (SA) refers to the percentage of items classified in a class in which it really belongs. For the Water class, the SA is equal to 100%. Sparse vegetation had the SA equal to 0%. The remaining SAs were 71.4% of dense vegetation, 50% for the anthropic area and 45.5% for uncovered soil.
The Kappa coefficient (K) resulting (0.53) defines classification as "Good", allowing the use of classification, especially considering that the dates of Landsat and Google Earth images are not the same and that the classes for which the SA was higher correspond to those less variable throughout the year, for example, the category "Water" which samples were obtained from dam or water bodies that remain covered by water for much of the year. The anthropic areas were sampled mainly in cities and so remain. Moreover, the classes with lower SA vary greatly throughout the year. For example, from the 11 elements of the image classified as "Uncovered soil", five are in reality "Sparse vegetation", and it is perfectly possible in a region of hyperxerophytic caatinga, that the class "Sparse vegetation", in the dry period, can be classified as "Uncovered soil."
Soil type
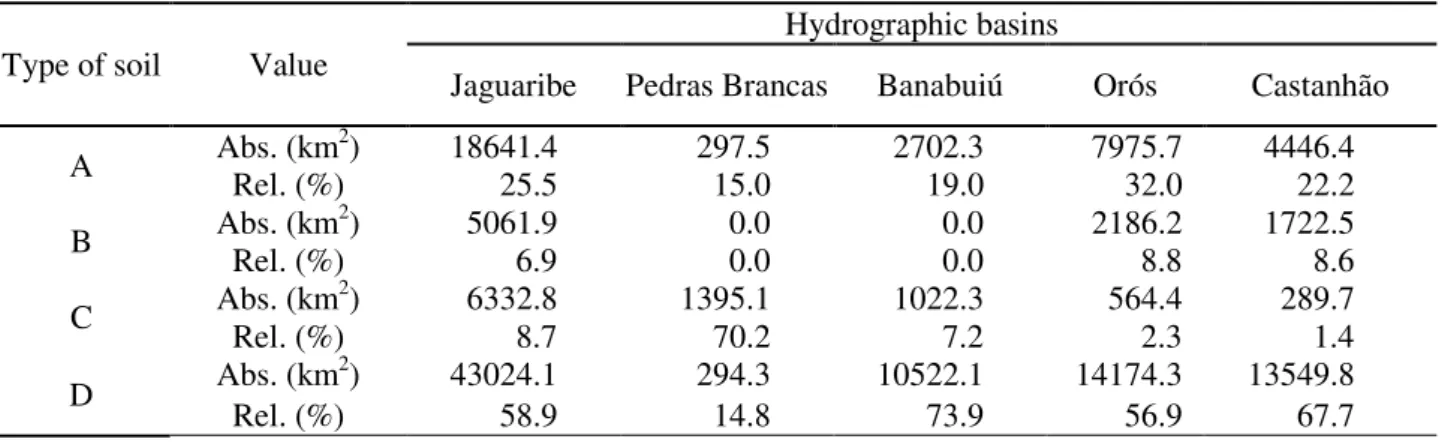
After the digitalization of the soils map was possible to establish the map of soil groups as defined by the Soil Conservation Service of the United States Department of Agriculture (SCS-USDA), as the permeability: Group A, soils with high infiltration; Group B - moderate infiltration; group C - low infiltration; and Group D - very low infiltration. In Group A, it was considered the sandy texture and sandy and medium soils; in Group B, the medium texture; in Group C the medium texture to clay; and in Group D the clay texture. The spatial distribution of soil groups to Jaguaribe River hydrographic basins and hydrographic basins of the four reservoirs are shown in Figure 5B. In Table 6 are the absolute and percentage distribution in the Jaguaribe River hydrographic basins and the four reservoirs.
TABLE 6. Absolute and relative distribution of soils group in Jaguaribe River hydrographic basins and Pedras Brancas, Banbauiú, Orós and Castanhão dams.
Type of soil Value
Hydrographic basins
Jaguaribe Pedras Brancas Banabuiú Orós Castanhão
A Abs. (km2) 18641.4 297.5 2702.3 7975.7 4446.4
Rel. (%) 25.5 15.0 19.0 32.0 22.2
B Abs. (km2) 5061.9 0.0 0.0 2186.2 1722.5
Rel. (%) 6.9 0.0 0.0 8.8 8.6
C Abs. (km2) 6332.8 1395.1 1022.3 564.4 289.7
Rel. (%) 8.7 70.2 7.2 2.3 1.4
D Abs. (km2) 43024.1 294.3 10522.1 14174.3 13549.8
FIGURE 5. Spatial distribution of soil coverage (A) and soil type (B) in the Jaguaribe River hydrographic basin.
Spatial distribution of the Curve Number
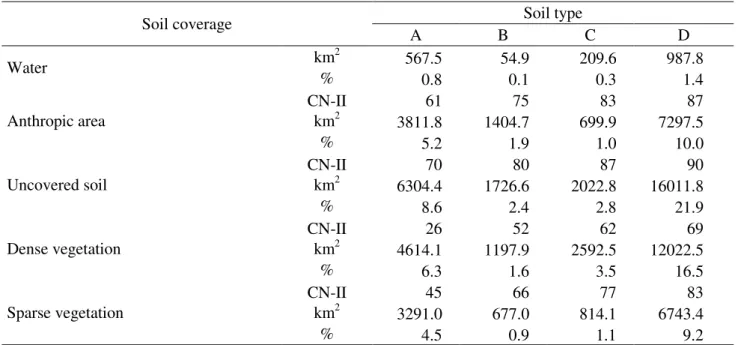
The spatial distribution of the CN values, for the antecedent moisture condition II (UA-II) is shown in Figure 6 and the absolute and percentage distribution CN values, depending on coverage and type of soil in Table 7. The largest CN found was 94 to uncovered soil with soil type D (21.9%), followed by dense vegetation with the same soil type (16.5%).
TABLE 7. Absolut and percentage distribution of CNvalues, for the antecedent moisture condition II, in the Jaguaribe River hydrographic basin.
Soil coverage Soil type
A B C D
Water km
2
567.5 54.9 209.6 987.8
% 0.8 0.1 0.3 1.4
Anthropic area
CN-II 61 75 83 87
km2
3811.8 1404.7 699.9 7297.5
% 5.2 1.9 1.0 10.0
Uncovered soil
CN-II 70 80 87 90
km2
6304.4 1726.6 2022.8 16011.8
% 8.6 2.4 2.8 21.9
Dense vegetation
CN-II 26 52 62 69
km2
4614.1 1197.9 2592.5 12022.5
% 6.3 1.6 3.5 16.5
Sparse vegetation
CN-II 45 66 77 83
km2 3291.0 677.0 814.1 6743.4
% 4.5 0.9 1.1 9.2
Under conditions in which the study was done, the Jaguaribe River basin had the highest percentage (16.5%) of type D uncovered soil. These conditions, always worth emphasizes, reflect the date of obtainment of the Landsat digital image and allocation of soil type which, in this case, considered only the soil texture. BESKOW et al. (2009) recommended considering the infiltration rate of water as the main criterion for choosing the group of tropical soils, since the structure interferes making the soil with high clay content very permeable. More reasonable results may be obtained considering other characteristics such as soil permeability and depth discrimination of the type of the soil. It should also be considered the seasonality characteristic of the caatinga biome as the soil coverage.
For use in hydrological models in the semiarid, different maps of soil coverage may be adopted, variable throughout the year, reflecting the reality of this environment. For this, the satellite images must be obtained with passage dates distributed throughout the year. To map the type of soil, factors such as depth and permeability must be considered.
CONCLUSIONS
The presented methodology allows obtaining fast, easy and low cost of spatialization of the natural drainage network and its drainage areas, soil coverage, soil type and the curve number to be used in hydrological models.
In GIS, multiple data sources are added to obtain information needed to process modeling. Thus, satellite imagery, digital elevation models, and thematic maps constitute the input data to obtain new data, more suitable for other purposes, such as input to computational hydrologic models.
ACKNOWLEDGEMENTS
REFERENCES
ALVES, J.J.A.; ARAÚJO, M.A.; NASCIMENTO, S.S. Degradação da Caatinga: uma investigação ecogeográfica. Caatinga, Mossoró, v. 22, n.3, p. 126-135, 2009.
BESKOW, S.; MELLO, C.R.; COELHO, G.; SILVA, A.M.; VIOLA, M.R. Estimativa do escoamento superficial em uma bacia hidrográfica com base em modelagem dinâmica e distribuída. Revista
Brasileira de Ciências do Solo, Viçosa-MG, v.33, n.1, p.169-178, 2009.
BRASIL. Ministério da Agricultura/Ministério do Interior. Mapa Exploratório - Reconhecimento de Solos do Estado do Ceará. Recife: SUDENE, 1972. 1 mapa, color. Escala 1:600000.
CAMPOS, J.N.B. A gestão das águas e o desenvolvimento do Estado do Ceará: uma perspectiva histórica. T&C Amazônia, Manaus, n.9, p.25-31, 2006.
CASTELLETTI, A.; SONCINI-SESSA, R. Coupling real-time control and sócio-economic issues in participatory river basin planning. Enviromnmental Modelling & Software, v. 22, p 1114-1128, 2007. Disponível em: <www.sciencedirect.com>. Acesso em: 6 jul. 2007.
COSTA, C.A.G.; TEIXEIRA, A.S.; ANDRADE, E.M.; LUCENA, A.M.P.; CASTRO, M.A.H. Análise da influência vegetacional na altimetria dos dados SRTM em bacias hidrográficas do semiárido. Ciência Agronômica, Fortaleza, v.40, n.2, p.222-230, 2010.
EMBRAPA. Centro Nacional de Pesquisa de Solos. Sistema brasileiro de classificação de solos. Brasília: Serviço de Produção de Informação, 2006. 306 p.
EUROPEAN COMISSION. The soil maps of Latin America & Caribbean Islands. Disponível em <http://eusoils.jrc.ec.europa.eu/esdb_archive/EuDASM/latinamerica/maps/br13007_so.htm>. Acesso em: 2 jun. 2007.
FU, G. A fuzzy optimization method for multicriteria decision making: an application to reservoir flood control operation. Disponível em www.sciencedirect.com. Acesso em 9 ago. 2007. Expert Systems with Applications, New York, v.34, p.145-149, 2008.
GATTO, L.C.S. Diagnóstico ambiental da bacia do rio Jaguaribe: diretrizes gerais para a ordenação territorial. Salvador: IBGE, Diretoria de Geociências e 1ª Divisão de Geociências do Nordeste - DIGEO 1/NE.1, 1999. 77 p.
INSTITUTO NACIONAL DE PESQUISAS ESPACIAIS. Catálogo de imagens. Disponível em: <http://www.dgi.inpe.br/CDSR/>. Acesso em: 15 maio 2008.
JACOMINE, P.K.T.; ALMEIDA, J.C.; MEDEIROS, L.A.R. Levantamento exploratório:
reconhecimento de solos do Estado do Ceará. Recife: EMBRAPA, DPP, SUDENE, 1973. 2v. 830 p. (Boletim Técnico, 28, Série Pedológica, 16).
KROL, M.S.; BRONSTERT, A. Regional integrated modelling of climate change impacts on natural resources and resource usage in semi-arid Northeast Brazil. Environmental Modelling & Software, Oxford, v.22, n.2, p.259-268, 2007.
LI, J.; WONG, D.W. Effects of DEM sources on hydrologics applications. Computers, Environment and Urban Systems, New York, n.34, p.251-261, 2010.
LUEDELING, E.; BUERKERT, A. Typology of oases in northern Oman based on Landsat and SRTM imagery and geological survey data. Remote Sensing of Environment, New York, n.112, p.1181-1195, 2008.
QUEIROZ, L.P.; RAPINI, A.; GUILETTI, A.M. (Ed.). Rumo ao amplo conhecimento da
biodiversidade do Semi-Árido brasileiro. Brasília: Ministério da Ciência e Tecnologia. 2006. Disponível em: <www.cgee.org.br/atividades/ redirect.php?idProduto=2981>. Acesso em: 12 out. 2008.
RODRIGUES, J.O.; ANDRADE, E.M.; TEIXEIRA, A.S.; SILVA, B.B. Sazonalidade de variáveis biofísicas em regiões semiáridas pelo emprego do sensoriamento remoto. Engenharia Agrícola, Jaboticabal, v.29, n.3, p.452-465, 2009.
SILVA, P.M.O.; MELLO, C.R.; SILVA, A.M.; COELHO, G. Modelagem da hidrógrafa de cheia em uma bacia hidrográfica da região Alto Rio Grande. Revista Brasileira de Engenharia Agrícola e Ambiental, Campina Grande, v.12, n.3, p.258-265, 2008.
SIMARD, M.; RIVERA-MONROY, V.H.; MANCERA-PINETA, J.E.; CASTAÑEDA-MOYA, E.; TWILLEY, R.R. A systematic method for 3D mapping of mangrove forest based on Shuttle Radar Topography Mission elevation data, ICEsat/GLAS waveforms and field data: Application to Ciénaga Grande de Santa Marta, Colombia. Remote Sensing of Environment, New York, n.112, p.2131-2144, 2008.
SOBRINHO, T.A.; SILVEIRA, P.T.S.; RODRIGUES, D.B.B.; AYRES, F.M. Delimitação automática de bacias hidrográficas utilizando dados SRTM. Engenharia Agrícola, Jaboticabal, v.30, n.1, p.46-57, 2010.
SOUSA, B.F.S.; TEIXEIRA, A.S.; LEÃO, R.A.O.; COSTA FILHO, A.B. Uso do solo da bacia hidrográfica do Alto Piauí através de imagens de satélite CBERS. Revista Ciência Agronômica, Fortaleza, v.38, n.4, p.327-334, 2007.
SURESH, G.; RAMESH, B.; KAVITHA, K.; RAVICHANDRAN, N.; SURESH, A.;
GOPALAKRISHNAN, V.; SIVA, G.V. Preliminary screening of antibacterial compounds from Palar River basin flora. Journal of Phytology, v.2, n.2, p.24-29, 2010.
TEXAS A&M UNIVERSITY. Hydrologic modeling inbentory website.Disponível em: <http://hydrologicmodels.tamu.edu>. Acesso em: 2 ago. 2009.
TOWNSEND, P.A.; LOOKINGBILL, T.R.; KINGDON, C.C.; GARDNER, R.H. Spatial pattern analysis for monitoring protected areas. Remote Sensing of Environment, New York, n.113, p.1410-1420, 2009.
TUCCI, C.E.M. (Org.) Hidrologia – ciência e aplicação. 3.ed. Porto Alegre: UFRGS/ABRH, 2004. UNITED STATES GEOLOGICAL SURVEY. Index of/srtm/version2_1/SRTM3/South_America.
Disponível em < http://dds.cr.usgs.gov/srtm/version2_1/SRTM3/South_America/ >. Acesso em: 24 ago. 2009.