Regulated by PKC Delta in a Dietary Model of
Nonalcoholic Steatohepatitis
Michael W. Greene1,2,3*, Christine M. Burrington3, Darin T. Lynch3, Samantha K. Davenport4, Andrew K. Johnson3, Melissa J. Horsman3, Saleem Chowdhry5, Jian Zhang2, Janet D. Sparks6, Paul C. Tirrell5
1Boshell Diabetes and Metabolic Disease Research Program, Auburn University, Auburn, Alabama, United States of America,2College of Human Sciences, Auburn University, Auburn, Alabama, United States of America,3Bassett Research Institute, Bassett Medical Center, Bassett Healthcare Network, Cooperstown, New York, United States of America,4Department of Pathology, Bassett Medical Center, Bassett Healthcare Network, Cooperstown, New York, United States of America,5Department of Internal Medicine, Bassett Medical Center, Bassett Healthcare Network, Cooperstown, New York, United States of America,6University of Rochester Medical Center, School of Medicine and Dentistry, Rochester, New York, United States of America
Abstract
Steatosis, oxidative stress, and apoptosis underlie the development of nonalcoholic steatohepatitis (NASH). Protein kinase C delta (PKCd) has been implicated in fatty liver disease and is activated in the methionine and choline-deficient (MCD) diet model of NASH, yet its pathophysiological importance towards steatohepatitis progression is uncertain. We therefore addressed the role of PKCdin the development of steatosis, inflammation, oxidative stress, apoptosis, and fibrosis in an animal model of NASH. We fed PKCd2/2mice and wildtype littermates a control or MCD diet. PKCd2/2primary hepatocytes
were used to evaluate the direct effects of fatty acids on hepatocyte lipid metabolism gene expression. A reduction in hepatic steatosis and triglyceride levels were observed between wildtype and PKCd2/2mice fed the MCD diet. The hepatic
expression of key regulators ofb-oxidation and plasma triglyceride metabolism was significantly reduced in PKCd2/2mice
and changes in serum triglyceride were blocked in PKCd2/2 mice. MCD diet-induced hepatic oxidative stress and
hepatocyte apoptosis were reduced in PKCd2/2mice. MCD diet-induced NADPH oxidase activity and p47phoxmembrane
translocation were blunted and blocked, respectively, in PKCd2/2mice. Expression of pro-apoptotic genes and caspase 3
and 9 cleavage in the liver of MCD diet fed PKCd2/2 mice were blunted and blocked, respectively. Surprisingly, no
differences in MCD diet-induced fibrosis or pro-fibrotic gene expression were observed in 8 week MCD diet fed PKCd2/2
mice. Our results suggest that PKCdplays a role in key pathological features of fatty liver disease but not ultimately in fibrosis in the MCD diet model of NASH.
Citation:Greene MW, Burrington CM, Lynch DT, Davenport SK, Johnson AK, et al. (2014) Lipid Metabolism, Oxidative Stress and Cell Death Are Regulated by PKC Delta in a Dietary Model of Nonalcoholic Steatohepatitis. PLoS ONE 9(1): e85848. doi:10.1371/journal.pone.0085848
Editor:Anna Alisi, Bambino Gesu’ Children Hospital, Italy
ReceivedSeptember 18, 2013;AcceptedDecember 3, 2013;PublishedJanuary 15, 2014
Copyright:ß2014 Greene et al. This is an open-access article distributed under the terms of the Creative Commons Attribution License, which permits unrestricted use, distribution, and reproduction in any medium, provided the original author and source are credited.
Funding:The authors have no support or funding to report.
Competing Interests:The authors have declared that no competing interests exist. * E-mail: mwgreene@auburn.edu
Introduction
Non-alcoholic fatty liver disease (NAFLD) is characterized by the accumulation of lipids in the liver (steatosis) and may be a benign condition [1]. Its prevalence in the middle-aged segment of the population on a western diet is approximately 46% and of this group 30% are suggested to have non-alcoholic steatohepatitis (NASH) [2]. The prevalence of NAFLD in nonobese subjects has been reported to be 7.4% and 8.7% in the United States and India, respectively [3,4]. The exact etiology for transformation of steatosis to NASH remains obscure; however, a classical ‘‘two-hit’’ hypothesis has been proposed to explain progression [5]. Steatosis constitutes the ‘‘first hit.’’ Proinflammatory cytokines (e.g.tumor necrosis factor-alpha, TNFa), oxidative stress, and lipid peroxida-tion constitute the ‘‘second hit’’ leading to NASH [1,6]. Recently an alternative ‘‘non triglyceride lipotoxicity’’ hypothesis has been put forward implicating metabolites of free fatty acids in hepatocyte injury and development of NASH [7].
The classical (a,b, andc) and novel (d,e, andh) protein kinase C (PKC) isoforms are intracellular signaling molecules activated by lipids [8]. Lipid infusion activates muscle and hepatic novel PKC isoforms (PKCd, PKCe, and PKCh) but not that of classical or atypical PKC isoforms [9–11]. The PKCdisoform can regulate lipid metabolism in the heart [12] and hepatic glucose production through a possible gut-brain-liver axis [13], suggesting a role for PKCdin metabolic disease. Further, recent studies demonstrating that the PKCd isoform regulates high fat diet-induced hepatic steatosis and the expression of hepatic lipogenic genes [14,15] suggest that PKCdplays an important role in lipid-associated liver disease.
model of NASH that PKCdknockdown blocked JNK activation and blunted palmitate-induced apoptosis [18]. In the present study, we questioned the role of PKCd in regulating key pathophysiological features of NASH using the MCD diet model of NASH.
Materials and Methods
Animals
Heterozygous PKCd2/+
mice in a mixed 129SX16C57BL/6 background were backcrossed up to six times with C57BL/6NHsd mice from Harlan Laboratories (Somerville, NJ) and then interbred to generate PKCd2/2 mice and wildtype littermates
(WT). PKCd genotyping was performed as previously described [19]. Mice were housed 2–4 per cage in Thoren units in the Bassett Research Institute, an AAALAC accredited animal facility, in light/dark (12L:12D), temperature 22uC, and humidity controlled rooms. Mice were provided with standard laboratory chow and water ad libitum. Six to eight week old PKCd+/+
and PKCd2/2mice (n = 6–8) were placed on a control or MCD diet
(MP Biomedical, Cat#960441 or#960439, respectively) for four or eight weeks. No procedures were undertaken that caused more than minimal pain, distress, or discomfort. Mice were euthanized by inhalation of CO2. Blood and tissue samples were taken and processed as previously described [18]. This study was carried out in strict accordance with the recommendations in the Guide for the Care and Use of Laboratory Animals of the National Institutes of Health. The protocol was approved by the Mary Imogene Bassett Hospital Institutional Animal Care and Use Committee (Protocol Number: 11–36).
Immunobloting and Antibodies
Frozen liver tissue was processed to generate total cell lysate extracts and membrane and cytosolic protein extracts as previously described [18,20]. Polyclonal antibodies to phospho-PKCd
(Thr505), phospho-PKCd (Ser643), phospho-PERK (Thr980), JNK1/2, caspase 9 (mouse specific), caspase 3, cleaved caspase 3 (Asp175), and monoclonal antibodies to phospho-JNK (Thr183/ Tyr185) and IRE1a were from Cell Signaling Technology (Danvers, MA). Rabbit monoclonal antibodies to p67phox and p91phox (NOX2) were from Epitomics (Burlingame, CA). Poly-clonal antibodies to p24phox and p47phox were from EMD Millipore (Billerica, MA).
Polyclonal antibodies to PKCd(C-17), PKCe(C-15), PKCh (C-18), PKCa (C-20), and p22phox (FL-195) and monoclonal antibodies to GAPDH (6C5) were from Santa Cruz Biotechnology (Santa Cruz, CA). A polyclonal antibody to calnexin and monoclonal antibody to PKCd were from Calbiochem/EMD Biosciences (La Jolla, CA). Monoclonal antibodies toatubulin and BiP/GRP78 were from Sigma-Aldrich (St. Louis, MO) and BD Biosciences (San Jose, CA), respectively. Goat anti-mouse and anti-rabbit peroxidase conjugated antibodies were from Sigma (St. Louis, MO). ECL Plus from GE Healthcare was used for detection.
Primary Hepatocyte Culture
Mice were anesthetized with an intraperitonal injection of pentobarbital (80 mg/kg). Perfusion was performed with well-oxygenated, calcium free Hank’s buffer containing 5 mM glucose, 1.5 mM Na lactate, 0.15 mM Na pyruvate, 0.1 mM EGTA, 10 mM HEPES, 100 IU/ml Penicillin and 0.1 mg/ml Strepto-mycin maintained at 37uC, followed by perfusion with 0.05% collagenase H (Roche, Indianapolis, IN) in low-glucose DMEM (Life Technologies Corporation, Carlsbad, CA) containing 10 mM
HEPES, 40 mM NaHCO3and Pen/Strep. The hepatocytes were isolated from non-parenchymal cells using buffered Percoll and cultured in Waymouth’s media (Life Technologies Corporation, Carlsbad, CA) containing 5% bovine growth serum for 2 h prior to treatment in serum free Waymouth’s media for 18 h with BSA-complexes of 0.4 mM of palmitate or oleate or BSA prepared as previously described [18].
Liver Tissue Histological and Lipid Analysis
Paraffin embedded sections were stained with hematoxylin and eosin or Masson’s trichrome and then examined in a blinded fashion by a board certified pathologist, grading for steatosis, inflammation, and fibrosis as previously described [18]. Sirius Red staining of paraffin embedded sections was scored in a blind fashion using the METAVIR scoring system [21]. Lipids were extracted from approximately 100 mg of ground frozen liver tissue as described by Bligh and Dyer [22] Triglycerides were assayed using a kit from Thermo Scientific (Rockford, IL) and normalized to the protein content measured using the BCA protein assay reagent (Thermo Scientific/Pierce, Rockford, IL).
Serum Metabolic Parameters
Alanine aminotransferase (ALT) and triglycerides were assayed as previously described [18]. Insulin was assayed using the Ultra Sensitive Mouse Insulin ELISA Kit from Crystal Chem Inc (Downers Grove, IL). NEFA was assayed using the kit from Zen-Bio, Inc. (Research Triangle Park, NC).
Liver Oxidative Stress Analysis
Liver samples were flash frozen and ground in liquid nitrogen. Ground tissue (50–100 mg) was homogenized on ice in PBS pH 7.4 buffer. The homogenate was tested for thiobarbituric acid reactive substances (TBARS) (ZeptoMetrix, Buffalo, NY) following manufacturer’s instructions. Protein content was determined using the Pierce BCA Protein assay (Thermo Scientific/Pierce, Rock-ford, IL). TBARS units (nmoles/ml) were normalized to protein concentration. 4-Hydroxy-2-nonenal (4-HNE) staining was per-formed using a 4-HNE (HNE11-S) antibody (Alpha Diagnostics, San Antonio, TX). Five random fields per slide were scored and the results were determined from an average of those scores. NADPH oxidase activity was measured by the lucigenin enhanced chemiluminescence method. Briefly, fifty micrograms of mem-brane protein fractionated from frozen liver as previously described [18] was added to Krebs-Ringer buffer, pH 7.0, containing 1 mM EGTA, 150 mM sucrose, 5mM lucigenin, and
100mM NADPH. Photon emission in terms of relative light units
was measured in a luminometer every 30 s for 5 min. There was no measurable activity in the absence of NADPH. Superoxide anion production was expressed as relative chemiluminescence (light) units (RLU)/mg protein. Protein content was measured using the BCA protein assay reagent (Thermo Scientific/Pierce, Rockford, IL).
Apoptosis Analysis
RNA isolation and qRT-PCR
TRIZOL reagent (Sigma-Aldrich, St. Louis, MO) was used to isolate total RNA from frozen liver tissue and cultured primary hepatocytes. RNA quantity and quality was assessed using a bioanalyzer (Agilent 2100Bioanalyze, Agilent Technologies, Santa Clara, CA) prior to reverse transcription using the RT2 First Strand Kit (Qiagen, Valencia, CA). PCR was performed in 384 well plates with the RT2SYBR Green ROX qPCR Mastermix (Qiagen, Valencia, CA) with gene specific primers (SABiosciences, Fredrick, MD) using an Applied Biosystems 7900HT Sequence Detection System (Life Technologies Corporation, Carlsbad, CA) with a Corbett Robotics CAS-1200 precision liquid handling system for plate set-up. Melting curve analysis was performed to verify product purity. Threshold values of 0.023 and 0.02 were used for the analysis of liver and hepatocyte gene expression, respectively.GAPDHand the geometric mean ofACTB,GAPDH,
GUSB, and HPRT were used to normalize DCt values for hepatocyte and liver gene expression, respectively.
Statistical analysis
All data are presented as the mean61 standard error (S.E.). Statistical significance was determined by Student’s t-test or the Mann-Whitney Rank Sum test (a= 0.05) or a one- or two-way repeated measures analysis of variance (a= 0.05) using the XLSTAT 2009 program (Addinsoft, New York, NY). Pair-wise comparisons were made using Tukey’s test (a= 0.05).
Results
Effect of MCD diet on body and organ weights, serum metabolites and PKCdactivation
We observed in a prior study that hepatic activation and protein content of PKCd, but not PKCaor PKCe, is elevated during the development of steatohepatitis in MCD diet fed mice [18]. To investigate the role of PKCdin the development of steatohepatitis in MCD diet fed mice, PKCd2/2mice and WT littermates were
fed a control or MCD diet for four weeks. As expected PKCd
protein expression was not detected in the liver of PKCd2/2mice
fed a control or MCD diet (Fig. 1A). In agreement with our previous study, hepatic activation and protein content of PKCd
was elevated in MCD diet fed WT mice (data not shown). Consistent with the known effect of MCD diet feeding, WT and PKCd2/2mice lost body and liver weight, had lower serum levels
of glucose and insulin, and higher serum levels of alanine aminotransferase (ALT) (Table 1). However, an,50% reduction in serum levels of insulin in control fed PKCd2/2mice compared
to control fed WT mice was observed. Interestingly, MCD diet-induced changes in fat pad weight and fat pad and liver weight normalized to body weight were not observed in PKCd2/2mice.
Also, MCD diet-induced changes in serum triglyceride (TG) and non-esterified fatty acids (NEFA) were not observed in PKCd2/2
mice. In contrast, no difference was observed in MCD diet-induced changes in serum levels of ALT in PKCd2/2mice. The
changes in body and organ weights observed in female WT and PKCd2/2 mice were similar to those in male mice (Table 2),
suggesting that the effect of the MCD diet was not sex dependent.
Effect of MCD diet on steatosis and lipid metabolism gene expression
Histological examination of livers from mice fed a MCD diet for four weeks showed a 30% reduction in steatosis in PKCd2/2mice
compared to WT mice (p= 0.09) (Fig. 1B). When steatosis was examined by frequency of the steatosis score (Fig. 1C) or by
Correspondence Analysis (data not shown), the qualitative pattern of steatosis scores from PKCd2/2mice revealed clear differences
compared to WT mice. Consistent with this result, a reduction in liver TG was observed in female and male PKCd2/2mice (69%
and 61%, respectively) compared to WT mice (Fig. 1C and 1D). To determine whether hepatic genes involved in steatosis were differentially regulated in WT and PKCd2/2mice, we examined
the effect of the MCD diet on hepatic genes involved in lipid metabolism. Stearoyl-coenzyme A desaturase 1 (SCD-1) gene expression was significantly decreased in both WT and PKCd2/2
mice (Fig. 1F). However, sterol-regulatory element binding protein-1 (SREBP-1) was significantly decreased only in MCD diet fed PKCd2/2 mice but not WT mice. The expression of
peroxisome proliferator-activated receptor a (PPARa), a key regulator ofb-oxidation in mice, and its downstream target acyl-coenzyme A oxidase (ACOX1), were significantly reduced in MCD diet fed PKCd2/2 mice but not WT mice. Microsomal
triglyceride transfer protein (MTTP) expression in MCD diet fed PKCd2/2mice was significantly reduced compared to control fed
WT mice, yet was induced in MCD diet. Consistent with changes in MTTP expression, a significant reduction in gene expression of apolipoprotein (Apo) C-III, another key determinant of plasma triglyceride metabolism, was observed in MCD diet fed PKCd2/2
mice but not WT mice, suggesting that secreted lipoproteins in PKCd2/2mice may be more efficiently lipolyzed.
Because differences in steatosis, TG, and hepatic lipid metabolism gene expression were observed between WT and PKCd2/2 mice, we questioned whether fatty acids may have a
direct effect on lipid metabolism gene expression independent of a deficiency in methionine and choline. To address this question, we treated primary hepatocytes isolated from WT and PKCd2/2
mice with control or fatty acid containing media and determined lipid metabolism gene expression. Oleate containing medium significantly increased the expression of SREBP-1 and SREBP-2 in hepatocytes from WT mice but not PKCd2/2mice (Fig. 1G).
Although the fatty acids had no effect on SCD-1 gene expression, a significant reduction in ACC1 was observed in oleate treated hepatocytes from WT mice but not PKCd2/2mice. Palmitate and
oleate-induced Apo C-III expression in hepatocytes from WT mice was blocked and blunted, respectively, in hepatocytes from PKCd2/2mice. A significant reduction was observed in MTTP
gene expression in oleate treated hepatocytes isolated from PKCd2/2mice but not WT mice. Taken together, these results
are consistent with the hypothesis that PKCd plays a role in hepatic lipid metabolism.
Effect of MCD diet on histological scoring of inflammation and inflammation gene expression
Histological examination of livers from mice fed a MCD diet for four weeks showed an approximately 42% reduction in inflam-mation score in PKCd2/2mice compared to WT mice (Fig. 2A).
However, no differences were found in the hepatic expression of TNFa, macrophage inflammatory protein 1 alpha (MIP1a/ CCL3), plasminogen activator inhibitor-1 (PAI-1), interleukin-1 alpha (IL1a), interleukin-1 beta (IL1b), pro-inflammatory genes or an anti-inflammatory gene, interleukin-10 (IL10), from MCD diet fed WT and PKCd2/2mice (Fig. 2B).
Effect of MCD diet on markers of oxidative stress and oxidative stress gene expression
Examination of livers from WT but not PKCd2/2mice fed a
polyunsat-Figure 1. Hepatic PKCdexpression, steatosis, triglyceride accumulation, and lipid metabolism gene expression. (A) Hepatic PKCd
expression using a polyclonal (upper panel) and monoclonal (lower panel) antibody. PKCd+/+
(WT); PKCd2/2(KO). (B and D) Hematoxylin and eosin
stained liver sections (B) and quantitation shown as the means+/2SE from 6–8 mice per group (D). (C) Quantitation of hepatic triglyceride content is shown as the means+/2SE from 6–8 mice per group. (E and F) Hepatic lipid metabolism relative gene expression of WT and KO mice (n = 6) (E) or BSA (Con), palmitate (PA) or oleate (OA) treated hepatocytes (n = 4) (F). Normalized gene expression and fold change (means+/2SE) relative to Con fed WT mice (E) or WT Con treated hepatocytes (F). (*, p,0.05 versus Con diet fed WT mice or WT Con treated hepatocytes;{
, p,0.05 versus MCD diet fed WT mice).
urated fatty acids to peroxides and reactive oxygen species (Fig. 3A). Consistent with this result, the MCD diet-induced increase in TBARS in the liver of WT mice was blocked in PKCd2/2 mice (Fig. 3B). Genes involved in the generation of
reactive oxygen species in the liver rose 2-fold in four week MCD diet fed WT mice (Fig. 3C, upper panel) and were significantly greater than 2-fold by eight weeks in MCD diet fed WT mice (Fig. 3C, lower panel). In contrast, a significant reduction in the NADPH oxidase homolog (NOX4) was observed in MCD diet fed WT and PKCd2/2mice by eight weeks. Surprisingly, expression
of NADPH oxidase (NOX2), p22phox, p47phox, and p67phoxwere significantly elevated by four and eight weeks in the control diet fed PKCd2/2mice, while the MCD diet had no additional effect.
NADPH expression in the liver at the protein level revealed that NOX2 protein expression was not affected in MCD diet fed WT and PKCd2/2mice at eight weeks (Fig. 3D). In contrast, p67phox was significantly increased in both WT and PKCd2/2mice fed
the MCD diet for eight weeks. Consistent with the mRNA expression, significantly elevated expression of p22phox and p47phoxprotein was observed in control diet fed PKCd2/2mice.
To determine the consequence of altered NADPH oxidase subunit expression, we assayed NADPH oxidase activity in the liver from eight week fed MCD mice. NADPH oxidase activity was strongly stimulated in WT mice fed the MCD diet and this activity was significantly reduced in PKCd2/2mice (Fig. 3E). To gain insight
into the mechanism by which MCD diet-stimulated hepatic NADPH oxidase activity was reduced in PKCd2/2 mice, we
determined the content of the NADPH oxidase organizing subunit p47phoxin membrane and cytosolic protein fractions. Transloca-tion of p47phox from the cytosol to the membrane where it interacts with p22phoxleads to NADPH oxidase activation [23]. A significant 84% increase in hepatic p47phoxmembrane to cytosolic ratio was observed in WT mice fed the MCD diet. In contrast, hepatic p47phoxmembrane to cytosolic ratio was not significantly increased in PKCd2/2mice (Fig. 3F). As a control we investigated
the membrane to cytosolic ratio of hepatic p22phox. As expected, given that p22 is an integral membrane component of NADPH
oxidase, no differences in the membrane to cytosolic ratio of hepatic p22phoxwere observed.
Hepatic ER stress activation
Expression of IRE1a, Bip/GRP78, phospho-PERK, and phospho-JNK was examined in the livers from four week fed mice (Fig. S1). No effect of the MCD diet was observed on the hepatic protein levels of Bip/GRP78 in WT or PKCd2/2mice. In
contrast, the MCD diet induced elevated levels of IRE1a and phospho-PERK in WT and PKCd2/2mice. A significant increase
in phospho-JNK was observed in WT but not PKCd2/2mice fed
the MCD diet. These data suggest that loss of PKCd may be involved in MCD diet-induced ER stress mediated by JNK.
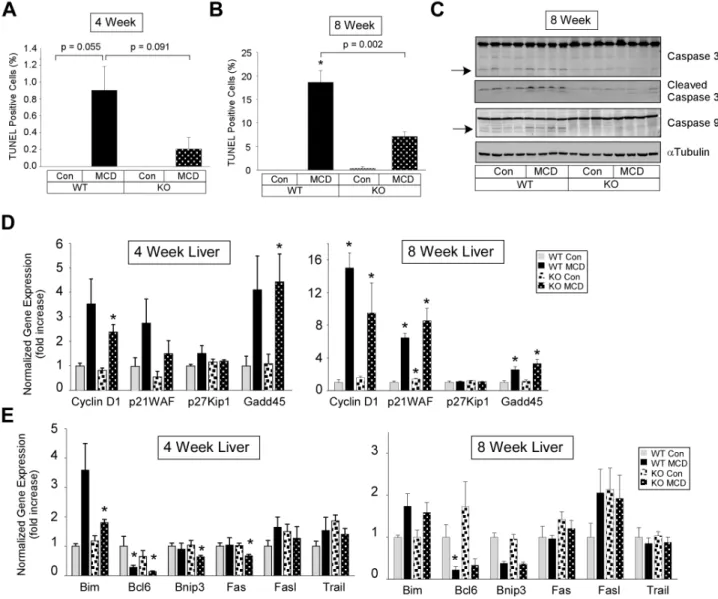
Effect of MCD diet on cell death-cell cycle and apoptosis gene expression
Analysis of livers of WT mice fed the MCD diet for four weeks revealed a low number of TUNEL-positive hepatocytes which was reduced in livers from PKCd2/2 mice (Fig. 4A, left panel). In
eight week MCD diet fed mice, the number of TUNEL-positive hepatocytes in WT mice was significantly increased to approxi-mately 20%, while less than 10% of hepatocytes in the liver from PKCd2/2 mice were TUNEL-positive (Fig. 4A, right panel).
Consistent with these results, MCD diet-induced caspase 3 and 9 cleavage (approximately 36% and 2-fold, respectively) in the livers from WT mice was completely blocked in livers from PKCd2/2
mice (Fig. 4B, right panel).
Analysis of cell cycle gene expression in the liver from WT mice fed the MCD diet for four and eight weeks revealed a significant elevation in Cyclin D1, Gadd45 and p21WAF in eight week fed mice (Fig. 4C). Cyclin D1, p21WAF, and Gadd45 expression was also significantly elevated in eight week fed PKCd2/2 mice.
Further analysis of expression for genes regulating apoptosis revealed a significant decrease in Bcl6, Bnip3, and Fas in four week MCD fed PKCd2/2 mice but not WT mice (Fig. 4D,left
panel). In eight week MCD fed mice, Bcl6 expression was significantly reduced in only the WT mice (Fig. 4D,right panel).
Effect of MCD diet on fibrosis and fibrosis gene expression
Trichrome and Sirius Red staining of livers from mice fed a MCD diet for eight weeks showed mild to moderate fibrosis in
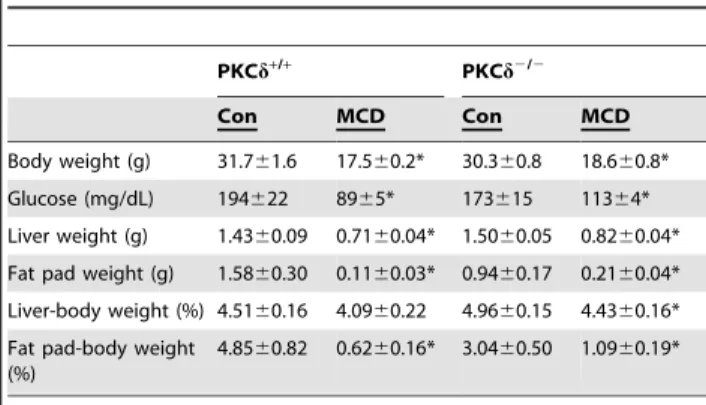
Table 1.Weights and serum metabolic parameters in female PKCd+/+and PKCd2/2mice.
PKCd+/+
PKCd2/2
Con MCD Con MCD
Body weight (g) 26.761.4 15.260.5* 21.961.9 14.960.9* Glucose (mg/dL) 196614 100614* 189626 10069* Liver weight (g) 1.2060.09 0.6860.03* 1.0260.09 0.7260.08* Fat pad weight (g) 1.1460.20 0.1560.03* 0.5960.23 0.2860.23 Liver-body weight (%) 4.4860.02 4.4960.19 4.6460.13 4.8060.23 Fat pad-body weight
(%)
4.1260.06 0.9760.19* 2.3460.76 1.8361.47
ALT (units/L) 13.764.8 139.2630.4* 8.061.9 168.2620.2* Triglyceride (mg/dL) 83.766.0 57.266.3* 67.964.7 61.664.4 NEFA (mM) 1.6360.12 1.0860.05* 1.2560.15 1.0960.25 Insulin (ng/ml) 1.5060.69 0.4060.05* 0.7260.15 0.3160.06*
Con, control diet; MCD, methonine and choline deficient diet; NEFA, non-esterified fatty acids.
Values represent the means6SEM for n = 5–8. compared to Con,
*p,.0.05.
doi:10.1371/journal.pone.0085848.t001
Table 2.Weights and serum metabolic parameters in male PKCd+/+and PKCd2/2mice.
PKCd+/+
PKCd2/2
Con MCD Con MCD
Body weight (g) 31.761.6 17.560.2* 30.360.8 18.660.8* Glucose (mg/dL) 194622 8965* 173615 11364* Liver weight (g) 1.4360.09 0.7160.04* 1.5060.05 0.8260.04* Fat pad weight (g) 1.5860.30 0.1160.03* 0.9460.17 0.2160.04* Liver-body weight (%) 4.5160.16 4.0960.22 4.9660.15 4.4360.16* Fat pad-body weight
(%)
4.8560.82 0.6260.16* 3.0460.50 1.0960.19*
Con, control diet; MCD, methonine and choline deficient diet; NEFA, non-esterified fatty acids.
Values represent the means6SEM for n = 5–8. compared to Con,
*p,.0.05.
both WT and PKCd2/2 mice (Fig. 5A and 5B). To determine
whether the mechanisms by which the MCD diet induced fibrosis were similar in WT and PKCd2/2mice, we examined the effect
of the MCD diet on hepatic genes involved in fibrosis. Collagen (Type IIa2 and Type IIIa1), CCAAT-enhancer-binding protein beta (CEBPb), transforming growth factor beta (TGFb), and alpha smooth muscle actin (a-SMA) gene expression were significantly elevated in both MCD diet fed WT and PKCd2/2mice (Fig. 5C),
suggesting that MCD diet-induced fibrosis development was similar in WT and PKCd2/2mice.
Effect of MCD diet on PKC isoform gene expression and activation in WT and PKCd2/2mice
To determine whether gene expression of other PKC isoforms was affected in PKCd2/2mice, relative mRNA levels of PKCa,
PKCbII, PKCe, and PKChwere analyzed in livers from WT and PKCd2/2mice fed a control or MCD diet. Relative mRNA levels
of the PKC isoforms was not affected by the MCD diet in WT mice; however, a significant reduction in PKCa and PKCe
mRNA was observed in PKCd2/2mice (Fig. 6A). Membrane and
cytosolic protein content of PKCa, PKCbII, PKCe, and PKCh
was also assessed. Similar changes in PKC isoform membrane and cytosolic protein content were observed in MCD fed WT and PKCd2/2 mice, except for in the MCD fed PKCd2/2 mice
where there was an 88% increase in PKCbII cytosolic protein content and a block in the reduction of PKCemembrane protein content (Fig. 6B). Taken together, these results suggest that subtle compensatory changes in the expression or activation of PKC isoforms occur in the liver of PKCd2/2mice.
Discussion
Mice fed an MCD diet develop an unusual form of lipodystro-phy, weight loss that is accompanied with hepatic steatosis. Hypoglycemia and enhanced whole body insulin sensitivity are additional limitations in the MCD diet model. The weight loss observed in MCD diet fed mice is associated with increased metabolic rate without an increase in food consumption and is associated with suppression in hepatic SCD-1 expression [24]. Indeed, we observed MCD diet-induced weight loss in all mice studied and a profound suppression in hepatic SCD-1 expression in WT and PKCd2/2mice. MCD diet-induced weight loss is also
accompanied by a reduction in fat pad weight relative to body weight which leads to a redistribution of TG stores to the liver.
Interestingly, PKCd2/2mice on the control diet weighed
,18%
less than their WT littermates. The control diet is enriched in sucrose and thus is lipogenic [25]. The reduction in weight gain observed in the PKCd2/2mice on the control diet is consistent
with the results observed by Bezy et. al. with PKCd2/2mice fed a
high fat diet [14].
The mechanism of MCD diet-induced hepatic steatosis is thought to involve an upregulation in the uptake of fatty acids derived from fat coupled with a reduction in the export of VLDL without any major changes tob-oxidation of fatty acids [26]. In the present study the MCD diet-induced reduction in fat pad weight relative to body weight and serum TG and NEFA levels was not observed in PKCd2/2 mice, suggesting that subtle
changes to lipid metabolism occurs in PKCd2/2mice. Consistent
with this conclusion, we observed changes in hepatic steatosis and TG and in the expression of genes involved inb-oxidation of fatty acids and VLDL export in four week MCD diet fed PKCd2/2
mice. Consistent with these observations, PKCdhas been shown in high fat fed mice to regulate the induction of hepatic genes involved in lipogenesis [14,15]. In agreement with these studies, we observed changes in the expression of genes involved in lipogenesis,b-oxidation of fatty acids, and VLDL export in fatty acid treated hepatocytes isolated from PKCd2/2mice compared
to those isolated from WT mice.
A major finding in the present study was the ability of PKCdto regulate oxidative stress in the liver of MCD diet fed mice. Oxidative stress is a defining characteristic of NASH [27] and is observed in the MCD diet model of steatohepatitis [18]. Our data showed significant reductions in oxidative stress as measured by 4-HNE staining, the detection of TBARS, and a reduction in NADPH oxidase activity in PKCd2/2 mice. These data are
consistent with the proposed role of PKCd in antioxidant induction of defensive mechanisms [28]. Elevated oxidative stress in MCD diet fed mice is associated with the induction of components of the NADPH oxidase complex (Nox2, p22phox, p47phox, and p67phox) [29]. In the present study, we also observed increases in mRNA and protein expression of components of the NADPH oxidase complex in MCD diet fed WT mice. Unexpect-edly, we observed significant increases in mRNA expression of Nox2, p22phox, p47phox, and p67phox and protein expression of p22phoxand p47phox in control fed PKCd2/2mice. Further, the
MCD diet was without effect on induction of components of the NADPH oxidase complex in PKCd2/2mice. These results lead
us to speculate that basal oxidative stress is elevated in PKCd2/2 Figure 2. Hepatic inflammation and inflammation gene expression.(A) Scoring of hematoxylin and eosin stained liver sections (means+/2
SE) from 6–8 mice per group. (B) Relative expression of hepatic pro and anti-inflammatory genes from Con or MCD diet fed mice (n = 6) for four weeks (means+/2SE). (*, p,0.05 versus Con diet fed WT mice).
mice, which may play a protective role in the MCD diet fed PKCd2/2mice.
However, we found that NADPH oxidase activity was not upregulated in PKCd2/2mice fed the control diet. Thus, the up
regulation of NADPH oxidase subunit mRNA and protein in the
PKCd2/2 mice does not lead to elevated NADPH oxidase
function. To further investigate NADPH activation in MCD diet fed mice, we examined the translocation of p47phox, the organizing subunit of the Nox2 NADPH oxidase complex. We observed that MCD diet stimulation of p47phox translocation was impaired in
Figure 3. Markers of oxidative stress and oxidative stress gene expression.(A) 4-HNE stained liver sections from four week fed PKCd+/+
(WT) and PKCd2/2(KO) mice (left panel) and quantitation (means+/2SE) (right panel). (B) Quantitation of hepatic TBARS (means+/2SE). (C). Relative
expression of hepatic NADPH oxidase subunit genes from Con or MCD diet fed mice for four (upper panel) or eight (lower panel) weeks or hepatocytes treated as in Fig. 1. Normalized gene expression and fold change (means+/2SE) relative to Con fed WT mice. (*, p,0.05 versus Con diet fed WT mice). (D) Hepatic NADPH oxidase subunit protein expression. Total cell lysate (70mg of protein) from liver tissue was analyzed by
immunoblotting for p22phox, p47phox, p67phox, and Nox2 (p91phox) andaTubulin expression. Representative immunoblots are shown (upper panel)
and quantitation of the immunoreactive bands minus background is shown as the means+/2SE (lower panel). (*, p,0.05 versus control diet). (E) Hepatic NADPH oxidase activity. Membrane protein (50mg) was assayed for NADPH oxidase activity as described in the Materials and methods. (*,
p,0.05 versus WT). (F). Hepatic NADPH oxidase subunit membrane and cytosolic protein expression. An equivalent amount of membrane and cytosolic protein was analyzed by Western blotting for p22phox, p47phox, calnexin oraTubulin expression (upper panels). Quantitation of the immunoreactive bands minus background of the membrane protein divided by the cytosolic protein (translocation) is shown as the means+/2SE (lower panels). (*, p,0.05 versus control diet).
doi:10.1371/journal.pone.0085848.g003
Figure 4. Markers of apoptosis and apoptosis related gene expression.(A) and (B) TUNEL staining of liver sections from four (A) or eight (B) week fed PKCd+/+
(WT) and PKCd2/2(KO) mice (means+/2SE). (C). Assessment of Caspase cleavage. Total cell lysate (70
mg of protein) from liver
tissue was analyzed by immunoblotting for Caspase 9 (mouse specific), Caspase 3, cleaved Caspase 3 (Asp175), andaTubulin expression. Arrows indicate the cleaved 19 and 37 kDa Caspase 3 and 9 fragments, respectively. (D) and (E) Relative expression of hepatic cell cycle (D) and apoptosis (E) genes from four (left panel) or eight (right panel) weeks fed mice. Normalized gene expression and fold change (means+/2SE) relative to Con fed WT mice. (*, p,0.05 versus Con diet fed WT mice).
PKCd2/2 mice which is consistent with our data on NADPH
oxidase activity. The mechanism by which p47phoxtranslocation is impaired in PKCd2/2mice is not known. However, PKCdis one
of a number of kinases (e.g. other PKC isoforms, ERK1/2, p38 MAPK, Pak1, and Akt) known to phosphorylate p47phox and regulate translocation [30]. In addition, Nox2 NADPH oxidase activity is modulated by PKC phosphorylation of Nox2 [31] and possibly by phosphorylation of p22phoxand p67phox[30].
Apoptosis is a characteristic marker for the progression of steatosis to steatohepatitis. It is associated with an inflammatory response and is thought to play a critical role in the development
of fibrosis [32,33]. The use of caspase inhibitors to reduce the development of NASH and lessen the severity of the MCD diet indicates that apoptosis plays an important role in MCD diet-induced steatohepatitis [34,35]. We observed a significant increase in hepatocyte apoptosis in mice fed a MCD diet for eight weeks compared to four weeks. Hepatocyte apoptosis was reduced in PKCd2/2 mice compared to WT mice fed a MCD diet.
Consistent with the proposed role of caspases in MCD diet-induced hepatocyte apoptosis, we found that caspase activation was blocked in liver of PKCd2/2 mice compared to WT mice.
This result is in agreement with other studies linking PKCdand
Figure 5. Hepatic Masson’s trichrome and Sirius Red staining and fibrosis gene expression.(A) Scoring of Masson’s trichrome stained liver sections (means+/2SE). (B) Scoring of Sirius Red stained liver sections (means+/2SE). (C) Relative expression of hepatic fibrosis related genes from Con or MCD diet fed mice for four weeks. Normalized gene expression and fold change (means+/2SE) relative to Con fed WT mice. (*, p,0.05 versus Con diet fed WT mice).
caspase activation [36]. We did not observe major differences in cell cycle gene expression between WT and PKCd2/2mice fed a
MCD diet. However, a significant reduction in the expression of pro-apoptotic genes in PKCd2/2mice compared to WT mice fed
a MCD diet was observed. These results are consistent with our findings that PKCd regulates fatty acid-induced cell death in a cellular model of steatohepatitis [18].
In contrast to our findings on apoptosis and caspase activation in the liver, we found that serum ALT, a marker of liver injury, did not differ between WT and PKCd2/2mice fed a MCD diet. Thus, a lack
of congruency was observed between serum ALT levels and oxidative stress and apoptosis in MCD diet fed PKCd2/2 mice. A lack of
congruency in serum ALT levels in MCD diet fed mice has also been observed by others. For example, a complete block in MCD diet-induced hepatic NADPH oxidase activity has been observed in the presence of significantly elevated serum ALT levels are in TLR42/2
mice [29], while a lack of congruency between serum ALT and proinflammatory gene expression and development of fibrosis has been observed in caspase-12/2MCD diet fed mice [37]. Finally, a
recent study in NAFLD patients observed a lack of correlation between serum liver enzymes including ALT and changes in steatosis, inflammation, hepatocyte ballooning, or fibrosis stage over time [38]. Our observation that gene expression of TNFa, MIP1a/CCL3, PAI-1, IL1a, and IL1bwhich have been shown to be upregulated in the liver of MCD diet fed rodents [39–41] did not differ in the liver between PKCd2/2and WT mice, even though a reduction
in histological inflammation score in PKCd2/2mice compared to
WT mice was observed, suggests that PKCd plays a role in steatohepatitis progression downstream from the induction of inflammation. Consistent with this conclusion are results demon-strating that TNFaand MCP-1 activate PKCd[20,42] and that lipid-induced PKCd activation in the liver is associated with
Figure 6. The effect of MCD diet on PKC isoform gene expression and activation in PKCd+/+and PKCd2/2mice.(A) PKCa, PKCbII, PKCe,
and PKChexpression was determined in four week fed PKCd+/+
(WT) and PKCd2/2(KO) mice by quantitative real time PCR and normalized as
described in the Materials and Methods. Fold change is shown as the means+/2SE relative to control fed WT mice. (B) An equivalent amount of cytosolic and membrane protein was analyzed by Western blotting for PKCa, PKCbII, PKCe, and PKChexpression. Quantitation of the immunoreactive bands minus background is shown as the means+/2SE. (*, p,0.05 versus control diet).
increases in serum levels of MCP-1 [9]. Alternatively, the uncoupling of elevated proinflamatory gene expression and a reduction in histological inflammation score in PKCd2/2 mice
compared to WT mice could be due to differential polarization of resident macrophages (Kupffer cells) or infiltrated macrophages [43] and/or changes to immune cell dynamics in the liver [44].
A major surprise in our study was that no difference in Masson’s trichrome and Sirius Red staining of liver sections was observed between WT and PKCd2/2 mice fed the MCD diet for eight
weeks. Consistent with our staining results, we observed no differences in the expression of hepatic fibrosis genes known to be upregulated in MCD diet fed mice [45]. Thus, the results from our model indicate that reducing hepatic inflammation and oxidative stress does not ameliorate hepatic fibrosis development. However, it possible that the degree of inflammation and oxidative stress reduction we observed may have led to a reduction in fibrosis at a later time point in the MCD diet feeding.
Our results do not agree with the recent study by Lee et al. [46] in which rottlerin and a PKCd short peptide inhibitor blocked fibrogenic gene expression and fibrosis in mice fed a MCD diet for 3 weeks and treated with LPS for 6 h. However, the LPS treatment lead to significant increases (from 8- to 15-fold) in hepatic TGF-b,a-SMA, and pro-collagen-1a1 mRNA expression compared to that observed in the untreated, MCD diet fed mice. Further, Masson’s trichrome staining was observed in the 6 h LPS treated, MCD diet fed mice but not in the untreated, MCD diet fed mice. Thus, fibrosis development appears to be an acute response in the LPS-treated, MCD fed mice compared to fibrosis development in the present study which was observed in mice fed the MCD diet for 8 weeks. Finally, the LPS independent effects of PKCdon key pathophysiological features of NASH are not known in the LPS-treated, MCD diet model of NASH. Further, given that there are key pathophysiological features in human patients with NASH (obesity and whole body insulin resistance) which are not present in the MCD diet model of NASH, it is possible that PKCddeletion in the context of obesity and whole body insulin resistance may reduce fibrosis.
A limitation in our study is that our findings are based upon a whole body knockout of PKCd. The development of NASH is a complex pathophysiological process that requires cross-talk
between the liver and other major organ systems such as adipose tissue [47]. Thus, the role of PKCd in key aspects of the pathophysiology of NASH in the liver and adipose tissue will require tissue-specific knockout models.
In conclusion, we have shown that PKCd regulates lipid metabolism, oxidative stress, and apoptosis, key aspects of the pathophysiology of MCD diet induced steatohepatitits in mice. Our key finding that PKCdregulates apoptosis in MCD diet fed mice suggest that our results may have relevance to the human condition where apoptosis is being targeted to treat NASH [48]. In addition, our studies using primary hepatocytes suggest that PKCd
modulates the direct effect of fatty acids on lipid metabolism expression. Finally, the data presented here suggest that increased PKCd protein levels and activation may be involved in the development of NASH.
Supporting Information
Figure S1 Hepatic ER stress activation. Liver tissue from
mice on control or MCD diets for four weeks was pulverized under liquid N2, and lysed in detergent containing buffer. A. Total cell lysate (60mg of protein) from liver tissue was analyzed by
immunoblotting for IRE1, phospho-PERK, phospho-JNK, BiP, andaTubulin expression. B. Quantitation of the immunoreactive bands minus background is shown as the means +/2 SE (*, p,0.05 versus control diet).
(TIF)
Acknowledgments
We are grateful to September Amspacher for kindly assisting with histology and Michelle Zanache and the University of Rochester, Functional Genomics Center for performing the real time PCR analysis. We are thankful to Robert Messing for kindly providing the PKCd+/2mice.
Author Contributions
Conceived and designed the experiments: MWG. Performed the experiments: MWG CMB DTL SKD AKJ MJH SC JZ PCT. Analyzed the data: MWG CMB JDS. Contributed reagents/materials/analysis tools: SKD. Wrote the paper: MWG.
References
1. Jou J, Choi SS, Diehl AM (2008) Mechanisms of disease progression in nonalcoholic fatty liver disease. Semin Liver Dis 28: 370–379.
2. Williams CD, Stengel J, Asike MI, Torres DM, Shaw J, et al. (2011) Prevalence of nonalcoholic fatty liver disease and nonalcoholic steatohepatitis among a largely middle-aged population utilizing ultrasound and liver biopsy: a prospective study. Gastroenterology 140: 124–131.
3. Das K, Das K, Mukherjee PS, Ghosh A, Ghosh S, et al. (2010) Nonobese population in a developing country has a high prevalence of nonalcoholic fatty liver and significant liver disease. Hepatology 51: 1593–1602.
4. Younossi ZM, Stepanova M, Negro F, Hallaji S, Younossi Y, et al. (2012) Nonalcoholic fatty liver disease in lean individuals in the United States. Medicine (Baltimore) 91: 319–327.
5. Day CP, James OF (1998) Steatohepatitis: a tale of two ‘‘hits’’? Gastroenterology 114: 842–845.
6. Farrell GC, Larter CZ (2006) Nonalcoholic fatty liver disease: from steatosis to cirrhosis. Hepatology 43: S99–S112.
7. Neuschwander-Tetri BA (2010) Hepatic lipotoxicity and the pathogenesis of nonalcoholic steatohepatitis: the central role of nontriglyceride fatty acid metabolites. Hepatology 52: 774–788.
8. Newton AC (2010) Protein kinase C: poised to signal. Am J Physiol Endocrinol Metab 298: E395–402.
9. Boden G, She P, Mozzoli M, Cheung P, Gumireddy K, et al. (2005) Free Fatty Acids Produce Insulin Resistance and Activate the Proinflammatory Nuclear Factor-{kappa}B Pathway in Rat Liver. Diabetes 54: 3458–3465.
10. Griffin ME, Marcucci MJ, Cline GW, Bell K, Barucci N, et al. (1999) Free fatty acid-induced insulin resistance is associated with activation of protein kinase C theta and alterations in the insulin signaling cascade. Diabetes 48: 1270–1274.
11. Itani SI, Ruderman NB, Schmieder F, Boden G (2002) Lipid-induced insulin resistance in human muscle is associated with changes in diacylglycerol, protein kinase C, and IkappaB-alpha. Diabetes 51: 2005–2011.
12. Mayr M, Chung YL, Mayr U, McGregor E, Troy H, et al. (2004) Loss of PKC-delta alters cardiac metabolism. Am J Physiol Heart Circ Physiol 287: H937– 945.
13. Kokorovic A, Cheung GW, Breen DM, Chari M, Lam CK, et al. (2011) Duodenal mucosal protein kinase C-delta regulates glucose production in rats. Gastroenterology 141: 1720–1727.
14. Bezy O, Tran TT, Pihlajamaki J, Suzuki R, Emanuelli B, et al. (2011) PKCdelta regulates hepatic insulin sensitivity and hepatosteatosis in mice and humans. J Clin Invest 121: 2504–2517.
15. Frangioudakis G, Burchfield JG, Narasimhan S, Cooney GJ, Leitges M, et al. (2009) Diverse roles for protein kinase C delta and protein kinase C epsilon in the generation of high-fat-diet-induced glucose intolerance in mice: regulation of lipogenesis by protein kinase C delta. Diabetologia 52: 2616–2620.
16. Anstee QM, Goldin RD (2006) Mouse models in non-alcoholic fatty liver disease and steatohepatitis research. Int J Exp Pathol 87: 1–16.
17. Kirsch R, Clarkson V, Shephard EG, Marais DA, Jaffer MA, et al. (2003) Rodent nutritional model of non-alcoholic steatohepatitis: species, strain and sex difference studies. J Gastroenterol Hepatol 18: 1272–1282.
18. Greene MW, Burrington CM, Ruhoff MS, Johnson AK, Chongkrairatanakul T, et al. (2010) PKC{delta} is activated in a dietary model of steatohepatitis and regulates endoplasmic reticulum stress and cell death. J Biol Chem 285: 42115– 42129.
20. Greene MW, Ruhoff MS, Burrington CM, Garofalo RS, Orena SJ (2010) TNFalpha activation of PKCdelta, mediated by NFkappaB and ER stress, cross-talks with the insulin signaling cascade. Cell Signal 22: 274–284.
21. Bedossa P, Poynard T (1996) An algorithm for the grading of activity in chronic hepatitis C. The METAVIR Cooperative Study Group. Hepatology 24: 289– 293.
22. Bligh EG, Dyer WJ (1959) A rapid method of total lipid extraction and purification. Can J Biochem Physiol 37: 911–917.
23. Bedard K, Krause KH (2007) The NOX family of ROS-generating NADPH oxidases: physiology and pathophysiology. Physiol Rev 87: 245–313. 24. Rizki G, Arnaboldi L, Gabrielli B, Yan J, Lee GS, et al. (2006) Mice fed a
lipogenic methionine-choline-deficient diet develop hypermetabolism coincident with hepatic suppression of SCD-1. J Lipid Res 47: 2280–2290.
25. Pickens MK, Yan JS, Ng RK, Ogata H, Grenert JP, et al. (2009) Dietary sucrose is essential to the development of liver injury in the MCD model of steatohepatitis. J Lipid Res.
26. Rinella ME, Elias MS, Smolak RR, Fu T, Borensztajn J, et al. (2008) Mechanisms of hepatic steatosis in mice fed a lipogenic methionine choline-deficient diet. J Lipid Res 49: 1068–1076.
27. Koek GH, Liedorp PR, Bast A (2011) The role of oxidative stress in non-alcoholic steatohepatitis. Clin Chim Acta 412: 1297–1305.
28. Niture SK, Jain AK, Jaiswal AK (2009) Antioxidant-induced modification of INrf2 cysteine 151 and PKC-delta-mediated phosphorylation of Nrf2 serine 40 are both required for stabilization and nuclear translocation of Nrf2 and increased drug resistance. J Cell Sci 122: 4452–4464.
29. Csak T, Velayudham A, Hritz I, Petrasek J, Levin I, et al. (2011) Deficiency in myeloid differentiation factor-2 and toll-like receptor 4 expression attenuates nonalcoholic steatohepatitis and fibrosis in mice. Am J Physiol Gastrointest Liver Physiol 300: G433–441.
30. Bokoch GM, Diebold B, Kim JS, Gianni D (2009) Emerging evidence for the importance of phosphorylation in the regulation of NADPH oxidases. Antioxid Redox Signal 11: 2429–2441.
31. Raad H, Paclet MH, Boussetta T, Kroviarski Y, Morel F, et al. (2009) Regulation of the phagocyte NADPH oxidase activity: phosphorylation of gp91phox/NOX2 by protein kinase C enhances its diaphorase activity and binding to Rac2, p67phox, and p47phox. FASEB J 23: 1011–1022. 32. Malhi H, Guicciardi ME, Gores GJ (2010) Hepatocyte death: a clear and
present danger. Physiol Rev 90: 1165–1194.
33. Rombouts K, Marra F (2010) Molecular mechanisms of hepatic fibrosis in non-alcoholic steatohepatitis. Dig Dis 28: 229–235.
34. Anstee QM, Concas D, Kudo H, Levene A, Pollard J, et al. (2010) Impact of pan-caspase inhibition in animal models of established steatosis and non-alcoholic steatohepatitis. J Hepatol 53: 542–550.
35. Witek RP, Stone WC, Karaca FG, Syn WK, Pereira TA, et al. (2009) Pan-caspase inhibitor VX-166 reduces fibrosis in an animal model of nonalcoholic steatohepatitis. Hepatology 50: 1421–1430.
36. Yoshida K (2007) PKCdelta signaling: mechanisms of DNA damage response and apoptosis. Cell Signal 19: 892–901.
37. Dixon LJ, Berk M, Thapaliya S, Papouchado BG, Feldstein AE (2012) Caspase-1-mediated regulation of fibrogenesis in diet-induced steatohepatitis. Lab Invest 92: 713–723.
38. Charatcharoenwitthaya P, Lindor KD, Angulo P (2012) The spontaneous course of liver enzymes and its correlation in nonalcoholic fatty liver disease. Dig Dis Sci 57: 1925–1931.
39. Kassel KM, Guo GL, Tawfik O, Luyendyk JP (2010) Monocyte chemoattractant protein-1 deficiency does not affect steatosis or inflammation in livers of mice fed a methionine-choline-deficient diet. Lab Invest 90: 1794–1804.
40. Lee GS, Yan JS, Ng RK, Kakar S, Maher JJ (2007) Polyunsaturated fat in the methionine-choline-deficient diet influences hepatic inflammation but not hepatocellular injury. J Lipid Res 48: 1885–1896.
41. Ota T, Takamura T, Kurita S, Matsuzawa N, Kita Y, et al. (2007) Insulin resistance accelerates a dietary rat model of nonalcoholic steatohepatitis. Gastroenterology 132: 282–293.
42. Lee JS, Yang EJ, Kim IS (2009) The roles of MCP-1 and protein kinase C delta activation in human eosinophilic leukemia EoL-1 cells. Cytokine 48: 186–195. 43. Shoelson SE, Lee J, Goldfine AB (2006) Inflammation and insulin resistance.
J Clin Invest 116: 1793–1801.
44. Li Z, Soloski MJ, Diehl AM (2005) Dietary factors alter hepatic innate immune system in mice with nonalcoholic fatty liver disease. Hepatology 42: 880–885. 45. Tomita K, Oike Y, Teratani T, Taguchi T, Noguchi M, et al. (2008) Hepatic
AdipoR2 signaling plays a protective role against progression of nonalcoholic steatohepatitis in mice. Hepatology 48: 458–473.
46. Lee SJ, Kang JH, Choi SY, Suk KT, Kim DJ, et al. (2013) PKCdelta as a regulator for TGFbeta1-induced alpha-SMA production in a murine nonalco-holic steatohepatitis model. PLoS One 8: e55979.
47. Lomonaco R, Ortiz-Lopez C, Orsak B, Webb A, Hardies J, et al. (2012) Effect of adipose tissue insulin resistance on metabolic parameters and liver histology in obese patients with nonalcoholic fatty liver disease. Hepatology 55: 1389–1397. 48. Feldstein A, Gores GJ (2004) Steatohepatitis and apoptosis: therapeutic

![Estudo dose-resposta e perfil de expressão gênica do herbicida diuron [3-(3,4-diclofenil)-1,1-dimetiluréia] em bexiga urinária de ratos wistar machos](data:image/gif;base64,R0lGODlhAQABAIAAAP///wAAACH5BAEAAAAALAAAAAABAAEAAAICRAEAOw==)