Peripheral Blood Dendritic Cells in Children
Monica Vasudev., Dorothy S. Cheung., Hannah Pincsak, Shun-Hwa Li, Ke Yan, Pippa Simpson,
Trivikram Dasu, Mitchell H. Grayson*
Department of Pediatrics, Medical College of Wisconsin, Milwaukee, Wisconsin, United States of America
Abstract
Background:In a mouse model of viral induced atopic disease, expression of FceRI on dendritic cells is critical. While adult human conventional (cDC) and plasmacytoid (pDC) dendritic cells have been shown to express FceRI, it is not known if this receptor is expressed in childhood and how its expression is governed by IgE.
Methods:Following informed consent of subjects (n = 27, aged 12–188 months), peripheral blood was stained for surface expression of CD19, ILT7, CD1c, IgE, FceRI and analyzed by flow cytometry (cDC: CD192ILT72 CD1c+; pDC: CD192ILT7+ CD1c2). Total and specific serum IgE levels to food and inhalant allergens were determined by ImmunoCAP, and the
relationship between FceRI expression on dendritic cells and sensitization, free IgE, cell bound IgE, and age was determined.
Results:Independent of sensitization status, FceRI expression was noted on cDC and pDC as early as 12 months of age. Serum IgE level correlated with expression of FceRI on cDC, but not pDC. Based on the concentration of IgE, a complex relationship was found between surface bound IgE and expression of FceRI on cDC. pDC exhibited a linear relationship of FceRI expression and bound IgE that was consistent through all IgE concentrations.
Conclusions: In children, FceRI expression on cDC and pDC is modulated differently by serum and cell bound IgE. IgE governance of FceRI expression on cDC depends upon a complex relationship. Further studies are needed to determine the functional roles of FceRI on cDC and pDC.
Citation:Vasudev M, Cheung DS, Pincsak H, Li S-H, Yan K, et al. (2012) Expression of High-Affinity IgE Receptor on Human Peripheral Blood Dendritic Cells in Children. PLoS ONE 7(2): e32556. doi:10.1371/journal.pone.0032556
Editor:Marco Idzko, University Hospital Freiburg, Germany
ReceivedOctober 18, 2011;AcceptedFebruary 1, 2012;PublishedFebruary 23, 2012
Copyright:ß2012 Vasudev et al. This is an open-access article distributed under the terms of the Creative Commons Attribution License, which permits unrestricted use, distribution, and reproduction in any medium, provided the original author and source are credited.
Funding:Funding was provided by Genentech (www.gene.com), National Institutes of Health grant HL087778 (www.nih.gov), and the Children’s Research Institute of the Children’s Hospital of Wisconsin (www.chw.org/display/PPF/DocID/30477/router.asp). The funders had no role in study design, data collection and analysis, decision to publish, or preparation of the manuscript.
Competing Interests:Mitchell H. Grayson has received research support from Genentech and the National Institutes of Health. The other authors declare no competing financial interests. This does not alter the authors’ adherence to all the PLoS ONE policies on sharing data and materials.
* E-mail: [email protected]
.These authors contributed equally to this work.
Introduction
Severe viral respiratory infections early in life are associated with increased risk of asthma and atopic disease [1,2,3,4]. Using a mouse model we defined potential mechanisms translating anti-viral immune responses into atopic disease. Mice infected with the murine type 1 parainfluenza virus develop an acute inflammatory response and severe weight loss in the first week of infection. By 10 days post-viral inoculation, the animals clear virus and begin to gain weight; however, by day 21 post-inoculation they manifest chronic airway hyper-reactivity and IL-13 dependent mucous cell metaplasia [5]. In addition, exposure to an environmental antigen during the viral infection is sufficient to generate IgE against the environmental antigen leading to worse atopic disease [6]. We have also shown that a similar response can occur in the gastrointestinal tract [7].
One hallmark of our model is that murine cDC and pDC do not express FceRI except during severe viral infections, when cognate
interactions with a specific neutrophil subset drives FceRI
expression [8]. Cross-linking FceRI bound IgE on cDC leads to
recruitment of IL-13 producing Th2 cells driving the atopic
response. We have shown in humans that cross-linking IgE on cDC produces CCL28, the same Th2 chemoattractant critical for the mouse model [9]. Although adult human cDC and pDC are known to express FceRI, very little is known about induction and
regulation of this receptor on human cDC and pDC from children. We undertook this study to answer this issue.
Our study documents expression patterns of FceRI on peripheral
blood cDC and pDC in young children. While the receptors are present early in life, we found a marked differential effect of low and high IgE on cDC FceRI expression. This finding implies that cDC
expressed FceRI has disparate effects on cDC function depending
on serum level of IgE. Further, our data suggest that IgE control of FceRI may be different in children compared to adults.
Methods
Experimental Design
sensitization to any food or inhalant allergen was associated with FceRI and IgE expression.
Ethics Statement
This study was approved by the Children’s Hospital of Wisconsin IRB. Parental written consent and subject verbal assent was obtained before enrollment of subjects into this study.
Subjects
Once consent and assent was obtained, an abbreviated atopic history was collected and venipuncture performed. Eligible patients were children aged 1–15 years. Exclusion criteria were: atopic dermatitis, persistent controlled asthma, uncontrolled asthma, immunodeficiency, or any co-morbid disease; use of any corticosteroids within the last month; current therapy with any prescribed medication; use of any investigational agent in the last 30 days; women of childbearing age not on contraception or women breastfeeding.
Sensitization status and total serum IgE determination
Total IgE and specific IgE levels to foods (casein, alpha-lactalbumin, beta-lactoglobulin, cheese, egg white, cacao, soybean, peanut, codfish, tuna, oat, rice, wheat) and aeroallergens (D. farinae,D. pteronyssinus, cockroach, cat dander, dog dander, mouse epithelium, rat epithelium, guinea pig epithelium, mouse serum protein, rat serum protein, mouse urine protein, rat urine protein, June grass,Alternaria tenuis,Cladosporium herbarum,Aspergillis fumigatus, common ragweed, oak, birch, L. destructor) were determined by ImmunoCAP (Quest Dignostics/IBT Laboratories). Sensitization was defined as elevated serum specific IgE (.0.35 kU/L) to one or more allergens tested.
Flow Cytometry
Immunophenotyping for evaluation of pDC and cDC was performed within 6 hours of specimen collection. 100ml of heparinized whole blood was stained with antibodies to human CD19 (PerCP labeled clone SJ25C1, BD Biosciences), ILT7 (PE labeled clone 17G10.2, eBioscience), and CD1c (APC labeled clone BDCA-1, Miltenyi Biotec), as well as either antibodies against FceRIa(FITC labeled clone AER-37, eBioscience) or IgE
(FITC labeled, Kirkegaard & Perry Laboratories, Inc.) for 15 min. at room temperature. Erythrocytes were lysed with 2 ml FACSLyse (BD Biosciences) and stained cells were washed with PBS/0.1% NaN3 and fixed using 1% paraformaldehyde. Flow cytometry (BD FACSCalibur) was performed with 56105 to 16106 total cellular events collected on each stained specimen. cDC (also referred to as mDC-1) were identified as CD192/ ILT72/CD1c+
and pDC identified as CD192/ILT7+ /CD1c2. This type of phenotyping strategy has been used before, as ILT7 is a specific marker for pDC and CD192CD1c+ cells have been shown to be essentially all cDC [9,10,11,12,13,14,15,16]. Using multi-color flow cytometry and Boolean gating strategy, the expression of IgE and FceRIa were identified on the cDC and
pDC subsets and measured as fold mean florescence (fold MFI) over individual isotype control background using CellQuest Pro software (BD Biosciences) as shown in Figure 1A. Appropriate isotype control antibodies were utilized, and calibration of FceRIa
expression (MEPE) was performed in each run using fluorescent beads as described [17].
Statistical Analysis
Data were expressed as frequency and percent for categorical variables and median and interquartile range for continuous
variables. Since the data were skewed, continuous variables were compared using a Mann-Whitney test while doing 2 group comparisons, and continuous variables were examined using scatter plots and Pearson correlations. To investigate the inter-related effects of variables on the outcomes of interest, a regression tree analysis was done using Salford Systems’ CART software (http://salford-systems.com/). Regression trees are a non-para-metric approach where the data are split recursively into two groups based on an optimizing function, until the specified limits for subgroups are reached. A least absolute deviance from the median was used as the optimizing function, with a limit of 10 in any group to be split and 5 minimally needed for any group. Linear regression was used to fit the data with linear or a polynomial trend with normality of the error term checked with a normal probability plot. cDC IgE was fit to serum IgE using a non-linear regression for a sigmoidal type curve of the form 1/ (1+M/serum IgE)m, where M is the (fitted) median value of cDC IgE and m is the slope of the curve at that value. We fit linear regression using SAS 9.2 and non-linear regression using JMP 9.0. Given the relatively small sample, we did not use a bootstrap approach or a holdout sample to validate the model results. Therefore, these results will need to be validated on another sample.
Results
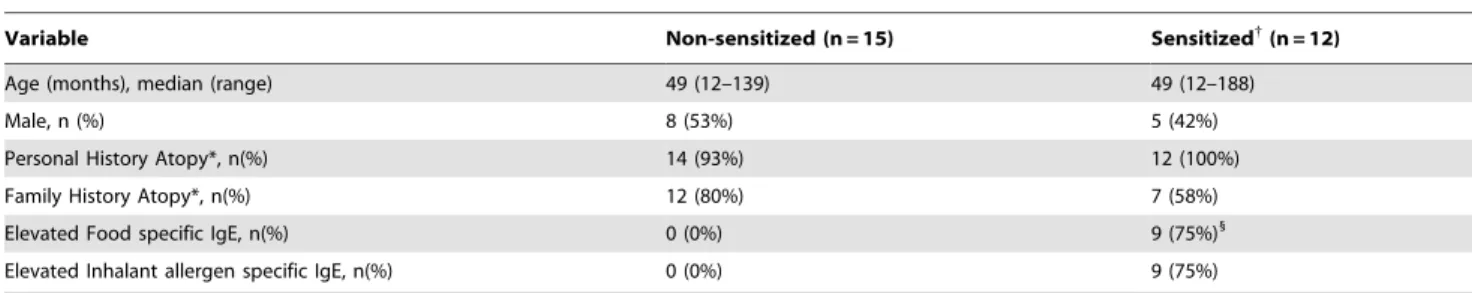
Twenty-seven patients aged 12 to 188 months were recruited from June through September 2009. All patients denied symptoms of current allergic disease or respiratory tract infection. A summary of subject characteristics is in Table 1. Subjects were classified as sensitized based on ImmunoCap testing, with a single positive test being considered ‘‘sensitized’’. No correlation was noted between sensitization status and age, and other than total serum IgE there was no significant difference in any demographic information between the sensitized (n = 12) and non-sensitized subjects (n = 15).
In a linear regression, we found that there was a moderate correlation between age and serum IgE (r = 0.53), with about 25% of the variation of IgE explained by the linear relationship with age. However, much of this relationship occurred in the non-sensitized group (r = 0.56) compared to the non-sensitized group (r = 0.29). This is not surprising, since serum IgE levels can fluctuate, such as with viral infections, and our data were obtained at only a single time point per subject [18].
Comparing the relative frequencies of conventional (cDC) and plasmacytoid dendritic cells (pDC) amongst all of our subjects, we found 1.26 (0.66–2.55) (median (IQR)) fold more cDC than pDC. This ratio was not significantly different between sensitized and non-sensitized subjects, nor did it correlate with age (data not shown). While this ratio of cDC to pDC is lower than what has been reported in older children, it is similar to what has been reported in adult studies using a dendritic cell phenotyping strategy similar to ours [14,15,19].
Conventional dendritic cells (cDC)
We initially hypothesized that similar to the rodent system, peripheral blood cDC would not express FceRI early in life.
However, as shown in Figure 1B, FceRI expression was detected
on cDC at all ages. Given that viral infections have been shown to upregulate expression of FceRI on dendritic cells, and that older
p = 0.07) and this marginal correlation was found in sensitized (r = 0.53, p = 0.08) but not non-sensitized (r =20.002, p = 0.99) subjects. Further, no association was found between family atopic status and FceRI expression on cDC (p = 0.42, data not shown).
In human mast cells and basophils, IgE modulates FceRI
expression [20]. In fact, in a study with anti-IgE the reduction in
IgE directly correlated with subsequent reduction of FceRI
expression on peripheral blood DC of adults [21]. We examined the relationship between serum IgE and cDC expression of FceRI.
As shown in Figure 1C, there was a linear correlation (r = 0.78, p,0.0001) between serum IgE levels and cDC expression of FceRI. This correlation held regardless of sensitization status
Figure 1. Expression of FceRI on cDC correlates with serum IgE but not with subject’s age.(A) Gating strategy used to identify expression
of FceRI and IgE on cDC and pDC. Cells were gated on scatter (R1) and lack of expression of CD19 (R2, PerCP negative). Those events that satisfied
both of these criteria were examined for expression of ILT7 (R3, PE positive) versus CD1c (R4, APC positive). Cells that were CD192ILT7+
CD1c2were considered pDC and CD192ILT72CD1c+were considered cDC. The expression of FceRI (left histograms, FITC positive) or IgE (right histograms, FITC
positive) on these cells was then determined and compared to an appropriate isotype control. (B) Expression of FceRI on peripheral blood cDC was
determined by flow cytometry and compared to subject’s age or (C) serum IgE level. Data are presented as fold MFI FceRI versus age in months (B) or
serum IgE in kU/L (C), with non-sensitized subjects (n = 15) in circles and sensitized subjects (n = 12) in x’s. Sensitization was defined as having at least one positive allergen specific IgE by ImmunoCAP.
(r = 0.83, p = 0.0009 sensitized subjects; r = 0.64 non-sensitized subjects, p = 0.01).
Sensitization status did not differentiate level of expression of FceRI on cDC (Table 2). However, a regression tree analysis
revealed that when serum IgE was less than 60 kU/L, FceRI
expression was significantly higher on cDC from non-sensitized subjects (median (IQR) = 14.03 (13.2, 16.48) fold MFI) compared to sensitized individuals (median (IQR) = 12.05 (11.77, 12.74) fold MFI), p = 0.04.
Since bound IgE modulates expression of FceRI on human
mast cells and basophils, we examined the level of IgE on peripheral blood cDC and correlated this with FceRI expression.
As shown in Figure 2A, the relationship between cDC expression of FceRI and surface bound IgE was complex. With low level
staining of IgE (less than a fold MFI IgE expression of 12) there was no relationship between surface bound IgE and FceRI.
However, at higher levels of surface bound IgE there was a direct correlation between bound IgE and FceRI expression.
Interest-ingly, fitting curves to the data (the equations are shown in Table 3) showed the relationship between cDC bound IgE and FceRI
expression to be different for sensitized and non-sensitized individuals. In Figure 2A the relationship in sensitized individuals appears to be exponential, while in non-sensitized it was more sigmoidal. However, both curves appear to converge when subjects expressed a fold MFI for IgE of 12 or greater. Analyzing all of the data together (without making a distinction on sensitization status) generated a curve that was sigmoidal and
the inflection point remained at a fold MFI IgE expression of 12 (Figure 2A, blue line).
By overlaying serum IgE levels, we found only subjects with a serum IgE above 34–42 kU/L had a cDC fold IgE expression of 12 or greater (Figure 2B). These data suggest serum IgE drives FceRI expression on peripheral blood cDC only when it crosses
this threshold level. Because the two curves converge (Figure 2A), this effect appears to be unrelated to subject’s sensitization status.
Plasmacytoid dendritic cells (pDC)
Unlike peripheral blood cDC, pDC expression of FceRI was
minimal (median (IQR) = 15.82 (12.74–21.05) versus 2.47 (1.47– 3.25) on cDC and pDC, respectively). In fact, 6 of the 27 subjects appeared to have no expression of FceRI on their pDC (fold MFI
equal to or less than 1.0). As shown in Table 2, analogous to the cDC data, sensitization status did not associate with level of expression of FceRI on pDC. We also found no linear correlation
between age of the subject and pDC expression of FceRI
(Figure 3A; r = 0.13, p = 0.51 for all subjects; r = 0.28, p = 0.38 for sensitized subjects; and r =20.05, p = 0.87 for non-sensitized subjects). In sum, there was no correlation between a given subject’s expression of FceRI on their cDC or pDC and age.
Unlike with cDC (Figure 1C), serum IgE levels did not correlate with pDC expression of FceRI (Figure 3B, r = 0.21, p = 0.29 for all
subjects; r = 0.42, p = 0.17 for sensitized subjects; r = 0.21, p = 0.46 for non-sensitized subjects). Also, unlike cDC, pDC bound IgE levels correlated linearly with pDC expression of FceRI in both
Table 1.Subject Characteristics.
Variable Non-sensitized (n = 15) Sensitized{
(n = 12)
Age (months), median (range) 49 (12–139) 49 (12–188)
Male, n (%) 8 (53%) 5 (42%)
Personal History Atopy*, n(%) 14 (93%) 12 (100%)
Family History Atopy*, n(%) 12 (80%) 7 (58%)
Elevated Food specific IgE, n(%) 0 (0%) 9 (75%)1
Elevated Inhalant allergen specific IgE, n(%) 0 (0%) 9 (75%)
*Atopy history: defined as self reported or MD diagnosed allergic rhinitis/hayfever/environmental allergies, asthma/wheeze, atopic dermatitis, food allergy. Family history of atopy was based on self-reporting only.
{
Sensitized: defined as any elevated food or inhalant serum specific IgE. 1
Only 4 of these subjects had a clinical history suggestive of an allergy for the foods to which they had IgE against. doi:10.1371/journal.pone.0032556.t001
Table 2.Comparison of Sensitized and Non-Sensitized Children for Dendritic Cell Expression of IgE and FceRI.
Median (IQR)
Variable Non-Sensitized (n = 15) Sensitized (n = 12) p-value{
Age (month) 49 (28, 89) 49 (24.5, 95) .0.99
Serum IgE (kU/L) 9.5 (6, 42) 57.25 (22.3, 125) 0.003
pDC bound IgE (fold MFI) 2.42 (1.54, 2.74) 2.13 (1.15, 4.1) .0.999
pDC FceRI (fold MFI) 2.65 (1.59, 3.25) 2.02 (1.04, 3.25) 0.39
cDC bound IgE (fold MFI) 4.3 (2.68. 19.2) 17.33 (5.12, 33.5) 0.08
cDC FceRI (fold MFI) 14.37 (13.2, 17.8) 19.8 (12.1, 23.5) 0.48
{
: Mann-Whitney test.
IQR: interquartile range, cDC: conventional dendritic cells, pDC: plasmacytoid dendritic cells. doi:10.1371/journal.pone.0032556.t002
Figure 2. Correlation of cDC expression of FceRI with IgE.Expression of FceRI and IgE on the surface of cDC was determined by flow
cytometry. (A) Data are presented as fold MFI FceRI versus fold MFI IgE expression, with non-sensitized subjects (n = 15) in red circles and sensitized
subjects (n = 12) in black x’s. Note the difference in the slope of the fitted lines (non-sensitized subjects in red dotted line; sensitized subjects in black solid line) above and below a fold MFI IgE of 12, suggesting that there is differential regulation of FceRI on cDC around this level of cell bound IgE. For
all subjects the data was fit with the following cubic equation (blue line): Ln(cDC FceRI) = 2.26+0.72*ln(cDC IgE)-0.43*ln(cDC IgE)2+0.082*ln(cDC IgE)3);
r = 0.86; p = 0.045. For equations based on sensitization status, see Table 3. (B) Expression of cell bound IgE on cDC compared with serum (free) IgE levels. Data are presented as in (A) with fold MFI IgE expression versus serum IgE (kU/L). Note that a cell bound IgE fold MFI of 12 correlates with a serum IgE of around 38 (based on statistical fitting of the curve, this value could range between 34 and 42 kU/L).
doi:10.1371/journal.pone.0032556.g002
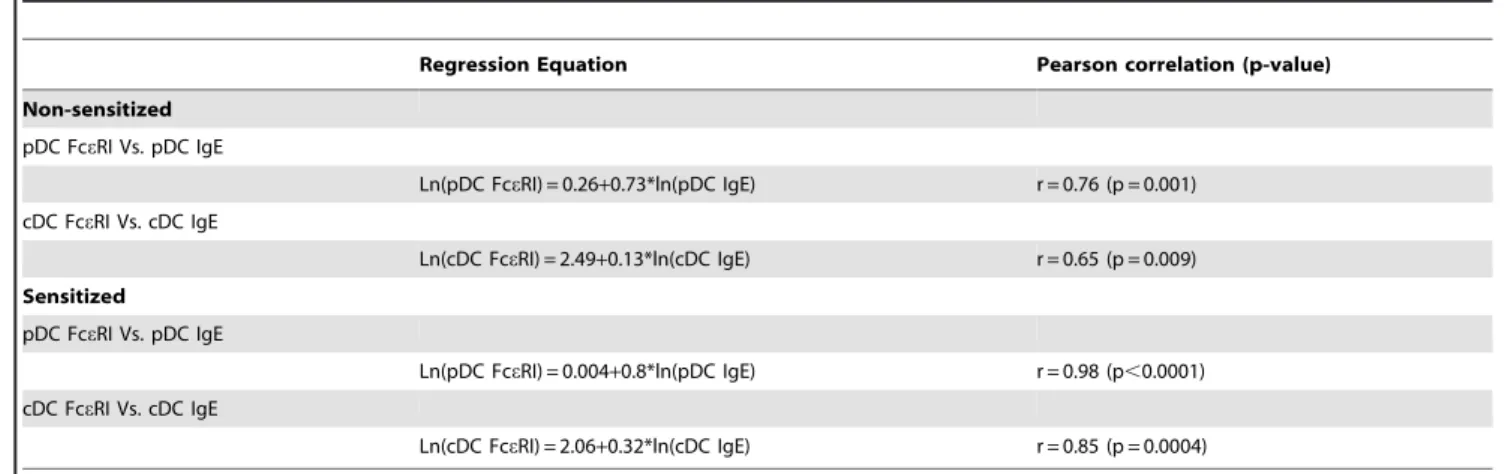
Table 3.Sensitization status regression models with significant Pearson correlations.
Regression Equation Pearson correlation (p-value)
Non-sensitized
pDC FceRI Vs. pDC IgE
Ln(pDC FceRI) = 0.26+0.73*ln(pDC IgE) r = 0.76 (p = 0.001)
cDC FceRI Vs. cDC IgE
Ln(cDC FceRI) = 2.49+0.13*ln(cDC IgE) r = 0.65 (p = 0.009)
Sensitized
pDC FceRI Vs. pDC IgE
Ln(pDC FceRI) = 0.004+0.8*ln(pDC IgE) r = 0.98 (p,0.0001)
cDC FceRI Vs. cDC IgE
Ln(cDC FceRI) = 2.06+0.32*ln(cDC IgE) r = 0.85 (p = 0.0004)
sensitized (r = 0.76, p = 0.001) and non-sensitized subjects (r = 0.98, p,0.0001). These data provide further evidence for a direct association between bound IgE and FceRI expression in
pDC but not cDC, suggesting that regulation of FceRI is dissimilar
in cDC and pDC.
Discussion
Other studies have attempted to describe relationships between serum IgE, cell-bound IgE, and FceRI expression on dendritic
cells [17,21]. These prior studies utilized adults, and did not examine expression in children. There is one publication in the literature that looked at children [22]. However, this report examined older children and did not differentiate FceRI and IgE
staining on cDC and pDC, as they used CD11c and MHC-II as markers for dendritic cells—markers that are insufficient to distinguish cDC and pDC cells in humans [23]. Further, our study utilized regression analysis to better understand the role of FceRI on dendritic cells in children of various ages. We found that
as early as 12 months of age, regardless of sensitization status, FceRI is expressed on peripheral blood cDC and pDC, although
pDC expression of some subjects was quite minimal. No association between age and expression of IgE or FceRI was
found, indicating that our initial hypothesis was wrong (i.e., FceRI
expression on dendritic cells would correlate with age). Although we do acknowledge that a longitudinal study would be more appropriate to examine the relationship between age and receptor expression. It does remain possible that early life developmental control of FceRI expression exists before 12 months of age—
especially with pDC. Once induced, FceRI expression clearly can
be modulated by viral infections [18].
Interestingly, we found no association between sensitization status and FceRI expression. We cannot equate sensitization with
atopy because we did not challenge our subjects with the respective allergens. Further, it is quite possible that those subjects we identified as non-sensitized were indeed making specific IgE— just against antigens that were not included in our panels. For these reasons our data may be different from two studies in adults where atopic subjects were noted to have significantly higher FceRI expression on cDC and pDC [15,21]. Our results do
corroborate those of the adult studies in the fact that expression of FceRI is much higher on cDC than on pDC. What the functional
implications are for this difference in expression remains unclear.
The most intriguing finding of our study is the major difference in the role of IgE in receptor expression. Whereas a direct relationship between FceRI expression and IgE on both cDC and
pDC have been reported by others, we found that only pDC FceRI expression correlated in a linear fashion with bound IgE
[21,24]. Our data did not show a relationship between serum IgE and FceRI expression on pDC. This suggests free IgE may not
drive receptor expression, an event that depends singularly upon level of bound IgE. This difference may be due to the low level of expression of FceRI on pDC, and may explain differences between
how IgE drives FceRI expression on mast cells and basophils when
compared to pDC [20,25].
Unlike pDC, expression of FceRI on cDC correlated directly
with serum IgE levels. However, the relationship between bound IgE and FceRI was more complex. When cell bound IgE was
below 12 fold MFI there was little effect of bound IgE on FceRI
expression. Once bound IgE levels crossed the threshold, a direct relationship developed. At low levels of serum IgE (,34–42 kU/L) there is rapid accumulation of bound IgE with little effect on FceRI expression. At these low levels of IgE, a difference in
correlation of bound IgE and FceRI exists between sensitized and
non-sensitized subjects. Both responses are parabolic, however, non-sensitized subjects tend to have an initial increase in FceRI
expression with increasing bound IgE (below 12 fold MFI). Sensitized subjects had the exact opposite effect. Once serum IgE levels reached 34–42 kU/L, corresponding to bound IgE levels of 12 fold MFI, both sensitized and non-sensitized subjects exhibited a direct correlation between IgE and FceRI.
We have found a threshold effect of bound IgE on cDC FceRI.
The functional implications for this threshold effect are unclear; it is inviting to speculate that FceRI has disparate functions at low
versus high IgE levels. Perhaps at lower levels FceRI acts as a
rheostat, similar to what is seen in rodents, where the receptor functions as a mechanism for cellular recruitment and less for antigen-uptake [5,6]. At higher levels of IgE, the receptor may function more as a means for ‘‘antigen-focusing’’ [26]. It is beyond the scope of this study to elucidate actual mechanisms behind this phenomenon, but the functional implications of IgE regulation of FceRI expression are tantalizing.
Our study had several limitations. First and foremost, we utilized statistical modeling to evaluate our data, and, as a result, it is important that these findings be validated in a second cohort. Further, our sample size was relatively small and likely limited our
Figure 3. Expression of FceRI on pDC does not correlate with serum IgE or age of subject.Expression of FceRI on peripheral blood pDC
was determined by flow cytometry and compared to subject’s age (panel A) and serum IgE level (panel B). Data are presented as in Figure 1. doi:10.1371/journal.pone.0032556.g003
ability to detect subtle differences. We did not enroll infants younger than 12 months of age, and we were unable to determine if viral infection relates to induction of FceRI. Finally, defining
sensitization status by selected ImmunoCAP may not be ideal— especially from a clinical perspective. However, given that our results were mostly independent of sensitization status, we believe this is not a major defect. Indeed, most of the limitations of our study would only lessen our ability to define statistically significant differences. Since we were able to document clear relationships between IgE (serum and cell bound) and cDC and pDC expression of FceRI despite these limitations, their presence only strengthen
the importance of our findings.
In summary, our results demonstrate the presence of FceRI on
peripheral blood cDC and pDC in children as young as 1 year old, which is in contrast to what is seen in the rodent system. Our data also provide evidence of differential regulation of FceRI on cDC
and pDC in children. With cDC a complex inter-relationship between serum IgE, cell bound IgE, and expression of FceRI exists
that appears to hinge on an IgE level of 34–42 kU/L. The functional significance of this relationship is unclear, and we do not yet understand the mechanisms responsible for this relation-ship. Future studies need to be undertaken to examine expression of FceRI on cDC and how IgE modulates this receptor and cDC
function.
Author Contributions
Conceived and designed the experiments: MV DSC MHG. Performed the experiments: MV DSC HP TD. Analyzed the data: MV DSC HP TD SHL KY PS MHG. Contributed reagents/materials/analysis tools: SHL PS MHG. Wrote the paper: MV DSC MHG.
References
1. Sigurs N, Aljassim F, Kjellman B, Robinson PD, Sigurbergsson F, et al. (2010) Asthma and allergy patterns over 18 years after severe RSV bronchiolitis in the first year of life. Thorax 65: 1045–1052.
2. Sigurs N, Gustafsson PM, Bjarnason R, Lundberg F, Schmidt S, et al. (2005) Severe respiratory syncytial virus bronchiolitis in infancy and asthma and allergy at age 13. Am J Respir Crit Care Med 171: 137–141.
3. Escobar GJ, Ragins A, Li SX, Prager L, Masaquel AS, et al. (2010) Recurrent wheezing in the third year of life among children born at 32 weeks’ gestation or later: relationship to laboratory-confirmed, medically attended infection with respiratory syncytial virus during the first year of life. Arch Pediatr Adolesc Med 164: 915–922.
4. Johnston SL, Pattemore PK, Sanderson G, Smith S, Campbell MJ, et al. (1996) The relationship between upper respiratory infections and hospital admissions for asthma: a time-trend analysis. Am J Respir Crit Care Med 154: 654–660. 5. Grayson MH, Cheung D, Rohlfing MM, Kitchens R, Spiegel DE, et al. (2007)
Induction of high-affinity IgE receptor on lung dendritic cells during viral infection leads to mucous cell metaplasia. J Exp Med 204: 2759–2769. 6. Cheung DS, Ehlenbach SJ, Kitchens T, Riley DA, Grayson MH (2010)
Development of atopy by severe paramyxoviral infection in a mouse model. Ann Allergy Asthma Immunol 105: 437–443 e431.
7. Chen X, Leach D, Hunter DA, Sanfelippo D, Buell EJ, et al. (2011) Characterization of intestinal dendritic cells in murine norovirus infection. Open Immunol J 4: 22–30.
8. Cheung DS, Ehlenbach SJ, Kitchens RT, Riley DA, Thomas LL, et al. (2010) Cutting edge: CD49d+ neutrophils induce FcepsilonRI expression on lung dendritic cells in a mouse model of postviral asthma. J Immunol 185: 4983–4987.
9. Khan SH, Grayson MH (2010) Cross-linking IgE augments human conventional dendritic cell production of CC chemokine ligand 28. J Allergy Clin Immunol 125: 265–267.
10. Rissoan MC, Duhen T, Bridon JM, Bendriss-Vermare N, Peronne C, et al. (2002) Subtractive hybridization reveals the expression of immunoglobulin-like transcript 7, Eph-B1, granzyme B, and 3 novel transcripts in human plasmacytoid dendritic cells. Blood 100: 3295–3303.
11. Cao W, Bover L (2010) Signaling and ligand interaction of ILT7: receptor-mediated regulatory mechanisms for plasmacytoid dendritic cells. Immunol Rev 234: 163–176.
12. Cao W, Bover L, Cho M, Wen X, Hanabuchi S, et al. (2009) Regulation of TLR7/9 responses in plasmacytoid dendritic cells by BST2 and ILT7 receptor interaction. J Exp Med 206: 1603–1614.
13. Cao W, Rosen DB, Ito T, Bover L, Bao M, et al. (2006) Plasmacytoid dendritic cell-specific receptor ILT7-Fc epsilonRI gamma inhibits Toll-like receptor-induced interferon production. J Exp Med 203: 1399–1405.
14. Kirsche H, Niederfuhr A, Deutschle T, Fuchs C, Riechelmann H (2010) Ratio of myeloid and plasmacytoid dendritic cells and TH2 skew in CRS with nasal polyps. Allergy 65: 24–31.
15. Lundberg K, Greiff L, Borrebaeck CA, Lindstedt M (2010) FcepsilonRI levels and frequencies of peripheral blood dendritic cell populations in allergic rhinitis. Hum Immunol 71: 931–933.
16. Patterson S, Donaghy H, Amjadi P, Gazzard B, Gotch F, et al. (2005) Human BDCA-1-positive blood dendritic cells differentiate into phenotypically distinct immature and mature populations in the absence of exogenous maturational stimuli: differentiation failure in HIV infection. J Immunol 174: 8200–8209. 17. Foster B, Metcalfe DD, Prussin C (2003) Human dendritic cell 1 and dendritic
cell 2 subsets express FcepsilonRI: correlation with serum IgE and allergic asthma. J Allergy Clin Immunol 112: 1132–1138.
18. Subrata LS, Bizzintino J, Mamessier E, Bosco A, McKenna KL, et al. (2009) Interactions between innate antiviral and atopic immunoinflammatory pathways precipitate and sustain asthma exacerbations in children. J Immunol 183: 2793–2800.
19. Silver E, Yin-DeClue H, Schechtman KB, Grayson MH, Bacharier LB, et al. (2009) Lower levels of plasmacytoid dendritic cells in peripheral blood are associated with a diagnosis of asthma 6 yr after severe respiratory syncytial virus bronchiolitis. Pediatr Allergy Immunol 20: 471–476.
20. Saini S, MacGlashan DW, Jr., Adelman D, Jardieu P, Togias A, et al. (1997) Culture with IgE increases IgE density and FceRI expression on human
basophils. J Allergy Clin Immunol 99: S102 (abstr.).
21. Prussin C, Griffith DT, Boesel KM, Lin H, Foster B, et al. (2003) Omalizumab treatment downregulates dendritic cell FcepsilonRI expression. J Allergy Clin Immunol 112: 1147–1154.
22. Dehlink E, Baker AH, Yen E, Nurko S, Fiebiger E (2010) Relationships between levels of serum IgE, cell-bound IgE, and IgE-receptors on peripheral blood cells in a pediatric population. PLoS One 5: e12204.
23. Grayson MH (2006) Lung dendritic cells and the inflammatory response. Ann Allergy Asthma Immunol 96: 643–651; quiz 652–643, 678.
24. Schroeder JT, Bieneman AP, Chichester KL, Hamilton RG, Xiao H, et al. (2010) Decreases in human dendritic cell-dependent T(H)2-like responses after acute in vivo IgE neutralization. J Allergy Clin Immunol 125: 896–901 e896. 25. Thompson HL, Metcalfe DD, Kinet JP (1990) Early expression of high-affinity
receptor for immunoglobulin E (Fc epsilon RI) during differentiation of mouse mast cells and human basophils. J Clin Invest 85: 1227–1233.