Clinical Evaluation of an Affordable
Qualitative Viral Failure Assay for HIV Using
Dried Blood Spots in Uganda
Sheila N. Balinda1*, Pascale Ondoa2, Ekwaro A. Obuku1, Aletta Kliphuis3, Isaac Egau1, Michelle Bronze4, Lordwin Kasambula1, Rob Schuurman5, Nicole Spieker3, Tobias
F. Rinke de Wit2, Cissy Kityo1, ART–A consortium¶
1Joint Clinical Research Center, P.O. Box 10005, Kampala, Uganda,2Amsterdam Institute for Global Health and Development, Department of Global Health, Academic medical Center, Trinity C Building, Pietersbergweg 17, 1105 BM, Amsterdam, the Netherlands,3PharmAccess International, Amsterdam, Trinity Building C Pietersbergweg 17, 1105 BM, Amsterdam, the Netherlands,4Wits Health Consortium, University of the Witwatersrand, 1 Jan Smuts Avenue, Braamfontein 2000, Johannesburg, South Africa, 5University Medical Centre Utrecht, P.O. Box 80125, 3508 TC, Utrecht, the Netherlands
¶ Membership of the ART–A consortium is provided in the Acknowledgments. *[email protected];[email protected]
Abstract
Background
WHO recommends regular viral load (VL) monitoring of patients on antiretroviral therapy (ART) for timely detection of virological failure, prevention of acquired HIV drug resistance (HIVDR) and avoiding unnecessary switching to second-line ART. However, the cost and complexity of routine VL testing remains prohibitive in most resource limited settings (RLS). We evaluated a simple, low–cost, qualitative viral–failure assay (VFA) on dried blood spots
(DBS) in three clinical settings in Uganda.
Methods
We conducted a cross–sectional diagnostic accuracy study in three HIV/AIDS treatment
centres at the Joint Clinical Research Centre in Uganda. The VFA employs semi-quantita-tive detection of HIV–1 RNA amplified from the LTR gene. We used paired dry blood spot
(DBS) and plasma with the COBASAmpliPrep/COBASTaqMan, Roche version 2 (VLref) as
the reference assay. We used the VFA at two thresholds of viral load, (>5,000 or>1,000
copies/ml).
Results
496 paired VFA and VLrefresults were available for comparative analysis. Overall, VFA
demonstrated 78.4% sensitivity, (95% CI: 69.7%–87.1%), 93% specificity (95% CI: 89.7%–
96.4%), 89.3% accuracy (95% CI: 85%–92%) and an agreement kappa = 0.72 as compared
to the VLref. The predictive values of positivity and negativity among patients on ART for >12 months were 72.7% and 99.3%, respectively.
OPEN ACCESS
Citation:Balinda SN, Ondoa P, Obuku EA, Kliphuis A, Egau I, Bronze M, et al. (2016) Clinical Evaluation of an Affordable Qualitative Viral Failure Assay for HIV Using Dried Blood Spots in Uganda. PLoS ONE 11(1): e0145110. doi:10.1371/journal.pone.0145110
Editor:Douglas F. Nixon, George Washington University, UNITED STATES
Received:April 30, 2015
Accepted:November 28, 2015
Published:January 29, 2016
Copyright:© 2016 Balinda et al. This is an open access article distributed under the terms of the
Creative Commons Attribution License, which permits unrestricted use, distribution, and reproduction in any medium, provided the original author and source are credited.
Data Availability Statement:All relevant data are available in the paper and its Supporting Information files.
Conclusions
VFA allowed 89% of correct classification of VF. Only 11% of the patients were misclassified with the potential of unnecessary or late switch to second–line ART. Our findings present an
opportunity to roll out simple and affordable VL monitoring for HIV–1 treatment in RLS.
Introduction
HIV/AIDS remains one of the world’s critical public health challenges with 36.9 million people
living with HIV and 1.2 million AIDS–related deaths at the end of 2014 [1,2]. Sub-Saharan
Africa, which represents 2.1% of the global Gross domestic product (GDP) [3], is
dispropor-tionately affected and holds 70% (25.8 million) of the world’s HIV/AIDS burden [1,2].
None-theless, recent evidence demonstrates unprecedented milestones in the global AIDS response
with a decline in the number of new infections and deaths [1,2].
Indeed there has been an exponential increase in ART coverage since 2003, with 41% (15 million people) of eligible Persons Living With HIV/AIDS (PLWHAs) accessing therapy in
sub-Saharan Africa as of march 2015 [1,2]. This rapid expansion in ART coverage creates an
urgent need for a strengthened laboratory support network for early diagnosis of HIV, timely monitoring of HIV treatment and early detection of resistance due to failing ART regimens.
Despite existing evidence and the 2013 WHO recommendations that VL testing is crucial in
predicting clinical outcomes among PLWHAs taking ART [4], implementation considerations
are inhibiting the scale up of this technology in sub–Saharan Africa. A recent report indicates
that less than 20% of African patients on ART have access to a VL testing [5]. Costs and
com-plexity are often prohibitive due to expensive VL detection equipment, the need for human resource training and laboratory infrastructure as well as operational challenges in sample col-lection, transport, storage and processing. Notwithstanding, the WHO makes a strong recom-mendation that VL is the preferred monitoring approach to diagnose and confirm ART failure.
A previous systematic review published in 2009 indicated that DBS are a practical alternative specimen source to liquid plasma for HIV testing, in terms of a stable specimen matrix, ease of
sample collection, storage and transportation [6]. We have previously reported the development
of a qualitative VFA which is simple optimizes an open platform and is compatible with finger or
heel prick DBS collection [7]. This assay was specifically designed to function as a tie-breaker for
a subsequent HIV–1 drug resistance test [8]. In the current paper, we report the performance of
this VFA as a screening tool to determine treatment failure using DBS among PLWHAs.
Methods
Ethical considerations
We obtained ethical clearance for the use of patient sample material was obtained through the Ethics review committees of JCRC, the Uganda National Council of Science &Technology (UNCST), and the Academic Medical Center of the University of Amsterdam, Netherlands. All adult participants, and parent(s) or guardian(s) of all eligible children provided written informed consent. Children above the age of 8 years who were aware of their HIV status pro-vided written informed assent.
Setting
The Joint Clinical Research Centre (JCRC) is a pioneer HIV/AIDS care, research and training
institute in Africa founded in 1991, (www.jcrc.org.ug). The JCRC operates a network of 7
Regional Centres of Excellence in Uganda, which provide comprehensive AIDS care and Competing Interests:The authors have declared
advanced laboratory tests including VL measurements. Mbale, Fort Portal and Kampala have high patient loads, are geographically representative and therefore selected for this study. In 2012, the 3 centres attended to at least 10,000 PLWHAs, whilst over 100,000 PLHWAs have ever accessed services at JCRC sites countrywide.
Design
In a cross–sectional diagnostic accuracy study between 2012 and 2013, we compared the
per-formance of the index VFA to the standard reference VL test (VLref). We report these findings
in line with the Standards for Reporting Diagnostic Accuracy Studies statement (STARD) [9].
Participants, sampling and sample size estimation
We collected DBS samples from HIV-1 positive individuals participating in the PASER-M
pro-gram [10] (36 month follow-up) and MARCH[11] studies (baseline, 6, 12 months). Using
Bur-derer’s formula [12] we estimated that a sample size of at least 490 would be sufficient to test
for diagnostic accuracy, anticipating VFA sensitivity of 85%, a true virological failure of 10% and 10% precision for a 95% Confidence Interval. These parameters were informed by our
pre-vious studies, [7,13].
Sample storage and Transportation
We stored DBS and plasma samples at -20°C and -80°C respectively, tested on site using robust affordable real-time PCR instruments (Mini-opticon). We transported plasma samples in dry-ice to the reference laboratory in Kampala for the reference testing (VLref) using the COBA-SAmpliPrep/ COBASTaqManSystem,Roche version 2.
Nucleic Acid Isolation
We described details of the laboratory procedures in our previous work published elsewhere
[7]. We performed nucleic acid isolation from DBS using the QIAamp RNA kit (Qiagen
GmbH, Germany), according to manufactures instructions. Briefly, we excised DBS samples by hand using scissors and placed two of the spots in lysis buffer and incubated at room
tempera-ture with gentle rotation for 30 min, subsequent washes and a final elution of 50μl.
Reverse Transcription
We conducted the reverse transcription as described elsewhere [6]. In short, we used the eluent
comprising both HIV-1 RNA and internal control RNA, and reverse transcribed using the TaqMan Real-time PCR system Random Hexamers RT kit (Life Technologies, Foster City,
CA) according to the manufacturer’s instructions.
Real-time PCR
We amplified HIV-1 and IC cDNA fragments in multiplex format using 300nM primer
EMC-forward(5’-TGACCACGCCACCGC-3’), 900nM primerEMC-reverse(5’-TAAAG
ATTTCCCTTGCCCCG-3’), 100nM probeEMC-VIC(5’-TGTGAGCCAGTCGTGATTGTG
CTCC-3’), 300nM forward primerLTR S4(5’-AAGCCTCAATAAAGCTTGCCTTGA-3’; HXB2
nt520-543), a mixture of 600nM HIV-LTR reverse primers3’UNI-KS-6(5’-GAGGGATCTCT
AGTTACCAGAGTCACA-3’; HXB2 nt574-600) and3’UNI-KS-6-AG(5’-GAGGGATCTCT AGTTACCAGAGTCCTA-3’; ssssHXB2 nt574-600) and 100nM MGB probeHIV-LTR-FAM
(5’- TAGTGTGTGCCCGTCTG -3’; HXB2 nt554-570); using a MiniOpticon Real-Time
allowing for dUTP/UNG decontamination; 50°C for 2 minutes; 95°C for 10 minutes; 45 cycles of 95°C for 15 seconds and 60°C for 1 minute. We validated the result of a clinical sample when the positive and negative controls, as well as the internal control, met the acceptance criteria.
HIV-1 Viral subtype
We determined the HIV-1 viral subtype in our laboratories in Amsterdam (based on baseline HIVDR sequence data) using REGA HIV-1 subtyping tool version 3.0.
Outcome measures
These included the following measures of diagnostic accuracy: sensitivity, specificity, negative predictive value (NPV), positive predictive value (PPV), area under curve (AUC), kappa agree-ment, likelihood ratios (LR) and Diagnostic Odds Ratios (DOR).
Data management and statistical considerations
We captured clinical and laboratory data onsite (single data entry) during routine patient visits, entered these into a central database and controlled for quality using query systems. We used
Stata1version 11.2 (College Station, Texas, USA) for analysis. We tabulated patient
character-istics into frequencies, proportions and appropriate measures of central tendency. Thereafter,
we employed the Stata1commands“roctab”,“roccomp”,“rocgold”and“diagti”to estimate
the diagnostic accuracy outcome measures compared to the reference standard, with 95% con-fidence intervals where appropriate. We used two definitions of viral failure as greater than
5,000 viral copies/mL (in line with the initial WHO cut–off for switching to second-line
antire-troviral therapy) and greater than 1000 copies (in line with the most recent WHO guidelines
[4]). We conducted sensitivity analyses by varying age strata (children, adults), duration on
antiretroviral therapy (<6 versus 12–36 months), HIV-1 viral subtype and study site (Kampala,
Fort Portal and Mbale). Children tend to have higher VL and their adherence patterns largely
depend on their adult guardians [14]; duration on ART reflects the durability of treatment
effect, whilst HIV-1 viral subtype may vary the treatment effect and user dependence may explain variation of assay performance across the study sites. We computed costs for equip-ment and kits from multiple sources including local facility procureequip-ment records, published
studies or conference presentations, or websites of the manufacturer (http://www.bio-rad.com/
andhttp://www.roche.com/). We obtained salary information for Laboratory Technicians
from the Uganda Public Service Single Spine Structure. We converted all costs to 2015 US dol-lars, (One US dollar ~ Uganda shillings 2,940).
Results
Clinical and socio-demo graphic characteristics of study participants
Four hundred and ninety six samples of paediatric (MARCH) and adult (PASER) HIV patients on ART were consecutively submitted for VL testing. We tested 168 (33.9%) from the MARCH cohort with a mean age of 5.6 years (SD: 3.5), of whom 54% were girls. The PASER cohort con-stituted 328 adults (66.2%) with a mean age of 38.2 (9) and majority were female (57.6%). The 496 samples were geographically from Mbale (147), Fort Portal (151) and Kampala (198). One hundred twenty four baseline samples were included and 372 participants (75%) had been on ART for at least 6 months allowing for assessment of VFA. Subtypes A (54.5%) and D (33.2%)
Overall performance of the Viral Failure Assay
The prevalence of VL5,000 copies/mL, our primary cut-off point, was 27.0% (95% CI:
22.9%–32.9%) as determined by the gold standard VLref assay and depicted inTable 2. VFA
compared to the VLrefdemonstrated 78.4% sensitivity, (95% CI: 69.7%–87.1%), 93% specificity
(95% CI: 89.7%–96.4%) and 89.3% accuracy (95% CI: 85%–92%). The AUC was 0.91 (95% CI:
0.88–0.94) whilst the kappa agreement between VFA and VLrefwas 72.2% (95% CI: 61.1%–
83.4%). The predictive value of positivity and negativity were 81.3%(95% CI: 72.9%–89.8%%)
and 91.8% (95% CI: 88.2–95.4%) respectively. The likelihood ratio for a positive test was 11.3
Table 1. Characteristics of the MARCH and PASER cohorts.
Characteristic MARCH (n = 168) PASER (n = 328) Total (n = 496)
Age (years, mean, sd) 5.6 (3.5) 38.2 (9.3) 25.8 (16.8)
Sex (Female) 91 (54.2) 189 (57.6) 280 (56.4)
Orphan 115 (67.3) n/a 115
CD4+ (%, median, IQR) 18 (12.6–25.4) 26 (19.8–35) 24 (16–32)
§CD4+ (absolute, median, IQR) 649 (318–948) 346 (228–521) 403 (255–628)
Viral Load (log10, median, IQR) 4.6 (3.6–5.2) 1.3 (1.3–2.3) 3.6 (1.3–4.8)
ART regimen (2ndline) 51 (30.4) missing 51
*Subtype
A 82 (49.7) 158 (57.5) 240 (54.5)
D 39 (23.6) 107 (38.9) 146 (33.2)
C 5 (3.0) 7 (2.5) 12 (2.7)
Recombinant 19 (11.5) 0 (0.0) 19 (4.3)
Complex 10 (6.1) 0 (0.0) 10 (2.3)
Other 10 (6.1) 3 (1.1) 13 (3.0)
Allfigures in parentheses are % unless stated otherwise
§–CD4+ cell counts at time of sampling for Viral Load measurements *–Data for HIV-1 subtype was available for 440 samples
doi:10.1371/journal.pone.0145110.t001
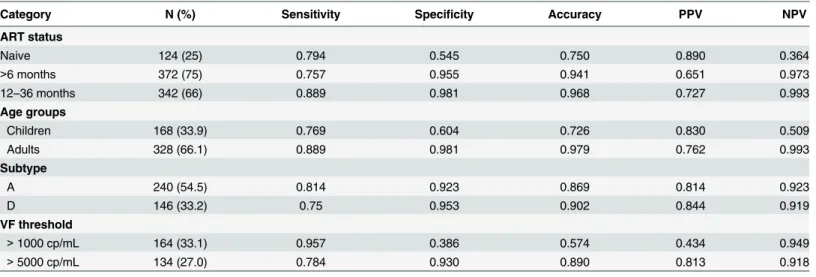
Table 2. VFA characteristics by ART status, age, VF threshold and HIV-1 subtype for>5000 copies/mL threshold.
Category N (%) Sensitivity Specificity Accuracy PPV NPV
ART status
Naive 124 (25) 0.794 0.545 0.750 0.890 0.364
>6 months 372 (75) 0.757 0.955 0.941 0.651 0.973
12–36 months 342 (66) 0.889 0.981 0.968 0.727 0.993
Age groups
Children 168 (33.9) 0.769 0.604 0.726 0.830 0.509
Adults 328 (66.1) 0.889 0.981 0.979 0.762 0.993
Subtype
A 240 (54.5) 0.814 0.923 0.869 0.814 0.923
D 146 (33.2) 0.75 0.953 0.902 0.844 0.919
VF threshold
>1000 cp/mL 164 (33.1) 0.957 0.386 0.574 0.434 0.949
>5000 cp/mL 134 (27.0) 0.784 0.930 0.890 0.813 0.918
PPV: Positive predictive value; NPV: Negative Predictive value
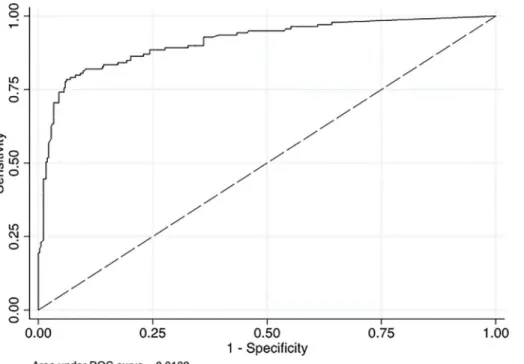
(95% CI: 6.87–18.5) while that for a negative test was 0.23 (95% CI: 0.16–0.35). The Diagnostic
Odds Ratio was 48.5 (95% CI: 13.1–84.0). The Area Under Curve (AUC) was 0.91 (Fig 1).
Sensitivity analyses
The prevalence of VL1,000 copies/mL, our primary cut-off point, was 33.1%. At this lower
HIV treatment viral failure threshold of 1,000 cp/mL, we recorded a higher yield of 95.7%
sen-sitivity (95% CI: 91.8%–99.7%), but lower specificity of 38.6% (95% CI: 32–45%) and 57.4%
accuracy (95% CI: 51.9%–63%) for the VFA as compared to VLref. These results are shown in
Table 3. The AUC was 67.2% (95% CI: 64.2%–70.3%), whilst the kappa agreement between
VFA and VLrefwas 26.3% (95% CI: 18.2%–34.4%). The predictive value of positivity and
nega-tivity were 43.4% (95% CI: 36.9%–49.9%) and 94.9% (95% CI: 90.1%–99.6%) respectively. The
likelihood ratio for a positive test was 1.56 (95% CI: 1.39–1.76) while that for a negative test
was 0.11 (95% CI: 0.04–0.28). The Diagnostic Odds Ratio was 14.1 (95% CI: -8.2–28.3).
Three hundred and seventy two (75%) and 342 (68.9%) participants had been on ART for
at least 6 months and 12–36 months respectively. At the threshold of VL1,000 copies/mL,
the predictive values of positivity and negativity among patients on ART for>6 and>12–36
months were PPV, 65.1% (95% CI: 49.1–79) versus 72.7% (95% CI: 49.8–89.3) and NPV,
97.3% (95% CI: 94.9–98.7) versus 99.3% (95% CI: 97.7–99.9) respectively. The VFA Diagnostic
Odds Ratios in these clinical ART groups were 77.1 (95% CI: 23.4–253.5) and 253 (95% CI:
48.2–1327.3) correspondingly. One hundred and twenty four samples were naïve to ART and
the AUC for this sub–population was 0.75 compared to 0.90 for those exposed to ART (Fig 2).
Fig 1. Receiver Operating Characteristics Curve for VFA compared to Cobas-Ampliprep.NB: AUC–Area under curve denotes the area in the graph below Receiver Operating Characteristic (ROC) curve, comparing the true positive to the true negative values. The true positive rate (sensitivity) is plotted in function of the false positive rate (100–specificity) for different cut–off points. Each point on the ROC curve represents a sensitivity/specificity pair
corresponding to a particular decision threshold. A test with perfect discrimination (no overlap in the two distributions) has a ROC curve that passes through the upper left corner (100% sensitivity, 100% specificity). Therefore the closer the ROC curve is to the upper left corner, the higher the overall accuracy of the test. An area of 1 represents a perfect test whilst 0.5 is a worthless test.
The VFA performance in children compared to adults demonstrated less favourable
perfor-mance characteristics: 76.9% (95% CI: 68.3–84.) versus 88.9% (95% CI: 65.3–98.6) sensitivity;
60.4% (95% CI: 45.3–74.2) versus 98.1% (95% CI: 95.8–99.3) specificity, and 72.6% (95% CI:
64.0–81.2) versus 97.9% (95% CI: 95.9–99.9) accuracy, (Table 2).
The VFA had a better sensitivity for HIV-1 viral subtype A at 81.4% compared to 75% for
subtype D, at a cut-off of>5,000 copies/ml. When we lowered the cut off to>1,000 copies/ml,
the sensitivity results were similar at 97.5% (subtype A) and 95.1% (subtype D).
Finally, VFA test accuracy ranged from 87.9% in Kampala, 88.4% in Mbale, to 92.1% for the
Fort Portal site (Table 4).
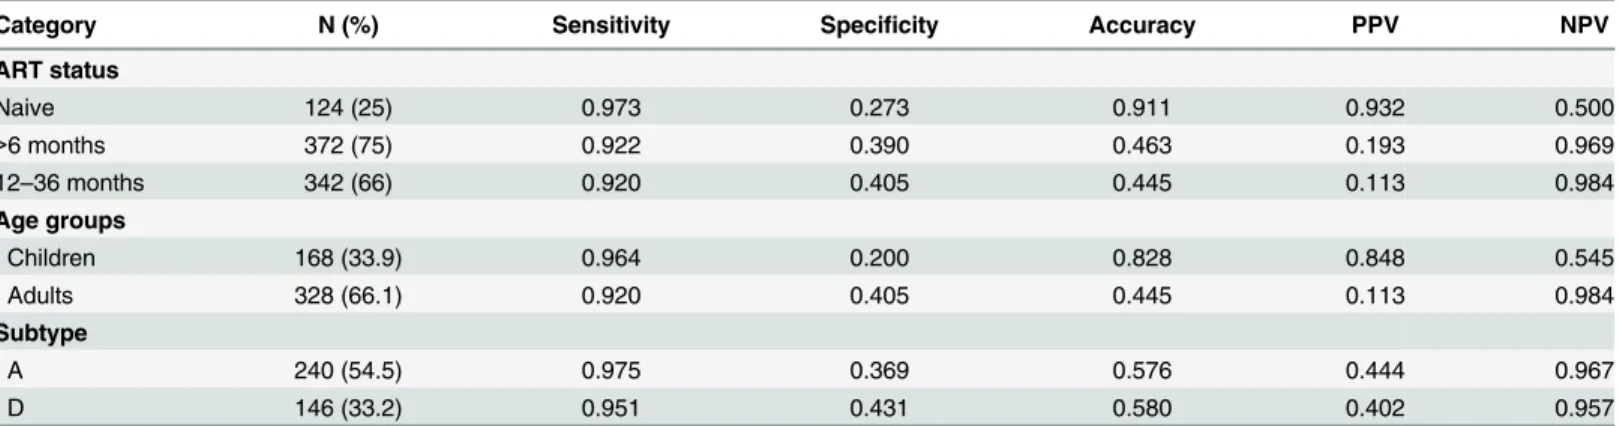
Table 3. VFA characteristics by ART status, age and HIV-1 subtype for>1000 copies/mL threshold.
Category N (%) Sensitivity Specificity Accuracy PPV NPV
ART status
Naive 124 (25) 0.973 0.273 0.911 0.932 0.500
>6 months 372 (75) 0.922 0.390 0.463 0.193 0.969
12–36 months 342 (66) 0.920 0.405 0.445 0.113 0.984
Age groups
Children 168 (33.9) 0.964 0.200 0.828 0.848 0.545
Adults 328 (66.1) 0.920 0.405 0.445 0.113 0.984
Subtype
A 240 (54.5) 0.975 0.369 0.576 0.444 0.967
D 146 (33.2) 0.951 0.431 0.580 0.402 0.957
PPV: Positive predictive value; NPV: Negative Predictive value
doi:10.1371/journal.pone.0145110.t003
Fig 2. Receiver Operating Characteristics Curve for VFA comparing ART–naïve and treated PLWHAs (VL threshold5,000 cp/mL).
Costing analysis
InTable 5, we report that the estimated capital costs for equipment of VFA was US$ 22,000
compared to US$ 200,000 for the reference standard. There were 250 and 48 tests per kit for the VFA method and the reference test estimated at US$ 6,968 and US$ 2,098 respectively. This translates to a unit cost of US$ 27.9 and US$ 49.7. Although the VFA method allows for up to 48 tests per run, logistical considerations permit about 24 per Laboratory Technician. Thus, the cost per run of VFA is US$ 683.2 (US$ 1,366.4 for 48 tests) compared to US$ 2,105.8 for the reference standard.
Discussion
The exponential increase to nearly 15 million PLWHAs on ART by march 2015 and the shift from access to quality care, makes laboratory monitoring of HIV treatment increasingly
impor-tant [1,2]. In light of the progressively shrinking donor basket, HIV treatment programs in RLS
are expected to do more with less funding [15,16,17] and thus practical solutions to this
prob-lem are urgently needed. The VFA test was developed as part of an affordable HIVDR test
algo-rithm, (ART–A). The VFA is unique, as it does not attempt to amplify target sequences
Table 4. Performance of VFA across the three study sites.
Study site Samples tested True Negative True Positive Correctly classified False Negative False Positive Incorrectlyclassified
Kampala 198 132 (0.67) 42 (0.21) 174 (0.88) 12 (0.06) 12 (0.06) 24 (0.12)
Fort Portal 151 119 (0.79) 20 (0.13) 39 (0.92) 5 (0.03) 7 (0.05) 12 (0.08)
Mbale 147 83 (0.57) 47 (0.32) 130 (0.88) 13 (0.09) 4 (0.03) 17 (0.12)
Combined 496 334 (0.67) 109 (0.22) 443 (0.89) 30 (0.06) 23 (0.05) 53 (0.11)
NB: The two tests are compared at the WHO cut-off:<5,000 cp/mL (not eligible for HIV-DR testing) and>5000 cp/mL eligible for HIV-DR testing)
doi:10.1371/journal.pone.0145110.t004
Table 5. Cost estimates for ART-A compared to the reference HIV-1 viral load test.
#Cost variable ART-A (US$) Reference test (US$)
Test kit 6,968.1 2,098
Number of tests per kit 250 48
Unit cost of each test 27.9 43.7
Turn-around-time (hours) 7.5 4.5
Number of tests per run *24 (48) 48
Salary (Laboratory Technician) (898,000), 305.4 (898,000), 305.4
Labor per run (TAT*salary) 13.63 8.18
Cost per run 683.2 (1,366.4) 2,105.8
§Equipment 22,000 200,000
§Equipment for ART
–A is the MiniOpticon real-time PCR detection system #359–1592, and a laptop computer whilst the reference standard is COBAS AmpliPrep and COBAS TaqMan1Systems #All costs were converted to 2015 US$. Costs for equipment and kits were computed from multiple sources including local facility procurement records, published studies or conference presentations, or from the website of the manufacturer (http://www.bio-rad.com/andhttp://www.roche.com/); salary for Laboratory Technician (UGX 898,000) was obtained from the Uganda Public Service Single Spine Structure; the cost per run = (labour per run)*(unit cost of each test)*(number of tests)
*Although the ARTA–A method allows for up to 48 tests per run, logistical considerations permit about 24 per Laboratory Technician.
irrelevant to HIV drug resistance monitoring in RLS (protease gene). Noteworthy, greater than 95% of PLWHAs in RLS are on first-line ART, which do not contain the Protease Inhibitors and are preserved for second-line in PLWHAs failing first-line Reverse Transcriptase inhibitor regimen. In addition, the VFA does not attempt to provide an absolute copy number of viral genomes/ml but rather focuses on a given threshold that is clinically significant (5000 or 1000 copies/ml).
We report a Viral Failure Assay on DBS that is practical, feasible, and highly specific, with moderate sensitivity, and is fairly accurate (9 out of 10 patients with VF were accurately identi-fied). This VFA had a mixed performance with generally better overall results at a higher threshold of 5000 copies/ml. Nonetheless, the VFA had varying results with a higher sensitivity at a lower threshold of 1,000 copies/ml and at a higher specificity at a higher threshold of 5000 copies/ml. This variation in performance was also seen in adults compared to children, across HIV-1 viral subtypes, study sites and with ART status.
Although, the VFA overall performance was lower in terms of sensitivity and specificity than the gold standard, this shortcoming may be outweighed by the benefits of its feasibility and cost. The VFA performance could be considered in those situations where otherwise only clinical and immunological (CD4) monitoring would be available, which is suboptimal as
com-pared to routine VL monitoring [18,19]. Further, the VFA showed a predictive value of
positiv-ity of 81.3% in the field among cohorts of PLWHAs on ART. Research literature demonstrates
that CD4 testing has a low positive predictive value of viral failure [19]. It is thus prudent to
suggest that the VFA provides an advantage in identifying PLWHAs on ART who require
switching to 2ndline therapy. The VFA generally demonstrated better receiver operating
char-acteristics at a higher viral load threshold of 5,000 copies/mL, consistent with a recent
system-atic review [20]. In fact, this review showed that specificity was close to 100% at DBS VL above
5000 copies/ml, and this threshold would be the most reliable for predicting true virologic
fail-ure using DBS [20]. This puts into perspective the current definition of VF by WHO set at
1000 copies/ml [4] and questions whether this decision results in ineligibility of (promising) in
house VL tests and in fact slows down roll-out of VL monitoring in RLS.
The finding that the VFA performed better in adults than children at our higher primary
threshold of>5,000 copies/ml remains a paradox; particularly in light of the documented
higher VL in Children as compared to adults [14]. A practical explanation could be that the
volume and quality of DBS taken from children is less compared to adults suggesting an issue of volume input contrary to the viral load.
Our study was not without limitations. First the VFA performance was sub–optimal with
lowering of the VF threshold to 1,000 copies/mL, increasing the possibility of false negatives. Hence, refining a simple technique for nucleic acid extraction from the DBS to allow maximum yield of nucleic acids, concentration of reagents, standardizing the volume of blood during sample collection could be considered in the future development of the VFA. These modifica-tions would however be made at higher cost. Secondly, the VFA showed variability in perfor-mance across the Ugandan study sites, which highlights the need for further standardisation of the assay. Genetic variability is unlikely to explain these cross-site differences since Aitken and
colleagues [7] previously optimized the assay for different HIV subtypes, which performed
Conclusions
The VFA demonstrated 89% of correct classification of the virologic response to ART in vari-ous field situations in Uganda. Basically, 1 out of 10 of patients were misclassified for VF,
creat-ing a potential risk of unnecessary or late switch to 2ndline ART. Our findings present an
opportunity to accelerate roll out of VL monitoring in RLS with an assay that produces results that are fully acceptable for public health application. Simple and low-cost routine virologic
monitoring for HIV–1 treatment could prevent emergence of drug resistance in resource–
lim-ited settings. Future studies to refine the VFA performance would consider: developing an ideal reference assay for DBS; innovating a portable and solar powered automation with the
potential to reduce the VFA turn–around–time and human error; as well as a full cost–
effec-tiveness evaluation.
Supporting Information
S1 Excel. Supplementary file.(XLS)
Acknowledgments
Special thanks to the JCRC study participants and staff in Kampala, Mbale, and Fort Portal, Uganda, for facilitating the field evaluation. Statician, Ronald Ssenyonga is appreciated for his vital contribution. The Affordable Resistance Test for Africa (ARTA) program is supported by a grant from the Netherlands Organization for Scientific Research for Global Development (NWO/WOTRO), under the Netherlands African Partnership for Capacity Development and Clinical Interventions against Poverty-related Diseases (NACCAP), (grant W.07.05.204.00).
This article is written on behalf of the ART–A consortium, which consists of Department of
Virology, University Medical Center Utrecht, Utrecht, the Netherlands; Wits Health Consor-tium, University of the Witwatersrand, Johannesburg, South Africa; Janssen Diagnostics BVBA (formerly Virco), Beerse Belgium; Centre de Recherche Public de la Santé, Luxembourg; Contract Laboratory Services, Johannesburg, South Africa; and Amsterdam Institute for Global Health and Development, Academic Medical Center, University of Amsterdam, the
Netherlands.
Author Contributions
Conceived and designed the experiments: CK PO AK MB RS NS TRW. Performed the experi-ments: SNB LK IE. Analyzed the data: SNB EAO. Contributed reagents/materials/analysis tools: SNB PO EAO AK MB. Wrote the paper: SNB PO EAO CK AK MB IE LK RS NS TRW.
References
1. UNAIDS (2013) Global Report: UNAIDS Report on the global AIDS epidemic 2013. Geneva, Switzer-land: United Nations.
2. UNAIDS (2015) How AIDS changed everything. MDG 6: 15 years, 15 lessons of hope from the AIDS response. Fact sheet. Geneva, Switzerland: United Nations. Accessed 15.09.2015 at:http://www. unaids.org/sites/default/files/media_asset/MDG6Report_en.pdf
3. Wolrd Bank (2013) Gross Domestic Product 2013. The World Bank Group.
4. WHO (2013) Consolidated guidelines on the use of antiretroviral drugs for treating and preventing HIV infection: Recommendations for a public health approach. Geneva, Switzerland: World Health Organization.
5. Médecins Sans Frontières (2013) How Low Can We Go? Pricing for HIV Viral Load Testing in Low- and
Middle-Income Countries. Paris, France: Médecins Sans Frontières. 1–8 p. Accessed 03.04.2015 at:
6. Hamers RL, Smit PW, Stevens W, Schuurman R, Rinke de Wit TF (2009) Dried fluid spots for HIV type-1 viral load and resistance genotyping: a systematic review. Antivir Ther type-14: 6type-19–629. PMID:
19704164
7. Aitken SC, Kliphuis A, Bronze M, Wallis CL, Kityo C, Balinda S et al. (2013) Development and evalua-tion of an affordable real-time qualitative assay for determining HIV-1 virological failure in plasma and dried blood spots. J Clin Microbiol 51: 1899–1905. doi:10.1128/JCM.03305-12PMID:23596235
8. Aitken SC, Bronze M, Wallis CL, Stuyver L, Steegen K, Balinda S, et al. (2013) A pragmatic approach to HIV-1 drug resistance determination in resource-limited settings by use of a novel genotyping assay targeting the reverse transcriptase-encoding region only. J Clin Microbiol 51: 1757–1761. doi:10.1128/
JCM.00118-13PMID:23536405
9. Bossuyt PM, Reitsma JB, Bruns DE, Gatsonis CA, Glasziou PP, Irwig L et al. (2003) The STARD State-ment for Reporting Studies of Diagnostic Accuracy: Explanation and Elaboration. Croat Med J 44: 639–650 PMID:14515429
10. Hamers RL, Oyomopito R, Kityo C, Phanuphak P, Siwale M, Sungkanuparph S et al. Cohort profile: The PharmAccess African (PASER-M) and the TREAT Asia (TASER-M) monitoring studies to evaluate resistance—HIV drug resistance in sub-Saharan Africa and the Asia-Pacific. Int J Epidemiol 41: 43– 54. doi:10.1093/ije/dyq192PMID:21071386
11. Sigaloff KC, Kayiwa J, Musiime V, Calis JC, Kaudha E, Mukuye A, et al. Short communication: high rates of thymidine analogue mutations and dual-class resistance among HIV-infected Ugandan chil-dren failing first-line antiretroviral therapy. AIDS Res Hum Retroviruses 29: 925–930. doi:10.1089/AID.
2012.0218PMID:23517497
12. Buderer NM (1996) Statistical methodology: I. Incorporating the prevalence of disease into the sample size calculation for sensitivity and specificity. Acad Emerg Med 3: 895–900. PMID:8870764
13. Hamers RL, Sigaloff KC, Wensing AM, Wallis CL, Kityo C, Siwale M, et al. (2012) Patterns of HIV-1 drug resistance after first-line antiretroviral therapy (ART) failure in 6 sub-Saharan African countries: implications for second-line ART strategies. Clin Infect Dis 54: 1660–1669. doi:10.1093/cid/cis254 PMID:22474222
14. Palumbo PE, Raskino C, Fiscus S, Pahwa S, Fowler MG, Spector SA, et al. (1998) Predictive value of quantitative plasma HIV RNA and CD4+ lymphocyte count in HIV-infected infants and children. JAMA 279: 756–761. PMID:9508151
15. McCoy D, Chand S, Sridhar D (2009) Global health funding: how much, where it comes from and where it goes. Health Policy Plan 24: 407–417. doi:10.1093/heapol/czp026PMID:19570773
16. Fryatt R, Mills A, Nordstrom A (2010) Financing of health systems to achieve the health Millennium Development Goals in low-income countries. Lancet 375: 419–426. doi:10.1016/S0140-6736(09)
61833-XPMID:20113826
17. Dodd R, Lane C (2010) Improving the long-term sustainability of health aid: are Global Health Partner-ships leading the way? Health Policy Plan 25: 363–371. doi:10.1093/heapol/czq014PMID:20472694
18. Tucker JD, Bien CH, Easterbrook PJ, Doherty MC, Penazzato M, Vitoria M, et al. (2014) Optimal strate-gies for monitoring response to antiretroviral therapy in HIV-infected adults, adolescents, children and pregnant women: a systematic review. AIDS 28 Suppl 2: S151–160. doi:110.1097/QAD.
0000000000000230PMID:24849475
19. Rutherford GW, Anglemyer A, Easterbrook PJ, Horvath T, Vitoria M, Penazzato M et al. (2014) Predict-ing treatment failure in adults and children on antiretroviral therapy: a systematic review of the perfor-mance characteristics of the 2010 WHO immunologic and clinical criteria for virologic failure. AIDS 28 Suppl 2: S161–169. doi:10.1097/QAD.0000000000000236PMID:24849476