Expression in Loin Muscle Tissue Identifies Candidate
Genes in Pigs
Juan Pedro Steibel1,2, Ronald O. Bates1, Guilherme J. M. Rosa3, Robert J. Tempelman1, Valencia D. Rilington1, Ashok Ragavendran1, Nancy E. Raney1, Antonio Marcos Ramos1, Fernando F. Cardoso1,4, David B. Edwards1, Catherine W. Ernst1*
1Department of Animal Science, Michigan State University, East Lansing, Michigan, United States of America,2Department of Fisheries and Wildlife, Michigan State University, East Lansing, Michigan, United States of America,3Department of Animal Sciences, University of Wisconsin, Madison, United States of America,4Embrapa Southern Region Animal Husbandry, Rio Grande do Sul, Brazil
Abstract
Background:Nearly 6,000 QTL have been reported for 588 different traits in pigs, more than in any other livestock species. However, this effort has translated into only a few confirmed causative variants. A powerful strategy for revealing candidate genes involves expression QTL (eQTL) mapping, where the mRNA abundance of a set of transcripts is used as the response variable for a QTL scan.
Methodology/Principal Findings:We utilized a whole genome expression microarray and an F2pig resource population to conduct a global eQTL analysis in loin muscle tissue, and compared results to previously inferred phenotypic QTL (pQTL) from the same experimental cross. We found 62 unique eQTL (FDR,10%) and identified 3 gene networks enriched with genes subject to genetic control involved in lipid metabolism, DNA replication, and cell cycle regulation. We observed strong evidence of local regulation (40 out of 59 eQTL with known genomic position) and compared these eQTL to pQTL to help identify potential candidate genes. Among the interesting associations, we foundaldo-keto reductase 7A2(AKR7A2) and
thioredoxin domain containing 12(TXNDC12) eQTL that are part of a network associated with lipid metabolism and in turn overlap with pQTL regions for marbling, % intramuscular fat (% fat) and loin muscle area onSus scrofa(SSC) chromosome 6. Additionally, we report 13 genomic regions with overlapping eQTL and pQTL involving 14 local eQTL.
Conclusions/Significance:Results of this analysis provide novel candidate genes for important complex pig phenotypes.
Citation:Steibel JP, Bates RO, Rosa GJM, Tempelman RJ, Rilington VD, et al. (2011) Genome-Wide Linkage Analysis of Global Gene Expression in Loin Muscle Tissue Identifies Candidate Genes in Pigs. PLoS ONE 6(2): e16766. doi:10.1371/journal.pone.0016766
Editor:Roland Roberts, King’s College London, United Kingdom
ReceivedSeptember 28, 2010;AcceptedJanuary 4, 2011;PublishedFebruary 8, 2011
Copyright:ß2011 Steibel et al. This is an open-access article distributed under the terms of the Creative Commons Attribution License, which permits unrestricted use, distribution, and reproduction in any medium, provided the original author and source are credited.
Funding:This project was supported by National Research Initiative Competitive Grant no. 2004-35604-14580 from the USDA National Institute of Food and Agriculture. The funders had no role in study design, data collection and analysis, decision to publish, or preparation of the manuscript.
Competing Interests:The authors have declared that no competing interests exist. * E-mail: [email protected]
Introduction
Integration of transcriptional profiling with genotyping data in segregating populations allows linkage mapping of expression quantitative trait loci (eQTL) [1,2]. Over the last decade, such studies have been conducted in human cell lines and model organisms [3] and in plant species [2,4], but in livestock species global eQTL experiments are still sorely lacking. In particular, genetical genomics studies in livestock have concentrated on experimental design and modeling issues [5,6,7,8], on the analysis of selected transcripts [9] or on the comparative transcriptional profiling of genetically diverging lines [6,10], and only recently has a global analysis been published for pigs [11].
The implementation of eQTL mapping has the potential to uncover gene networks and the genetic control of gene activity, as well as shed light on the genetic architecture of phenotypic variation, through integration with phenotypic QTL (pQTL) results [12].
To date, 5,732 pig QTL have been reported to the PigQTLdb database (http://www.animalgenome.org/QTLdb/) [13] for a total of 588 traits, but a very small proportion of these have materialized into causative variation associated with known genes [14].
The use of eQTL analysis has been demonstrated as a promising tool for narrowing the gap between detected pQTL regions and confirmed causative variants for the pig species [14]. Additionally, eQTL mapping can be used to reconstruct regulatory networks involving endpoint traits and expression traits, resulting in information useful for selection decisions [12]. For example, previous work has detected gene expression traits associated with pQTL for drip loss, an important pork quality trait [9,15]. However, results were derived from a series of pre-selected transcripts based on phenotypic correlations with a trait of interest. This group has recently performed an eQTL analysis for
In this paper, we present a genome-wide linkage analysis of global gene expression using an F2 intercross of two pig breeds
(Duroc and Pietrain). We used a sub-sample [7] from a large resource population that we created for pQTL mapping [16,17]. We tested the expression of almost 20,000 transcripts on a recently developed microarray for linkage across the pig genome. Furthermore, we compared existing pQTL regions with local eQTL to identify candidate genes for traits of interest. We also performed gene set analysis to uncover regulatory networks subject to genetic control.
Results
Physical location of oligonucleotides
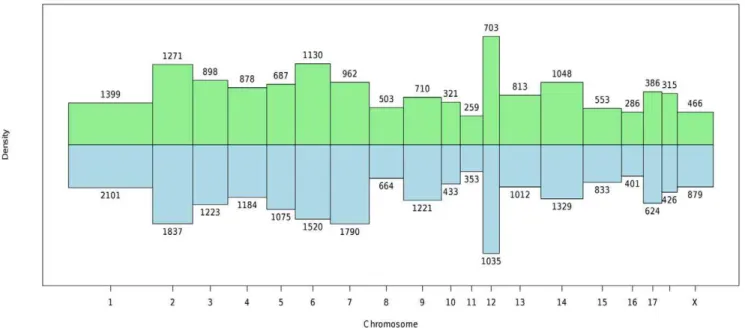
To evaluate gene expression we used the swine protein-annotated oligonucleotide microarray (Pigoligoarray) [18]. This microarray includes 20,400 unique 70-mer oligonucleotides designed from contigs developed by comparison of expressed sequence tags to phylogenetically defined vertebrate proteins. Our previous publication [18] included comparative annotation for this array, but determining the physical positions of the oligonucleo-tides in the pig genome was not possible at that time. Determination of local and distant regulatory variation requires knowledge of the physical positions of probes on the expression profiling platform. We aligned 20,400 oligonucleotides from the Pigoligoarray [18] with the pig genome (Build 9; www.ensembl. org). The array included 19,980 non-control probes along with negative and mismatch probes, and we determined the positions for 13,611 oligonucleotides. Therefore, approximately one third of the probes could not be aligned to the current pig genome assembly. A list of these oligonucleotides and their positions is available in the Supporting Information (Table S1). The number of oligonucleotides per chromosome ranged between 286 for Sus scrofa(SSC) chromosome 16 to 1,399 for SSC1 (Figure 1). SSC12 presented the highest density of oligonucleotides per megabase,
whereas SSC11, 16 and X had the lowest densities. We compared the physical distribution of oligonucleotides with the distribution of automatically annotated genes along the pig genome (Figure 1). Coverage was uniform across chromosomes as shown in Figure 1 where the relative number of genes and oligonucleotides for each chromosome was similar.
Significance tests and putative eQTL
The datasets for analysis included gene expression data (normalized log-intensity) for each transcript determined from
longissimus dorsimuscle (loin muscle) tissue for each F2animal, and
genotype and phenotype information for a three generation pig pedigree (F0, F1 and F2 individuals). Genotype information was
used to derive breed of origin probabilities across the genome of F2
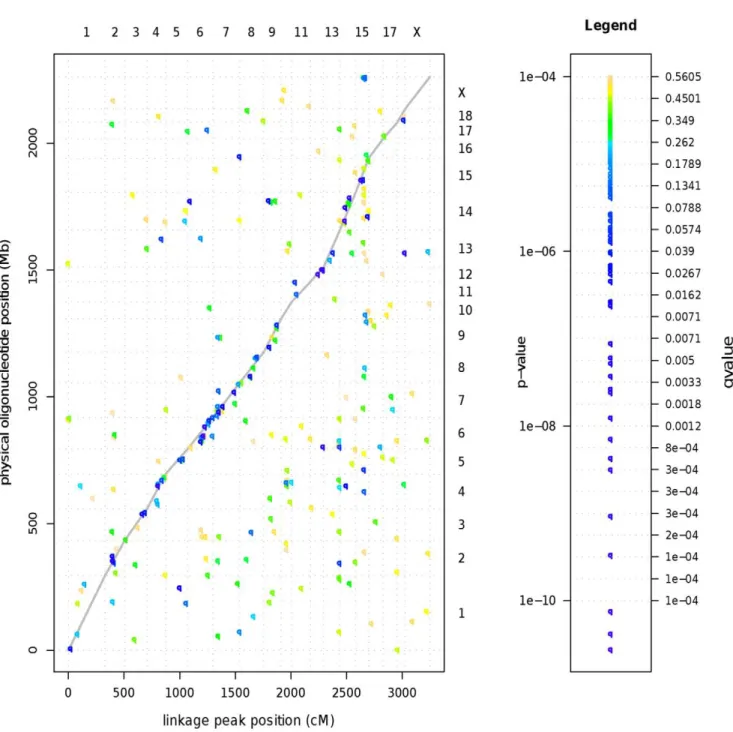
animals at each marker and at 11 equidistant inter-marker positions yielding 1,279 putative QTL positions. We subsequently fit linear mixed models to each expression trait (20,400) and putative QTL position. A nominal p-value was used to test the null hypothesis of no eQTL at each position and expression trait combination. Testing for 1,279 putative QTL positions in almost 20,000 expression traits produced over 26 million p-values that required multiple test correction. Inspection of the quantile-quantile plots of values (Figure 2) revealed an excess of smaller p-values compared to what was expected under the null hypothesis. Using a p-value cutoff of P,0.0001, a total of 397 putative eQTL peaks were inferred and 253 of those were associated with oligonucleotides with known physical position. Notably, local (putatively cis-acting) eQTL had in general smaller p-values compared to trans-acting eQTL. The global pattern is represented in Figure 3.
For individual gene analyses, a more stringent significance threshold (P,0.0000035, FDR,10%) was used. This produced a total of 978 significant tests, corresponding to 62 unique linkage peaks comprising 59 genes with comparative human gene
Figure 1. Histogram of oligonucleotide and gene densities across chromosomes.Green bars pointing up represent the distribution of oligonucleotides on the microarray. Blue bars pointing down represent the distribution of genes in the pig genome assembly (Build 9, www.ensembl. org). The bar width is proportional to chromosome length in base pairs, the height of the bar is proportional to the feature density, and the area of the bar is proportional to the feature count. Counts next to each bar represent oligonucleotide (green bars) and gene counts (blue bars). doi:10.1371/journal.pone.0016766.g001
Expression QTL in Pig Muscle Tissue
annotation (Tables 1 and 2). The positional analysis of these oligonucleotides indicated that 40 of these 59 eQTL were located on the same chromosome as the physical location of the oligonucleotide (local eQTL). Very limited evidence of hotspots of trans-regulation was found on only SSC13 and SSC15 after correction for multiple tests (Figure 4). At a nominal p-value threshold of P,0.0001, we would expect 20 false positives at any putative QTL position. The hotspot on SSC13 includes 27 eQTL and the hotspot on SSC15 includes 23 significant eQTL. We consider that these putative hotspots are actually not significant once we correct for multiple tests; a confirmation would require a computationally prohibitive permutation analysis [19] and conse-quently we do not pursue further study of trans regulation in this paper.
Gene networks subject to genetic control
The p-values and fold-changes (relative expression of Duroc to Pietrain allele of origin) for significant eQTL were input into the Ingenuity Pathways Analysis software (Ingenuity Systems, Red-wood City, CA, USA) for further data mining of pathways subject to genetic control. Three gene networks were enriched for differentially expressed genes between alleles of alternative breed origin (Table 3). This suggests that the corresponding eQTL genes influence loin muscle tissue accretion via common metabolic pathways. One network associated with lipid metabolism includes two members of the cytochrome P450 4F family of genes which are involved in the metabolism of long chain fatty acids, and these two genes were overexpressed in animals carrying the Duroc allele. This network also contains several genes includingaldo-keto reductase 7A2(AKR7A2),thioredoxin domain containing 12(TXNDC12) andtranslocase of inner micochondrial membrane 44(TIMM44) that have functions related to oxidative stress and which were overexpressed in animals carrying the Pietrain allele. A second network associated with the cell cycle and lipid metabolism includes three members of the glutathione S-transferase mu family as well as
glutathione peroxidase 8 (GPX8), again showing an increase in expression of genes with functions related to oxidative stress in animals with the Pietrain allele. This network also includes two genes overexpressed in animals with the Duroc allele that function as transcriptional repressors (zinc finger protein 24 (ZNF24) and
enhancer of rudimentary homolog (ERH)). A third network associated with DNA replication, recombination and repair, the cell cycle, and cell death includes several genes that function in cell growth or the cell cycle which were all overexpressed in animals carrying the Pietrain allele (cyclin-dependent kinase 2(CDK2),methionyl aminopeptidase 1(METAP1),suppressor of fused homolog (SUFU),synovial sarcoma X breakpoint 2 interacting protein (SSX2IP), and Werner syndrome RecQ helicase-like(WRN)). These results support these genes and networks as promising candidates for sources of variation in growth, carcass merit and meat quality observed in this population.
Co-localization analysis
Analysis for pQTL was performed for over 60 growth, carcass merit and meat quality traits measured on the Michigan State University Duroc x Pietrain F2resource population [16,17]. Many
of these traits were measured on (or were directly related to) the same tissue where mRNA abundance was measured (i.e., loin muscle). We subsequently performed a co-localization analysis between pQTL and eQTL, and significant pQTL traits observed in this analysis were related to muscle size and meat quality. Co-localization analysis of pQTL and eQTL traits revealed 62 overlapped eQTL/pQTL regions, significantly more than expect-ed by chance. We groupexpect-ed these into 13 common genomic regions (Table 4) on seven chromosomes. Thus, these loci are candidate genes for the pQTL. Four pQTL regions linked to muscle size traits overlap local eQTL for DYNLT1 on chromosome 1,
TXNDC12 on SSC6, MRLP14 on SSC7 andWRN on SSC15. Traits related to meat color have pQTL overlapping eQTL on SSC15 (OCA2) and SSC8 (LIMCH1,METAP1). Expression QTL regions on SSC6 (AKR7A2) and SSC12 (PPNO, COIL) overlap pQTL for intramuscular fat traits. Moisture content had three pQTL regions coincident with local eQTL (PPNO, COIL on SSC12,ETV2on SSC6 andLIMCH1on SSC8). Protein content had two pQTL regions associated with eQTL, one on SSC6 that also coincided with pQTL for muscle size (TXNDC12) and another on SSC15 (CDK2). A pQTL region for meat tenderness overlapped the eQTL forWRN(SSC15) that also coincided with pQTL for muscle size. Ultimate meat temperature had a pQTL coincident with an eQTL forTMEM69on SSC6. Finally, a single eQTL region for loin muscle off-flavor on SSC2 overlapped a local eQTL forRFXANK.
Discussion
We performed a genome-wide linkage analysis of global gene expression in a segregating swine population. Previous studies of eQTL in pigs used a global expression array [9], but the analysis itself was restricted to a set of pre-selected genes based on correlations with a trait of interest [9,15]. In contrast, we did not pre-screen probes on the microarray for differential expression or correlations, but instead performed a QTL scan for transcript abundances derived from each probe. In this way, we did not bias the eQTL discovery towards genes correlated with a particular trait at the expense of introducing multiple testing that when accounted for may result in less power. Recently, Ponsuksili et al. [11] performed QTL analysis of expression traits inlongissimus dorsi
muscle of a Duroc x Pietrain cross. They used a different significance criteria than we used in our study leading to over 9,000 putative eQTL. Among their findings, they identified local
eQTL forOCA2andAKR7A2in similar chromosomal positions to local eQTL for these transcripts that we identified in our study.
Deriving eQTL profiles for each of 20,000 probes is a computationally prohibitive task using publicly available software for QTL mapping in crosses of outbred lines [20]. Consequently, we programmed a computationally tractable implementation of the line cross model [21], that can accommodate random and fixed effects as required by two-color microarray data [22]. All programs are available upon request from the authors.
The expression platform used was the Pigoligoarray [18], which allowed us to infer local (on the same chromosome) or distant eQTL for over 13,000 probes. Comparatively, an alternative
expression platform from the Affymetrix company currently has less than 9,000 probesets mapped to the pig genome (www. ensembl.org; queried April 2010 using http://www.biomart.org/). The physical position of oligonucleotides on the Pigoligoarray was generated as part of this work and is made available as additional annotation (Table S1).
To set a threshold for declaring statistical significance, we used a stringent p-value cutoff of P,3.561026. Due to the many simultaneous tests performed, this resulted in a FDR of 10%. Even with this significance level we found 62 eQTL, of which 40 had linkage peaks on the same chromosome where the oligonucleotide was physically located.
Figure 3. Global plot of physical position of oligonucleotide probe versus linkage position of eQTL across the pig genome.Points along the gray curve represent local eQTL (most likely cis-acting), while points off the line represent trans-acting eQTL. Colors represent increasing significance from yellow to green to blue to indigo.
doi:10.1371/journal.pone.0016766.g003
Expression QTL in Pig Muscle Tissue
This analysis has revealed new gene targets for further validation as potential genes controlling variation in pig pQTL traits. Among the local (potentially cis-acting) eQTL genes, many have limited functional information reported for any species. However, for eQTL genes that have been studied, although they would not have been obvious functional candidates for the pQTL trait phenotypes, consideration of their known functions can reveal potentially new biological roles for these genes in pig skeletal muscle.
The genes encoding aldo-keto reductase 7A2 (AKR7A2) and
thioredoxin domain containing 12 (TXNDC12) both have roles in oxidative stress and cellular detoxification. Our results revealed a significant AKR7A2 eQTL coincident with pQTL for % intramuscular fat and marbling traits on SSC6. While AKR7A2
has been shown to be ubiquitously expressed in numerous human
tissues including skeletal muscle [23], no reports have examined
AKR7A2 in skeletal muscle under varying physiological states. However, Picklo et al. [24] reported AKR7A2 expression to be elevated in cerebral cortexes of Alzheimer’s disease patients, a disease associated with elevated aldehyde products.TXNDC12has also been shown to be expressed in many human tissues including skeletal muscle [25]. While no studies have considered the function of TXNDC12 in skeletal muscle, its role as a thiol-disulfide oxidoreductase in other cell types has been demonstrated [26,27,28]. Our results indicate SSC6 pQTL for protein content, loin muscle area (LMA) and loin muscle chop weight coincident with an eQTL forTXNDC12.
An eQTL fordynein light chain Tctex-type 1(DYNLT1) coincident with a pQTL for LMA was observed on SSC1. DYNLT1 is a component of the dynein complex which is part of the
Table 1.Details of eQTL detected on Chromosomes 1–7.
Linkage peak Annotation Physical Position
SSC cM Flanking markers h2 Overa p-value OligoID HGNC SSC Base pair Methodb Local
1 21.2 SW1514 SW1515 4.7% Du 7.00E-07 19030:2021_CL1Contig1:f DYNLT1 1 9.6M BLAT YES
1 70.6 S0008 S0331 1.5% Du 1.30E-07 35366:45360_37797494:f UNKNW
2 69.3 SW240 S0170 10.9% Du 2.61E-07 11910:1243_CL4Contig1:f CKMT2 2 79.1M BLAT YES
2 70.5 S0170 S0170 8.9% Du 2.45E-08 12040:12202_CL2Contig7:r CYP4F2 2 60.4M BLAT YES
2 72.6 S0170 SW1026 5.6% Pie 6.10E-08 12039:12202_CL2Contig2:r CYP4F3 2 60.4M BLAT YES
2 88.9 SW1026 S0370 5.7% Du 1.08E-07 12429:2139_CL1Contig1:r RFXANK 2 61.7M–63.6M Comp YES
3 158.4 SW2408 SW2408 9.2% Du 6.62E-07 NM_213966.1 LCTHIO 3 105.2M BLAT YES
3 182.1 SW1327 SW2532 5.1% Pie 9.99E-07 13665:2306_9018750:f KCNS3 3 111.3M BLAT YES
4 76.4 SW2454 SW2454 4.0% Du 1.27E-06 9659:11373_CL1Contig2:f S100A1 4 83.3M–105.2M Comp YES
4 92.6 S0107 S0214 8.9% Pie 2.90E-08 2602:3589_CL1Contig1:f ZFAND1 4 0.9M–83.3M Comp YES
4 100.7 S0107 S0214 10.4% Pie 1.26E-08 20010:19865_CL1Contig1:f DUSP12 4 92.5M BLAT YES
4 131.1 S0214 S0097 3.1% Du 2.60E-06 31129:32045_49416036:f GSTM5 13 112.8M BLAT NO
4 131.1 S0214 S0097 8.0% Du 1.30E-06 30881:32045_CL1Contig1:r GSTM4 13 113.0M Comp NO
4 136.1 S0214 S0097 11.9% Pie 2.72E-06 33801:32045_59789022:f GSTM1 4 115M BLAT YES
4 136.1 S0214 S0097 12.8% Pie 2.95E-07 30820:32045_34160672:f GSTM1 13 113.0M Comp NO
4 141.1 S0214 S0097 7.9% Pie 1.13E-10 33036:32045_CL3Contig1:r GSTM4 13 113.0M Comp NO
5 129.2 SW2 S0005 8.3% Du 2.69E-07 12773:4749_CL1Contig1:f ZBTB5 1 249.6M BLAT NO
5 132.1 SW2 S0005 16.9% Du 2.26E-06 10816:45360_CL475Contig1:r CLEC1A 5 58.5M BLAT YES
6 20.4 S0099 SW2406 4.1% Du 5.55E-07 19460:24177_CL1Contig1:f Gcshd 14 116.6M BLAT NO 6 118.9 S0087 S0220 13.4% Du 6.83E-07 4057:25577_CL11Contig1:r ETV2 6 30.3M BLAT YES
6 142.1 SW122 SW1881 6.1% Pie 7.59E-11 5683:11259_CL1Contig1:r AKR7A2 6 53.3M BLAT YES
6 149.0 SW122 SW1881 9.3% Du 2.85E-10 31282:45360_CL420Contig1:f ZNF24 4 115.0M Comp NO
6 155.8 SW122 SW1881 5.8% Du 7.17E-09 9232:7693_25014272:r SSX2IP 6 89.1M BLAT YES
6 194.4 SW1881 SW322 4.1% Du 1.53E-06 9344:7136_CL1Contig1:r TXNDC12 6 114.0M BLAT YES
6 220.8 SW322 SW2419 18.5% Pie 2.74E-11 15007:3644_CL1Contig1:r TMEM69 6 88.8M–122.2M Comp YES
7 55.4 S0064 SW1369 8.2% Du 3.76E-08 34740:1138_CL1Contig12:mm2 HLA-A
7 90.4 SW1369 SW859 13.6% Pie 6.10E-07 32929:10370_CL1Contig2:r MRPL14 7 45.6M BLAT YES
7 193.8 S0115 SWR773 7.8% Pie 8.89E-08 688:4338_CL1Contig2:r ERH 7 101.5M BLAT YES
7 241.5 SW764 SW764 6.7% Du 3.54E-11 17750:32199_CL8Contig1:f RAP2C
7 241.5 SW764 SW764 1.8% Du 9.90E-07 17698:46145_21549326:f CDH12 16 9.4M BLAT NO
aBreed of origin of over-expressed allele: Duroc (Du) or Pietrain (Pie).
bMethod used to determine oligonucleotide physical position: BLAST-Like Alignment Tool alignment of 70-mer (BLAT) or Comparative mapping of putative human gene onto pig genome sequence (Comp).
cLocal QTL is called when oligo is on same chromosome as eQTL peak.
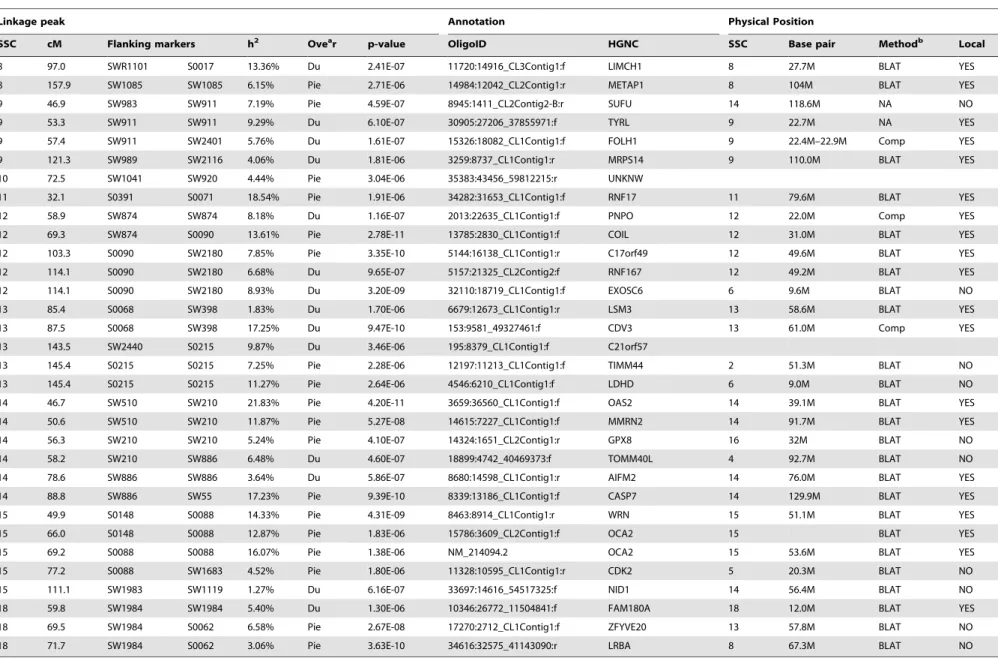
Table 2.Details of eQTL detected on Chromosomes 8 – 18 and X.
Linkage peak Annotation Physical Position
SSC cM Flanking markers h2 Ovear p-value OligoID HGNC SSC Base pair Methodb Local
8 97.0 SWR1101 S0017 13.36% Du 2.41E-07 11720:14916_CL3Contig1:f LIMCH1 8 27.7M BLAT YES
8 157.9 SW1085 SW1085 6.15% Pie 2.71E-06 14984:12042_CL2Contig1:r METAP1 8 104M BLAT YES
9 46.9 SW983 SW911 7.19% Pie 4.59E-07 8945:1411_CL2Contig2-B:r SUFU 14 118.6M NA NO
9 53.3 SW911 SW911 9.29% Du 6.10E-07 30905:27206_37855971:f TYRL 9 22.7M NA YES
9 57.4 SW911 SW2401 5.76% Du 1.61E-07 15326:18082_CL1Contig1:f FOLH1 9 22.4M–22.9M Comp YES
9 121.3 SW989 SW2116 4.06% Du 1.81E-06 3259:8737_CL1Contig1:r MRPS14 9 110.0M BLAT YES
10 72.5 SW1041 SW920 4.44% Pie 3.04E-06 35383:43456_59812215:r UNKNW
11 32.1 S0391 S0071 18.54% Pie 1.91E-06 34282:31653_CL1Contig1:f RNF17 11 79.6M BLAT YES
12 58.9 SW874 SW874 8.18% Du 1.16E-07 2013:22635_CL1Contig1:f PNPO 12 22.0M Comp YES
12 69.3 SW874 S0090 13.61% Pie 2.78E-11 13785:2830_CL1Contig1:f COIL 12 31.0M BLAT YES
12 103.3 S0090 SW2180 7.85% Pie 3.35E-10 5144:16138_CL1Contig1:r C17orf49 12 49.6M BLAT YES
12 114.1 S0090 SW2180 6.68% Du 9.65E-07 5157:21325_CL2Contig2:f RNF167 12 49.2M BLAT YES
12 114.1 S0090 SW2180 8.93% Du 3.20E-09 32110:18719_CL1Contig1:f EXOSC6 6 9.6M BLAT NO
13 85.4 S0068 SW398 1.83% Du 1.70E-06 6679:12673_CL1Contig1:r LSM3 13 58.6M BLAT YES
13 87.5 S0068 SW398 17.25% Du 9.47E-10 153:9581_49327461:f CDV3 13 61.0M Comp YES
13 143.5 SW2440 S0215 9.87% Du 3.46E-06 195:8379_CL1Contig1:f C21orf57
13 145.4 S0215 S0215 7.25% Pie 2.28E-06 12197:11213_CL1Contig1:f TIMM44 2 51.3M BLAT NO
13 145.4 S0215 S0215 11.27% Pie 2.64E-06 4546:6210_CL1Contig1:f LDHD 6 9.0M BLAT NO
14 46.7 SW510 SW210 21.83% Pie 4.20E-11 3659:36560_CL1Contig1:f OAS2 14 39.1M BLAT YES
14 50.6 SW510 SW210 11.87% Pie 5.27E-08 14615:7227_CL1Contig1:f MMRN2 14 91.7M BLAT YES
14 56.3 SW210 SW210 5.24% Pie 4.10E-07 14324:1651_CL2Contig1:r GPX8 16 32M BLAT NO
14 58.2 SW210 SW886 6.48% Du 4.60E-07 18899:4742_40469373:f TOMM40L 4 92.7M BLAT NO
14 78.6 SW886 SW886 3.64% Du 5.86E-07 8680:14598_CL1Contig1:r AIFM2 14 76.0M BLAT YES
14 88.8 SW886 SW55 17.23% Pie 9.39E-10 8339:13186_CL1Contig1:f CASP7 14 129.9M BLAT YES
15 49.9 S0148 S0088 14.33% Pie 4.31E-09 8463:8914_CL1Contig1:r WRN 15 51.1M BLAT YES
15 66.0 S0148 S0088 12.87% Pie 1.83E-06 15786:3609_CL2Contig1:f OCA2 15 BLAT YES
15 69.2 S0088 S0088 16.07% Pie 1.38E-06 NM_214094.2 OCA2 15 53.6M BLAT YES
15 77.2 S0088 SW1683 4.52% Pie 1.80E-06 11328:10595_CL1Contig1:r CDK2 5 20.3M BLAT NO
15 111.1 SW1983 SW1119 1.27% Du 6.16E-07 33697:14616_54517325:f NID1 14 56.4M BLAT NO
18 59.8 SW1984 SW1984 5.40% Du 1.30E-06 10346:26772_11504841:f FAM180A 18 12.0M BLAT YES
18 69.5 SW1984 S0062 6.58% Pie 2.67E-08 17270:2712_CL1Contig1:f ZFYVE20 13 57.8M BLAT NO
18 71.7 SW1984 S0062 3.06% Pie 3.63E-10 34616:32575_41143090:r LRBA 8 67.3M BLAT NO
aBreed of origin of over-expressed allele: Duroc (Du) or Pietrain (Pie).
bMethod used to determine oligonucleotide physical position: BLAST-Like Alignment Tool alignment of 70-mer (BLAT) or Comparative mapping of putative human gene onto pig genome sequence (Comp). cLocal QTL is called when oligo is on same chromosome as eQTL peak.
doi:10.1371/journal.pone.0016766.t002
Expressi
on
QTL
in
Pig
Muscle
Tissue
PLoS
ONE
|
www.plos
one.org
6
February
2011
|
Volume
6
|
Issue
2
|
microtubule-based motile process within the cellular cytoskeleton [29]. Microtubules are not present in appreciable amounts in the cytoskeleton of skeletal muscle [30]. DYNLT1 is most highly expressed in human immune system cells and testis, and is expressed at relatively lower levels in skeletal muscle (BioGPS; http://biogps.gnf.org/), although expression was detected in all tissues examined by Watanabe et al. [31] using northern blot analysis, with skeletal muscle exhibiting relatively high abundance compared to other tissues. Reports regarding the function of
DYNLT1have focused on the role of this gene in mouse neuron development [32] and have included observations of direct interaction of this protein with specific neuronal Ca2+ channels in rats [33]. Further research will be needed to determine if this gene has a similar function in pig skeletal muscle tissue.
Werner syndrome protein(WRN) is a member of a family of RecQ helicases that are involved in maintenance of genome stability.
WRNhas roles in DNA replication and repair, transcription, and telomere maintenance, and defects in WRN cause Werner
syndrome, an autosomal recessive disorder associated with premature aging [34]. Our results identified a WRN eQTL coincident with pQTL for LMA and tenderness on SSC15. While no studies have been reported regarding the role of WRN in skeletal muscle, the functions of this protein in cell growth and transcription support the potential effects on muscle size and meat quality phenotypes observed in this study and indicate that further study is warranted.
An eQTL for cyclin-dependent kinase 2(CDK2) coincident with a pQTL for protein content was observed on SSC15. CDK2 is involved in control of the cell cycle and also has cell cycle independent functions including DNA damage repair [35]. In skeletal muscle, CDK2 has been shown to be a part of the mechanism that tightly controls MyoD levels and subsequent myoblast cell cycle progression or exit into differentiation [36]. In addition, Thomas et al. (2000) demonstrated with in vitro studies that myostatin decreased levels and activity ofCDK2in myoblasts and also altered expression of other cell cycle components which
Table 3.Description of three networks enriched for eQTL genes.
Associated terms Gene Symbolsa
Lipid Metabolism, Small Molecule Biochemistry, Post-Translational Modification
ACTN1,AKR7A2,CASP2, CASP4,CASP7,CCNE1, CTSD, CYP4F2, CYP4F3, DNAJA3, DUSP12,DYNLL2, DYNLT1, HNF4A, LSM3, MRPS14, PAWR, PNPO, PSMA1,RAP2C,RNF167, S100A1,SART3, SLC2A4, SOCS3,TIMM44, TXNDC12,UBE2M,ZFYVE20
Cell Cycle, Drug Metabolism, Lipid Metabolism AIFM2, BYSL,CASP7,CBL, CCDC130, CCNE1, CEP70,COIL,ERH, FOLH1,GCSH, GPX8, GSTM1, GSTM4, GSTM5,IGSF21,LRBA,MAD1L1, MYO5B, MYO6, NID1, PINK1, PSME3, PTPRK, TGFB1, TP53, TSPYL2,ZBTB5,ZBTB16, ZNF24
DNA Replication, Recombination, and Repair, Cell Cycle, Cell Death
BCL2L12, CASP3,CASP7, CDK2,CENPC1, CKMT2, CTNNB1, CXCL12, DFFB, E2F4, EXOSC6, GAS2, HSH2D, KCNS3, LIMCH1,METAP1,MRPL14, MYC,OAS2, RFXANK,RNF17, SSX2IP, SUFU, WRN
aGene symbols inbolddenote genes with significant eQTL and overexpressed in animals carrying the Pietrain allele. Gene symbols that are underlined denote genes with significant eQTL and overexpressed in animals carrying the Duroc allele. Gene symbols in black denote genes in the network with no eQTL detected. Networks and associated terms were determined using the Igenuity Pathways Analysis software (Ingenuity Systems, Redwood City, CA, USA).
doi:10.1371/journal.pone.0016766.t003
Figure 4. Number of putative eQTL per genomic position (p,0.0001).Vertical dotted lines represent the chromosome limits in the linkage map. The horizontal line indicates the expected number of significant eQTL under the null hypothesis (of no linkage). The number of putative eQTL rises above the threshold in only two hotspots. This indicates that despite finding strong evidence of eQTL, our study does not show evidence of the presence of hotspots.
led to arrest of myoblasts in the G(1)-phase of the cell cycle. While no studies have considered the function of CDK2 in postnatal muscle satellite cells or mature myofibers, further study is needed to evaluate the potential role of this gene in pig skeletal muscle growth and to confirm the association of this gene with skeletal muscle protein content.
The oculocutaneous albinism II (OCA2) gene has been studied extensively for its role in the mammalian pigmentary system [37]. Allelic variants of OCA2 define human blue-brown eye color;
OCA2also functions in melanin synthesis within melanocytes, and aberrant OCA2 alleles cause type 2 oculocutaneous albinism in humans. Our results identified a significant OCA2 eQTL coincident with a pQTL for both objective and subjective meat color phenotypes on SSC15. No previous studies have reported an association of this gene with muscle color. Additional research will be needed to confirm this association and to determine if the cellular mechanism involves tyrosine transport similar to the mechanism in melanocytes.
This whole genome linkage analysis of global gene expression provides insight into genes and gene networks subject to genetic control in a segregating pig population. Individual gene analyses allowed identification of candidate genes in previously mapped pQTL regions.
Methods
Animals and genotyping
The Michigan State University (MSU) pig resource population is an F2cross originated from 4 F0Duroc sires and 16 F0Pietrain
dams. The full pedigree includes a single large family of 20 F0, 56
F1and 954 F2 animals. We have previously published details of
this cross [17]. Briefly, from the F1 progeny, 50 females and 6
males were retained to produce the F2 generation. Pigs were
weaned at 16 to 25 (mean 19.8) days of age and moved into nursery pens. All diets fed were MSU standard swine farm diets that met or exceeded National Research Council [38] require-ments for all nutrients at each production stage. At 10 weeks of age, F2pigs were moved into finishing facilities at the MSU Swine
Teaching and Research Farm. Pigs hadad libitum access to feed and water.
Of the 954 total F2animals for which growth, carcass and meat
quality phenotypes were recorded, 510 F2pigs along with the F0
and F1pigs were genotyped for 124 microsatellite markers (3–9
makers per chromosome) in an initial genome scan [16,17]. These 510 animals were sampled from 61 litters across all farrowing groups and represented all F1sires with at least 100 grand progeny
from each F0 sire. By using the three generation pedigree, the
breed of origin probability for each putative QTL position can be obtained if the QTL is assumed fixed for alternative alleles in each breed.
Ethics statement
Experimental procedures were approved by the All University Committee on Animal Use and Care at Michigan State University (AUF#09/03-114-00).
Phenotype collection
Details of growth, carcass and meat quality phenotypes collected on the MSU Duroc x Pietrain resource population have been reported previously [16,17]. Briefly, live animal traits collected on the F2pigs included body weight at birth, weaning,
and 6, 10, 13, 16, 19 and 22 weeks of age. In addition, B-mode ultrasound (Pie Medical 200SLC, Classic Medical Supply Inc., Tequesta, FL) estimates of 10th-rib backfat (BF10), last-rib backfat
(LRF), and loin muscle area (LMA) were recorded at 10, 13, 16, 19 and 22 weeks of age. The average daily gain from 10 to 22 weeks of age and the number of days to reach 105 kg were calculated from these body weight measures [17]. At each of these timepoints, measures of fat-free total lean (FFTOLN), total body fat tissue (TOFAT), empty body protein (EBPRO), and empty body lipid (EBLIPID) were calculated [17]. For slaughter, pigs were transported to one of two abattoirs. A total of 176 pigs were slaughtered at the federally inspected MSU Meat Laboratory (East Lansing, MI) to facilitate tissue collection for the current study, and the remaining pigs were slaughtered in a federally inspected plant in western Michigan (DeVries Meats, Coopersville, MI). Slaughter age was 165.869.2 d (11269 kg live body weight). Carcass traits collected included hot carcass weight (HCW), and loin muscle pH and temperature at 45 min and 24 hour
Table 4.Overlapping eQTL and pQTL regions.
SSC cMa eQTL (gene symbols) pQTL p-valueb
1 8–26 DYNLT1 Loin muscle area 0.006
2 84–100 RFXANK Meat off -flavor 0.004
6 106–124 ETV2 % Moisture 0.005
6 137–147 AKR7A2 Marbling, % Fat ,0.0001
6 180–199 TXNDC12 % Protein, Loin muscle area, Loin chop weight 0.006
6 216–226 TMEM69 Ultimate meat temperature ,0.0001
7 85–101 MRPL14 Carcass length, Loin muscle area 0.003
8 83–111 LIMCH1 b*, % Moisture 0.006
8 153–168 METAP1 L* 0.003
12 46–74 PNPO, COIL % Fat, % Moisture 0.004
15 45–64 WRN Loin muscle area, Tenderness 0.009
15 55–74 OCA2 L*, a*, Meat color 0.002
15 72–85 CDK2 % Protein 0.007
aTotal length of the overlapped region in cM. bLargest overlap p-value between pQTL and eQTL traits. doi:10.1371/journal.pone.0016766.t004
Expression QTL in Pig Muscle Tissue
postmortem. Dressing percentage was calculated by dividing HCW by live slaughter weight. After overnight chilling, midline first-rib backfat, last-rib backfat, last-lumbar backfat, number of ribs, and carcass length measurements were recorded [16]. Weights of primal cuts of ham, closely trimmed loin, picnic shoulder, Boston shoulder, belly and spareribs were also recorded [16]. A section of loin from the 10thrib to the last rib of the left side of the carcass was further evaluated for meat quality traits at MSU. Traits included scores for subjective color, marbling and firmness, objective color scores of CIE L* (lightness), a* (redness) and b* (yellowness) using a Minolta CR-310 colorimeter, drip loss, cook yield, and Warner Bratzler shear force [16]. Samples were also evaluated for proximate composition (moisture, fat and protein) and a trained sensory panel evaluated samples for juiciness, muscle fiber and overall tenderness, connective tissue, and off-flavor [16].
Gene expression
We utilized a recently developed pig whole-genome 70-mer oligonucleotide microarray for this study. The swine protein-annotated oligonucleotide microarray, or Pigoligoarray, was evaluated by our group for use in pig gene expression studies and we reported on the utility of this microarray, as well as information regarding hybridization and analysis methods [18]. The Pigoligoarray includes 20,400 oligonucleotides. Probes were designed from contigs by comparison of pig expressed sequence tags (ESTs) to phyogenetically defined vertebrate proteins and were annotated using descriptions of homologous proteins (http:// www.pigoligoarray.org). The microarray includes 60 negative control probes and six mismatch hybridization stringency control probes designed against each of 60 contigs with the highest EST count in the database. Further annotation of Pigoligoarray probes to include HUGO Gene Nomenclature Committee (HGNC) identities was reported by our group [18].
Longissimus dorsi(loin) muscle tissue was sampled from 176 F2
pigs slaughtered in the MSU Meat Laboratory. The 176 F2pigs
were selected from 44 litters (4 per litter). Within each litter, pigs were selected for transcriptional profiling using a selective phenotyping strategy which consisted of choosing the two extreme males and females within each litter for a trait of interest. For 24 litters loin muscle area was the selection criteria while for the other 20 litters, the extreme pigs were selected based on backfat depth. This selective profiling strategy has been previously described by our group [7]. Tissue samples were flash frozen in liquid nitrogen and stored at – 80uC. Total RNA from 1.0 g of each tissue sample was extracted using TRIzol reagent (Invitrogen Corp.) according to the manufacturer’s instructions. RNA concentration and quality were determined with an RNA 6000 Pico LabChipHkit using an Agilent 2100 Bioanalyzer (Agilent Technologies, Inc.). Samples were paired for microarray hybridizations within sex and within litter such that extreme phenotype males and extreme phenotype females within a litter were paired on microarrays. In addition, dyes were balanced so that, within a litter, samples of high phenotype males and low phenotype females had the same dye, and each dye was used equally for each phenotype group across the experiment.
Sample preparation, microarray hybridization and processing were as previously described by our group [18]. Briefly, for each sample, 1mg of total RNA was reverse transcribed with a T7
oligo(dT) primer using the Amino Allyl MessageAmpTMII aRNA Amplification Kit (Ambion Inc.) according to the manufacturer’s instructions. After aRNA purification, 10mg of aRNAs were
labeled with N-hydroxysuccinate ester Cy3 or Cy5 dyes (GE Healthcare). The labeled aRNAs (2.5mg) were purified, combined
with Slide Hyb#1 solution (Ambion Inc.) and denatured at 70uC. Hybridizations were performed in sealed cassettes (ArrayIt, TeleChem International, Inc.) for 18 h at a humid 54uC. Following hybridization, slides were washed and rinsed as we have reported previously. Fluorescent images were detected by an Axon GenePixH 4000B scanner (Molecular Devices), and fluorescence intensity data were collected using GenePixH Pro 6 software (Molecular Devices) after spot alignment. The gene expression data were deposited in the NCBI Gene Expression Omnibus database (http://www.ncbi.nlm.nih.gov/geo/) [acces-sion number GSE23351]. Median intensities were extracted and normalized using a within-print-tip lowess location normalization and an overall scale normalization [39] with no background correction. This normalization removed intensity dependent biases from each printing block in each slide. The resulting normalized data were expressed in the log2scale.
Statistical analysis
The following linear mixed model was fit to normalized log-intensity data on an oligonucleotide-by-oligonucleotide basis:
Y~mzDyezArrayzSexzLitterzgrowth groupzcaaze
whereY is the normalized log-intensity,Dye,Sexandgrowth_group
are fixed effects accounting for systematic variation, andArrayand
Litter are random effects. Growth group had four categories corresponding to the extremes for selection criteria: 1) High loin muscle area, 2) low loin muscle area, 3) high back fat and 4) low back fat. The additive eQTL coefficientcawas derived assuming
that the parental breeds were fixed for alternative eQTL alleles [21]. A t-test for the additive eQTL effectawas performed at each of the 1,279 putative eQTL positions (at every marker and 11 inter-marker positions) for each expression trait and the p-values were corrected for multiple testing (q-value) across all traits and positions. A preliminary analysis considered P,0.0001 (FDR,56%) as significance threshold. Candidate eQTL analysis on individual genes used P,0.0000035 (FDR,10%).
Physical localization of oligonucleotides relative to localization of eQTL
All oligonucleotides were aligned against the pig genome (Build 9; www.ensembl.org) using the BLAT [40] sequence alignment tool. Up to 3 mismatches were allowed and multiple alignments of the same oligonucleotide sequence were discarded as they indicated ambiguous positions due to problems with the genome assembly or with the oligonucleotide design. By comparing the position of each significant linkage peak to the physical position of the corresponding oligonucleotide, local and distant eQTL were declared. We declared local eQTL as those where the linkage peak and the oligonucleotide in question were on the same chromosome and distant eQTL as those where the eQTL and the oligonucle-otide were on different chromosomes. All distant eQTL are trans-acting, whereas only a proportion of the local eQTL are cis-acting. While the local eQTL are putatively cis-acting, it is not possible to make definitive determinations from the current map resolution with the available genomic sequence and marker density.
Gene networks subject to genetic control
Analysis software (Ingenuity Systems, Redwood City, CA, USA) to test for enrichment of functional categories.
Co-localization of eQTL and pQTL
A set of 67 phenotypic traits has been previously analyzed for QTL (pQTL) in this cross [16,17]. For the current study, we repeated the pQTL analysis to account for a different mapping function and to compute multiple test p-value corrections (FDR). Standard QTL analysis approaches were applied as we have previously reported [16,17]. Given a particular eQTL region, delimited by a 5 cM interval to each side of the peak, all overlapping pQTL regions were selected [4]. The probability of two intervals of this length (10 cM) overlapping in a 3,000 cM long genome (the length of our linkage map) is P~ 1{ 1{
10
3000
2
~0
:0067. We computed a p-value for observing
(by chance) an overlap as long as the one observed in each eQTL/ pQTL region (distance between center of intervals smaller or equal to the observed one) using this expression: p{value~ 1{ 1{ dist
3000
2
, where dist is the distance between two eQTL. Note that this formula does not depend on the length of the
interval. The formulas were derived assuming uniform distribution of the center of the interval and verified using Monte-Carlo simulation.
Supporting Information
Table S1 Position of oligonucleotides in the pig genome.
Position is relative to the beginning of the chromosome (SSC). Pig Genome information corresponds to Build 9; accessible at: www. ensembl.org.
(XLS)
Acknowledgments
Support from the US Swine Genome Coordinator for synthesis of oligonucleotides for the Pigoligoarray, and from the US National Animal Genome Research Program Bioinformatics Coordinator for server access is greatly appreciated.
Author Contributions
Conceived and designed the experiments: CWE JPS ROB GJMR RJT FFC. Performed the experiments: VDR NER AMR DBE. Analyzed the data: JPS CWE AR. Wrote the paper: JPS CWE.
References
1. Jansen RC, Nap JP (2001) Genetical genomics: the added value from segregation. Trends Genet 17: 388–391.
2. Schadt EE, Monks SA, Drake TA, Lusis AJ, Che N, et al. (2003) Genetics of gene expression surveyed in maize, mouse and man. Nature 422: 297–302. 3. de Koning DJ, Haley CS (2005) Genetical genomics in humans and model
organisms. Trends Genet 21: 377–381.
4. West MAL, Kim K, Kliebenstein DJ, van Leeuwen H, Michelmore RW, et al. (2007) Global eQTL mapping reveals the complex genetic architecture of transcript-level variation in Arabidopsis. Genetics 175: 1441–1450.
5. Bueno Filho JS, Gilmour SG, Rosa GJ (2006) Design of microarray experiments for genetical genomics studies. Genetics 174: 945–957.
6. de Koning DJ, Cabrera CP, Haley CS (2007) Genetical genomics: combining gene expression with marker genotypes in poultry. Poult Sci 86: 1501–1509. 7. Cardoso FF, Rosa GJM, Steibel JP, Ernst CW, Bates RO, et al. (2008) Selective
Transcriptional Profiling and Data Analysis Strategies for Expression Quanti-tative Trait Loci Mapping in Outbred F-2 Populations. Genetics 180: 1679–1690.
8. Haley C, de Koning DJ (2006) Genetical genomics in livestock: potentials and pitfalls. Anim Genet 37(Suppl 1): 10–12.
9. Ponsuksili S, Jonas E, Murani E, Phatsara C, Srikanchai T, et al. (2008) Trait correlated expression combined with expression QTL analysis reveals biological pathways and candidate genes affecting water holding capacity of muscle. BMC Genomics 9: 367.
10. Cogburn LA, Wang X, Carre W, Rejto L, Porter TE, et al. (2003) Systems-wide chicken DNA microarrays, gene expression profiling, and discovery of functional genes. Poultry Sci 82: 939–951.
11. Ponsuksili S, Murani E, Schwerin M, Schellander K, Wimmers K (2010) Identification of expression QTL (eQTL) of genes expressed in porcine M. longissimus dorsi and associated with meat quality traits. BMC Genomics 11: 572.
12. Kadarmideen HN, von Rohr P, Janss LL (2006) From genetical genomics to systems genetics: potential applications in quantitative genomics and animal breeding. Mamm Genome 17: 548–564.
13. Hu ZL, Dracheva S, Jang WH, Maglott D, Bastiaansen J, et al. (2005) A QTL resource and comparison tool for pigs: PigQTLDB. Mamm Genome 16: 792–800.
14. Rothschild MF, Hu ZL, Jiang Z (2007) Advances in QTL mapping in pigs. Int J Biol Sci 3: 192–197.
15. Ponsuksili S, Murani E, Phatsara C, Schwerin M, Schellander K, et al. (2010) Expression quantitative trait loci analysis of genes in porcine muscle by quantitative real-time RT-PCR compared to microarray data. Heredity advance online publication.
16. Edwards DB, Ernst CW, Raney NE, Doumit ME, Hoge MD, et al. (2008) Quantitative trait locus mapping in an F2 Duroc x Pietrain resource population: II. Carcass and meat quality traits. J Anim Sci 86: 254–266.
17. Edwards DB, Ernst CW, Tempelman RJ, Rosa GJM, Raney NE, et al. (2008) Quantitative trait loci mapping in an F2 Duroc x Pietrain resource population: I. Growth traits. J Anim Sci 86: 241–253.
18. Steibel JP, Wysocki M, Lunney JK, Ramos AM, Hu ZL, et al. (2009) Assessment of the swine protein-annotated oligonucleotide microarray. Animal Genetics 40: 883–893.
19. Breitling R, Li Y, Tesson BM, Fu J, Wu C, et al. (2008) Genetical genomics: spotlight on QTL hotspots. PLoS Genet 4: e1000232.
20. Seaton G, Haley CS, Knott SA, Kearsey M, Visscher PM (2002) QTL Express: mapping quantitative trait loci in simple and complex pedigrees. Bioinformatics 18: 339–340.
21. Haley CS, Knott SA, Elsen JM (1994) Mapping Quantitative Trait Loci in Crosses between Outbred Lines Using Least-Squares. Genetics 136: 1195–1207. 22. Rosa GJ, Steibel JP, Tempelman RJ (2005) Reassessing Design and Analysis of two-Colour Microarray Experiments Using Mixed Effects Models. Comp Funct Genomics 6: 123–131.
23. O’Connor T, Ireland LS, Harrison DJ, Hayes JD (1999) Major differences exist in the function and tissue-specific expression of human aflatoxin B1 aldehyde reductase and the principal human aldo-keto reductase AKR1 family members. Biochem J 343(Pt 2): 487–504.
24. Picklo MJ, Sr, Olson SJ, Hayes JD, Markesbery WR, Montine TJ (2001) Elevation of AKR7A2 (succinic semialdehyde reductase) in neurodegenerative disease. Brain Res 916: 229–238.
25. Liu F, Rong YP, Zeng LC, Zhang X, Han ZG (2003) Isolation and characterization of a novel human thioredoxin-like gene hTLP19 encoding a secretory protein. Gene 315: 71–78.
26. Alanen HI, Williamson RA, Howard MJ, Lappi AK, Jantti HP, et al. (2003) Functional characterization of ERp18, a new endoplasmic reticulum-located thioredoxin superfamily member. J Biol Chem 278: 28912–28920.
27. Lucca-Junior W, Janovick JA, Conn PM (2009) Participation of the endoplasmic reticulum protein chaperone thio-oxidoreductase in gonadotropin-releasing hormone receptor expression at the plasma membrane. Braz J Med Biol Res 42: 164–167.
28. Rowe ML, Ruddock LW, Kelly G, Schmidt JM, Williamson RA, et al. (2009) Solution structure and dynamics of ERp18, a small endoplasmic reticulum resident oxidoreductase. Biochemistry 48: 4596–4606.
29. Pfister KK, Shah PR, Hummerich H, Russ A, Cotton J, et al. (2006) Genetic analysis of the cytoplasmic dynein subunit families. PLoS Genet 2: e1. 30. Gerrard DE, Grant AL (2003) Tissue structure and organization. Principles of
animal growth and development. Dubuque: Kendall/Hunt Publishing Compa-ny. pp 26–27.
31. Watanabe TK, Fujiwara T, Shimizu F, Okuno S, Suzuki M, et al. (1996) Cloning, expression, and mapping of TCTEL1, a putative human homologue of murine Tcte1, to 6q. Cytogenet Cell Genet 73: 153–156.
32. Chuang JZ, Yeh TY, Bollati F, Conde C, Canavosio F, et al. (2005) The dynein light chain Tctex-1 has a dynein-independent role in actin remodeling during neurite outgrowth. Dev Cell 9: 75–86.
33. Lai M, Wang F, Rohan JG, Maeno-Hikichi Y, Chen Y, et al. (2005) A tctex1-Ca2+channel complex for selective surface expression of Ca2+channels in neurons. Nat Neurosci 8: 435–442.
34. Rossi ML, Ghosh AK, Bohr VA Roles of Werner syndrome protein in protection of genome integrity. DNA Repair (Amst) 9: 331–344.
35. Satyanarayana A, Kaldis P (2009) A dual role of Cdk2 in DNA damage response. Cell Div 4: 9.
36. Kitzmann M, Fernandez A (2001) Crosstalk between cell cycle regulators and the myogenic factor MyoD in skeletal myoblasts. Cell Mol Life Sci 58: 571–579.
Expression QTL in Pig Muscle Tissue
37. Sturm RA (2009) Molecular genetics of human pigmentation diversity. Hum Mol Genet 18: R9–R17.
38. National Research Council (U.S.). Subcommittee on Swine Nutrition. (1998) Nutrient requirements of swine. Washington D.C.: National Academy Press. xvii, 189 p.
39. Yang YH, Dudoit S, Luu P, Lin DM, Peng V, et al. (2002) Normalization for cDNA microarray data: a robust composite method addressing single and multiple slide systematic variation. Nucl Acids Res 30.