ISSN 1546-9239
© 2011 Science Publications
Corresponding Author: Arifin Abdu, Department of Forest Production, Faculty of Forestry, University Putra Malaysia, 43400 UPM Serdang, Selangor, Malaysia Tel: +60389467177 Fax: +60389432514
Effects of Land Use Practices on the Organic Carbon Content, Cation Exchange
Capacity and Aggregate Stability of Soils in the Catchment Zones
1,4
Mosayeb Heshmati,
1,2Arifin Abdu,
3Shamshuddin Jusop
and
1Nik Muhammad Majid
1
Department of Forest Production, Faculty of Forestry,
2
Department of Land Management, Faculty of Agriculture,
3
Institute of Tropical Forestry and Forest Products,
University Putra Malaysia, 43400 UPM Serdang, Selangor, Malaysia
4
Department of Watershed Management,
Agriculture and Natural Research Center, Kermanshah, Iran
Abstract: Problem statement: Land use practice leads to changes in the physico-chemical properties of soils, such as Soil Organic Carbon (SOC), Cation Exchange Capacity (CEC) and Soil Aggregate Stability (SAS) that cause soil erosion. Approach: Merek catchment, Iran suffers from land degradation due to poor land use practice. A study was carried out with the objectives: (i) to determine soil nutrient status in different agro-ecological zones in Merek catchment; and (ii) to evaluate the influence of land use practices on SOC, CEC and SAS. Results: It was found that soil texture was silty and clay, while soil reaction was alkaline (pH was 7.75). The respective amount of carbonates was 32 and 36% in the top-soil and sub-soil respectively, indicating high level of alkalinity in the soils of the study area. Themean SAS of the surface soil layer for agriculture, rangeland and forest was 53, 61 and 64%, respectively with its mean in the topsoil of agriculture is significantly lower (P≤0.05) than the other zones. SOC level in the agriculture, rangeland and forest were 1.35, 1.56, 2.14 % in the topsoil and 1.03, 1.33 and 1.45%, in the subsoil of the respective areas. The results of t-test and ANOVA analyses showed that SOC means are significantly different from each other within soil depth and among agro-ecological zones. The CEC in the agriculture, rangeland and forest areas were 25.8, 24.6 and 35.1 cmolckg−1 for the top-soil and 31.1, 26.8 and 26.9 cmolckg−1 in the sub-soil, respectively. All the above changes are due to the negative effects of agricultural activities. Conclusion: Improper tillage practice (up-down the slope), conversion of the rangeland and forest to rain-fed areas, crop residue burning, over grazing and forest clearance contribute to reduction in SOC and SAS in the Merek catchment, Iran.
Key words: Aggregate stability, improper tillage, forest clearance, soil carbonate, Soil Organic Carbon (SOC), Soil Aggregate Stability (SAS), Cation Exchange Capacity (CEC), Agro-Ecological Zone (AEZ), Global Positioning System (GPS), improper agricultural
INTRODUCTION
Land use practices and land use shifting lead to soil erosion, leading to negative changes in the soil physico-chemical properties, especially Soil Aggregate Stability (SAS), Soil Organic Carbon (SOC) and Cation Exchange Capacity (CEC). By and large, land use change is more frequent in the highlands due to population pressure, government policy, market demand, climate change and urbanization (Valentin et al., 2008). These processes occur in most parts of Zagros Mountains in Iran. For example, agricultural lands in several villages have been converted to urban
areas or industrial sites resulting in reduction of agriculture areas and drastic changes in land use causing severe land degradation in the upper catchments (Hashim and Abdullah, 2005).
are more severe in the semi-arid area of Iran; most of the nutrient depletion occurs due to improper tillage practice and crop residue burning. According to the report by Rosa et al. (2000), high erosion intensity in these areas (up to 50 Mg ha−1yr−1) causes 48% reduction in crop productivity due to decline in SOC, soil nutrients and fine soil particles.
SOC, as the primary source of plant nutrients, plays a major role in nutrient cycling and is positively correlated with soil nutrients, water holding capacity, infiltration capacity, aggregate formation and soil health (Lal et al., 1998; He et al., 2007; Ruffino and Zanetti, 2009). Declines in SOC result in both the on-site and off-site impacts of land degradation because of its multi-functions. Aggregate stability in the surface soil of a sloping land is an important predictor of run-off, sediment and carbon loss through water erosion. It mainly depends on SOC which is influenced by land use practices.
The study of An et al. (2010) on a re-vegetated soil in the Loess Plateau, China showed that an increase in SOC resulted in high C:N ratio and subsequently rapid turnover of soil organic matter in the top-soil and also increase in soil aggregate stability. Reduction in both SAS and SOC results in soil erosion hazards. The soils with the highest erodibility are those with weak aggregate stability which can be easily detached and transported by raindrop forces and overland flow (Hazelton and Murphy, 2007). Low SAS causes soil sealing, crusting and increases run-off coefficient and consequently increases erosion hazard. The contribution of coarse soil aggregate (>0.05 mm) in adsorption of SOC is more than micro aggregates (<0.05 mm), while it is damaged by improper agriculture activities (such as heavy tillage practices, burning of crop residue), grazing and forest clearance. Furthermore, the coarse soil aggregate is reduced mainly by long-term conventional tillage practices. The study of Li and Pang (2010) on a silty clay loam soil in China revealed that long-term (33 years) practices of this tillage resulted in reduction of 22% in coarse aggregates and increase of 34% in fine aggregates. This study also showed that converting cropland to the forest and orchard enhanced coarse aggregates by 10% which subsequently enhanced SOC and N in the soils.
Reduction of SOC and consequently increasing the soil erodibility is also related to crop residue burning. This phenomenon increased during recent years in agricultural lands of semi-arid regions, especially in Iran mainly due to continued cultivation without fallow period. It reduces SOC in the topsoil and increase the loss of P and K because of increased run-off (Bertol et al., 2007). Some farmers even attempt to burn the animal manure which can enhance soil
physico-chemical properties. The study of Masto etal. (2006) in India showed that application of animal manure improved significantly soil bulk density, water retention, SOc, crop yield and consequently farmers’ income.
It was estimated that only crop residue burning had resulted in 259 and 10 Gg of SOC and NOx emission in Iran (Environment organization of Iran, 2003). Incorporation of crop residues into the soil is the best way to increase the stable soil organic matter for improving crop yield and mitigation of CO2 emission. In general, it has been estimated that an annual return of 5 ton ha−1 of crop residues could keep soils in equilibrium with present levels of soil organic matter in the semi-arid region of Spain (Rosa
et al., 2009). The investigation of Gomez et al. (2009) on the olive groves of Spain showed that cover crop was a simple and feasible measure. Conservation on sloping lands when most of the soil is unprotected by the small plant canopy resulted in higher increase of SOC and infiltration rate compared to conventional tillage practice that induced soil degradation. This study was carried out with the objectives: (i) to determine soil nutrient status in different agro-ecological zones in Merek catchment and (ii) to evaluate the influence of land use practices on SOC, CEC and SAS.
MATERIALS AND METHODS
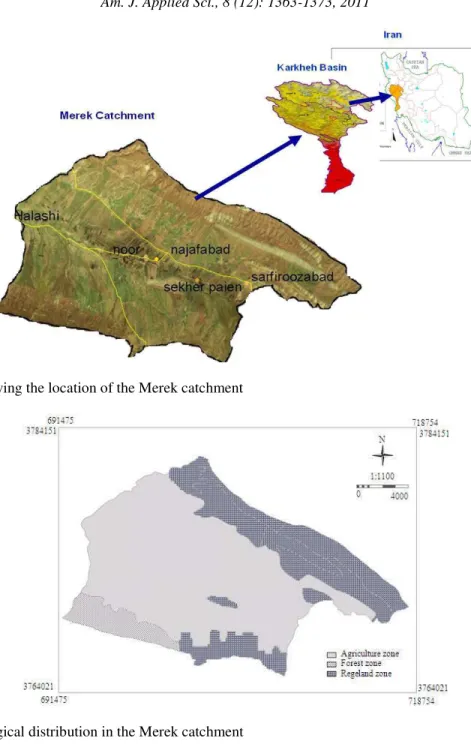
Description of the study area: This study was conducted at the Merek catchment, located about 35 km southeast of Kermanshah, Iran. It is at the upper catchment in the Zagros Mountain chains (west of Iran) (Fig. 1). Merek catchment has an area of 23,000 ha that lie between 34º 00' 38” to 34º 09'31” N and 47º 04’ 25” to 47º 22' 18” E. The mean annual precipitation and temperature are 481 mm and 17.7°C, respectively indicating a semi-arid region. Total area of the agriculture, rangeland and forest are 14810, 6632 and11596 ha, respectively. Winter wheat, barley, chickpea, sugar beet and maize are the crops grown, whereas sheep rearing is the main livestock. This catchment also suffers from significant land degradation problem due to improper tillage practices, crop residue burning, over grazing, early grazing and forest clearance.
Fig. 1: A map showing the location of the Merek catchment
Fig. 2: Agro-ecological distribution in the Merek catchment
The agro-ecological zonation of the study area was mapped for agriculture, rangeland and forest based on main characteristics of land use and geomorphological properties, using satellite image (Land-sat ETM+) and topography map. Satellite image was geo-referenced and geo-rectified to UTM coordinates (UTM zone 38-northern hemisphere; WGS 84) using ground control points collection (Fig. 2).
Geomorphological facies map: The geomorphological facies is a homogenous area in the catchment with
Table 1: Geomorphological facies within the agro-ecological zones in the Merek catchment
Geology Topographic Area
Facies --- --- Erosion --- Code Era (%) Period Formation Slope (%) Aspect Altitude (m) Feature Land use Ha (%) A1 Ce Qt Qtc 5-10 P 1420-1600 Rill erosion Rainfed cereal 175.54 0.76 A2 Me Cr Gu 10-20 S 1600-1800 Rill-landslide Rainfed cereal 1054.22 4.58 A3 Ce Qt Ot1 5-10 P 1600-1800 Rill erosion Rainfed cereal 531.70 2.34 A4 Me Cr Gu 5-10 P 1420-1600 Gully Cereal 884.75 3.84 A5 Ce Qt Otc 0-5 P 1420-1600 Rill erosion Cereal 1497.14 6.50 A6 Ce Qt Otc 0-5 P 1420-1600 Gully Mainly irrigated cops 2196.36 10.40 A7 Ce Qt Ot1 0-5 P 1420-1600 Inter-rill-Gully Irrigate cereal 1587.18 6.90 A8 Ce Qt Otf 5-10 N 1420-1600 Gully Rainfed cereal 491.22 2.13 A9 Ce Qt Ot1 5-10 N 1420-1600 Gully Rainfed cereal 925.13 4.02 A10 Ce Qt Ot1 5-10 N 1420-1600 Gully Rainfed cereal 491.32 2.13 A11 Ce Ter Ka 10-20 N 1600-1800 Gully Rainfed cereal 406.77 1.76 A12 Ce Qt Ot1 5-10 N 1600-1800 Gully Rainfed cereal 662.13 2.87 A13 Ce Qt Qtf 10-20 S 1600-1800 Inter-rill-Gully Mainly irrigated crops 267.64 1.16 A14 Ce Qt Qtf 0-5 P 1420-1600 Inter-rill-Rill Rainfed cereal 437.88 1.90 A15 Me Cr Gu 10-20 S 1420-1600 Gully Rainfed cereal 556.54 2.41 A16 Ce Qt Ot 0-5 P 1600-1800 Inter-rill-gully Rainfed cereal 496.72 2.16 A17 Ce Qt Otc 5-10 N 1600-1800 Gully Rainfed cereal 547.16 2.37 A18 Ce Qt Ot 0-5 P 1600-1800 Gully Irrigated + rainfed 601.56 2.61 A19 Me Cr Gu 10-20 N 1600-1800 Inter-rill-gully Irrigated crops 208.75 0.90 A20 Me Cr Il 10-20 S 1600-1800 Inter-rill-rill Rainfed cereal 251.25 1.09 A21 Ce Qt Ot1 10-20 S 1600-1800 Inter-rill-rill Rainfed cereal 242.80 1.05 A22 Ce Qt Ot1 5-10 S 1800-2000 Sheet Rainfed cereal 296.24 1.28 R1 Me Cr Il 20-40 S 1800-2000 Snowing grazing 156.14 0.68 R2 Me Cr Sa >40 S 1800-2000 Snowing grazing 136.60 0.60 R3 Me Cr Il 10-20 S 1600-1800 Rill-Inter-rill grazing 341.53 1.48 R4 Me Cr Sa >40 S 1800-2000 Snowing grazing 361.08 1.57 R5 Me Cr Gu 10-20 S 1500-1600 Rill-sheet Grazing 340.55 1.47 R6 Me Cr Il 20-40 S 1800-2000 Snow Grazing 118.10 0.52 R7 Me Cr Sa >40 S 2400-2600 Snow Wild live 634.33 2.75 R8 Me Cr Il 20-40 S 1800-2000 Sheet-Inter-rill grazing 361.08 1.57 R9 Me Cr Il 20-40 S 2000-2200 Sheet-rill grazing 448.91 1.95 R10 Me Cr Sa >40 S >2400 Snow Wild live 224.46 0.97 R11 Me Cr Il >40 S 2000-2200 Sheet-Inter- rill grazing 253.73 1.11 R12 Me Cr Gu >40 W 2200-2400 Snow Wild live 292.75 1.26 R13 Me Cr Il 10-20 S 1800-200 Sheet-Inter-rill grazing 283.00 1.23 R14 Me Cr Il 20-40 N 1800-2000 Sheet-Inter-rill grazing 234.20 1.02 R15 Me Cr Il 20-40 S 1800-2000 Sheet-Inter-rill grazing 239.09 1.03 R16 Me Cr Sa 10-20 W 1600-1800 Sheet-Inter-rill grazing 331.75 1.44 R17 Me Cr Gu >40 S 2000-2200 Sheet-Inter- rill grazing 249.83 1.10 R18 Ce Ter Sh 20-40 N 1800-2000 Gully grazing 439.15 1.91 R19 Ce Ter Ka 20-40 N 1600-1800 Piping-Landslide grazing 243.97 1.11 R20 Ce Ter Ka 10-20 N 1600-1800 landslide grazing 536.74 1.03 R21 Ce Qt Ot1 20-40 S 1800-2000 Piping-Landslide grazing 239.07 1.04 R22 Me Cr Gu 10-20 S 1600-1800 Piping-Landslide grazing 166.00 0.72 F1 Ce Ter Ka 10-20 N 1500-1600 Gully erosion Illegal grazing 170.00 0.74 F2 Ce Ter Ka 10-20 N 1600-1800 Piping-Landslide Illegal grazing 556.02 2.41 F3 Ce Ter Sh 20-40 N 1700-1900 Piping-Landslide Illegal grazing 870.05 3.77
Total 23038.13 100.00
Note: Ai = Agriculture zone, Ri = Rangeland zone, Fi = Forest zone, Ce = Cenozoic, Me = Mesozoic, Cr = Cretaceous Qtc = Quaternary (cultivate area), Ot1 = Quaternary (older terraces), Ter = Tertiary Qtf = Quaternary (gravel fan), Sa = Sarvak, Gu = Gurpi, Il = Ilam P = Plain, S = South, N = North, W = West, E = East, P = Plain
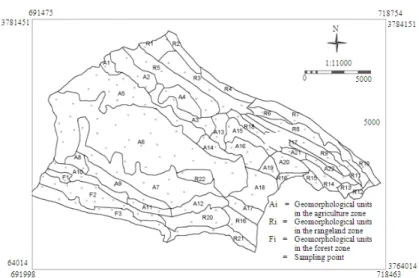
Soil sampling and analyses: For this study, 268 soil samples were collected from depths of 0-20 and 20-40 cm within each geomorphological facies followed by stratified random soil sampling and their coordinates were determined by Global Positioning System (GPS). Soil sampling areas are indicated in Fig. 3. The air-dried soil samples were sieved through 2 mm mesh sieve and soil physico-chemical characteristics were determined in the laboratory.
Fig. 3: Distribution of geomorphological facies in the Merek catchment
Statistical analyses: The data were statistically analyzed using SAS version 6.12 for variance (ANOVA) of each soil variable [(General Linear Models (GLM) procedure and Student Newman Keuls (SNK) test due to unequaled samples size], t-test within soil depth and inter-correlation. Spatial distribution of SOC and CEC were mapped using interpolation (Kriging) techniques (GS+ version 5.1) and MapInfo software (version 7.0).
RESULTS AND DISCUSSION
Land use in the study area: There are three agro-ecological zones in the Merek catchment, namely agriculture, rangeland and forest. As shown in Table 2 and Fig. 2, about 64% of the study area is occupied by agriculture, while the rest are rangeland and forest, which are more sensitive to soil erosion because of topography and geological properties. The main crops grown in the Merek catchment are wheat, chickpea, barley, maize, and sugar beet. Agricultural activities are characterized by continued annual crop cultivation, crop residue burning, overutilization of chemical fertilizes and up to down the slope tillage practice. Field verifications showed that the improper tillage practices (up to down the slope) was found mainly in the rain-fed areas, while most of the irrigated lands were subjected to over application of chemical fertilizers. Forest and rangelands comprise about 90 natural plant species of trees, shrubs, forbs and grasses.
Quesrcus persica cover 91% of the forest area. However, palatable species such as
Festuca ovina, Bromus sp, Prangus ferulacea
and Ttrifolium sp are damaged from overgrazing.
Table 2: Agro-ecological zones areas of Merek catchment Areas
--- Agro-ecological zone ha (%) Agriculture 14810.00 63.64
Forest 1596.07 6.31
Rangelands 6632.06 30.05
Total 23038.13 100.00
Table 3: The livestock of Merek catchment
Sheep and Goat Donkey
lamb* and kid Cattle* and mule Total 31400 8550 4571 305 44826
Note: * About 5% of lamb and calf are fattened (Source: Agriculture organization of Kermanshah province, Iran, 2007)
The study of showed that in some parts of this forest the average forest tree canopy and density were about 15% and 247 tree ha-1 respectively, due to illegal logging and cultivation practices mainly wheat, barley and chickpea resulting in forest fragmentation. Fragmented forests cause rapid change in land use leading to larger perimeter/forest path ratio (Newton, 2007). Bare soil in these areas was more than 40% of the study area resulting in surface erosion and subsequently loss of SOC and reduction of SAS through soil erosion and cultivation practices.
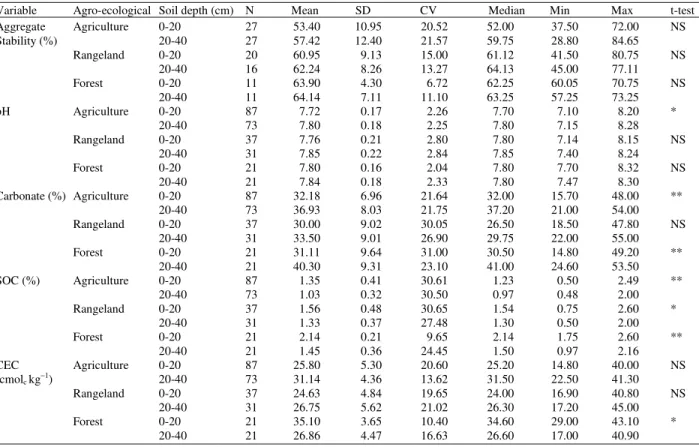
Table 4: Mean, Standard Deviation (SD), Coefficient of Variation (CV), median, minimum, maximum and t-test values of the soil variables in the Merek catchment
Variable Agro-ecological Soil depth (cm) N Mean SD CV Median Min Max t-test Aggregate Agriculture 0-20 27 53.40 10.95 20.52 52.00 37.50 72.00 NS Stability (%) 20-40 27 57.42 12.40 21.57 59.75 28.80 84.65
Rangeland 0-20 20 60.95 9.13 15.00 61.12 41.50 80.75 NS 20-40 16 62.24 8.26 13.27 64.13 45.00 77.11 Forest 0-20 11 63.90 4.30 6.72 62.25 60.05 70.75 NS
20-40 11 64.14 7.11 11.10 63.25 57.25 73.25 pH Agriculture 0-20 87 7.72 0.17 2.26 7.70 7.10 8.20 *
20-40 73 7.80 0.18 2.25 7.80 7.15 8.28 Rangeland 0-20 37 7.76 0.21 2.80 7.80 7.14 8.15 NS
20-40 31 7.85 0.22 2.84 7.85 7.40 8.24 Forest 0-20 21 7.80 0.16 2.04 7.80 7.70 8.32 NS
20-40 21 7.84 0.18 2.33 7.80 7.47 8.30 Carbonate (%) Agriculture 0-20 87 32.18 6.96 21.64 32.00 15.70 48.00 **
20-40 73 36.93 8.03 21.75 37.20 21.00 54.00 Rangeland 0-20 37 30.00 9.02 30.05 26.50 18.50 47.80 NS
20-40 31 33.50 9.01 26.90 29.75 22.00 55.00 Forest 0-20 21 31.11 9.64 31.00 30.50 14.80 49.20 **
20-40 21 40.30 9.31 23.10 41.00 24.60 53.50 SOC (%) Agriculture 0-20 87 1.35 0.41 30.61 1.23 0.50 2.49 **
20-40 73 1.03 0.32 30.50 0.97 0.48 2.00 Rangeland 0-20 37 1.56 0.48 30.65 1.54 0.75 2.60 *
20-40 31 1.33 0.37 27.48 1.30 0.50 2.00 Forest 0-20 21 2.14 0.21 9.65 2.14 1.75 2.60 **
20-40 21 1.45 0.36 24.45 1.50 0.97 2.16 CEC Agriculture 0-20 87 25.80 5.30 20.60 25.20 14.80 40.00 NS (cmolc kg−1) 20-40 73 31.14 4.36 13.62 31.50 22.50 41.30
Rangeland 0-20 37 24.63 4.84 19.65 24.00 16.90 40.80 NS 20-40 31 26.75 5.62 21.02 26.30 17.20 45.00 Forest 0-20 21 35.10 3.65 10.40 34.60 29.00 43.10 *
20-40 21 26.86 4.47 16.63 26.60 17.00 40.90
Note: *: Significant at 0.05% level, **: Significant at 0.01% level and NS: Not Significant
Erosion feature and annual soil erosion: About 37% of the study area is affected by inter-rill (sheet) and rill erosion, which are mainly observed in the rain-fed agriculture and rangeland areas (10-20% slope). Snow erosion with debris was found in the north-and northeast parts of the study area which are under high elevation, cliffs, outcrops and steeped slope. Gully erosion is the dominant erosion feature in agriculture zone with gentle slopes of Quaternary deposits. Most of the landslides occurring in the area are initiated by piping and cracking processes in the forest and some parts of rangelands. The soils in the area are dominated by swelling clays (smectite). Annual erosion intensity in the agriculture area, rangeland and forest was 14.47, 16.60 and 18.57 t ha−1yr−1, respectively (using the MPSIAC model). High erosion intensity was observed in the forest due to landslide occurrence.
Soil properties in the agro-ecological zones:
Soil texture: Soil texture in the study area is dominated mainly by silty and clay. The average amount of sand, silt and clay are 17%, 42% and 41%, respectively (Results not show here). These soil textures are heavy
because of considerable clay ratio which can induce high CEC, water availability and soil crusting as well as erosion hazard due to low infiltration rate. Soil texture in this area is controlled by the geology of the area, which are characterized by claystone, marl, shale and limestone that contain different minerals.
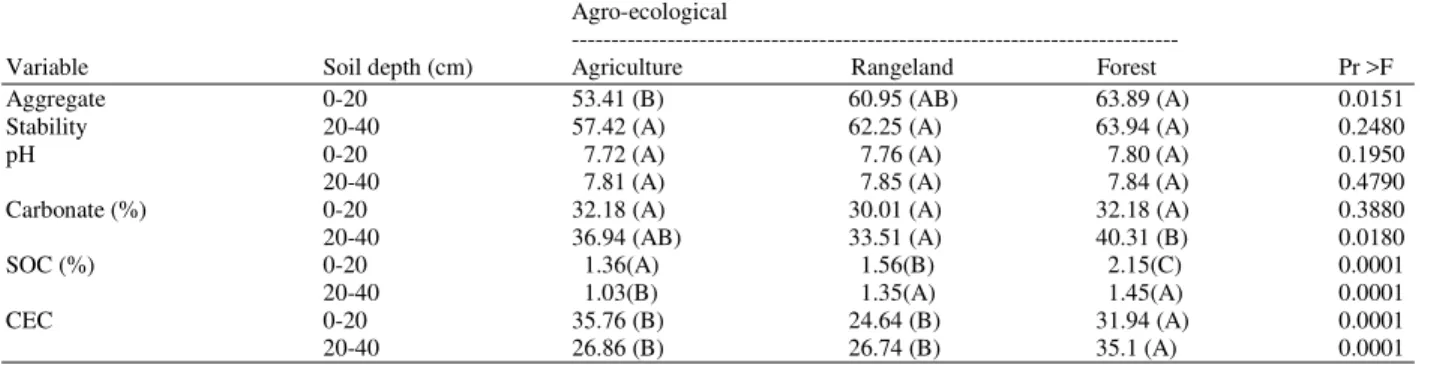
Table 5: ANOVA analysis of soil variables among three agro-ecological zones Agro-ecological
---
Variable Soil depth (cm) Agriculture Rangeland Forest Pr >F Aggregate 0-20 53.41 (B) 60.95 (AB) 63.89 (A) 0.0151 Stability 20-40 57.42 (A) 62.25 (A) 63.94 (A) 0.2480
pH 0-20 7.72 (A) 7.76 (A) 7.80 (A) 0.1950
20-40 7.81 (A) 7.85 (A) 7.84 (A) 0.4790 Carbonate (%) 0-20 32.18 (A) 30.01 (A) 32.18 (A) 0.3880 20-40 36.94 (AB) 33.51 (A) 40.31 (B) 0.0180
SOC (%) 0-20 1.36(A) 1.56(B) 2.15(C) 0.0001
20-40 1.03(B) 1.35(A) 1.45(A) 0.0001
CEC 0-20 35.76 (B) 24.64 (B) 31.94 (A) 0.0001
20-40 26.86 (B) 26.74 (B) 35.1 (A) 0.0001
Note: Means with the same letters in the same row are significantly different at 0.05% level
Table 6: Inter-correlation (Pearson correlation coefficients) for soil variables in the merek catchment
Sand Silt Clay AS SOC Calcite pH CEC
Silt NS
Clay * NS
As * NS NS
SOC NS * * *
Calcite NS NS NS NS NS
pH NS * * NS NS *
CEC NS * * NS * * **
Note: *: Significant at 0.05% level, **: Significant at 0.01% level, NS: Not Significant, AS: Aggregate Stability, SOC: Soil Organic Carbon, CEC: Cation Exchange Capacity
It is seems that significantly lower aggregate stability in the agriculture areas contributes to soil erosion, especially gully and rill formation at the rain-fed lands. Improper tillage practice is occurred in 48% of agricultural areas of which 18% was found to be more critical where slope is 10-20% (including geomorphological facies A1, A2 A3, A5, A14, A15, A20 A21 and A22) (Table 1 and Fig. 3). In these areas inter-rill and inter-rill erosion are induced by tillage practice. In addition, gully erosion at A9, A10, A13, A17 and A18 (about 12% of study area) is also exposed to improper tillage practices, damaging soil aggregate stability, which in turn, increases soil erosion.
High aggregate stability protects soils from erosion, while low soil aggregation indicates a soil with poor soil structures, low permeability and low infiltration that contribute towards pipe formation in the clayey soils. Diaz et al. (2007) found a good inverse relationship between soil aggregate stability and piping density on clayey soils. When stability of aggregate is decreased, soil erodibility can be increased (Blanco and Lal, 2008). Burning of crop residues by illegal farmers can also decrease aggregate stability by decreasing soil organic carbon which in the agriculture zone was significantly lower than that of the other zones (Table 5). Field verification showed that the presently cultivation of legumes such as lintels, alfalfa, clover and caw pea are rare due to increasing continued wheat and barley cultivation without fallow and rotation
systems. The study of Handyayani et al. (2010) showed that growing of forage legumes in the arable lands had resulted in increased total N of 26-50% through N2 fixation.
Soil pH: Soil pH in the study area is high due to high carbonate content. Average pH in the agriculture, rangeland and forest was 7.75, 7.82 and 7.78, respectively. Thesoil reaction in the area is moderately alkaline with pH of 7.4-8.4 (Marx et al., 1999). Results from the t-test (Table 4) showed that the pH within the soil depth in the agriculture zone was significantly different (7.72 and 7.80) between the top- and subsoil, respectively. Table 6 shows that soil pH is significantly (P≤ 0.05) correlated with soil texture (silt and clay) and calcite content.
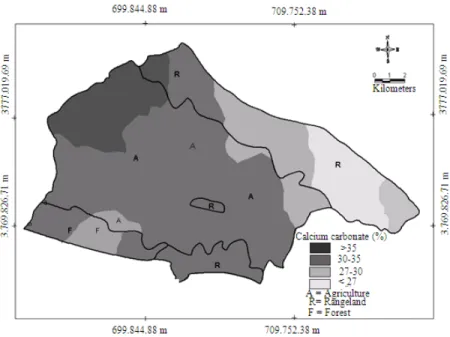
Fig. 4: Spatial distribution map of soil carbonate in the Merek catchment
Fig. 5: Spatial distribution of SOC in the Merek catchment
Soil organic carbon: Table 4 shows that mean soil organic carbon in the agriculture, rangeland and forest. The value was 1.35, 1.56, 2.14 % in the topsoil and 1.03, 1.33 and 1.45% in the subsoil, respectively. The t-test and ANOVA analyses conducted showed that SOC means are significantly different from each other within soil depth and among agro-ecological zones (Table 4
Fig. 6: Special distribution of CEC in the Merek catchment
Crop residue burning contributes to the global warming through CO2 emission. It is estimated that annually 259 Gg of CO2 is emitted into the atmosphere by burning of crop residues (Environment Organization of Iran, 2003).
Field verification showed that up to down tillage practice in the hill slope by moldboard plow contributes SOC loss due to disturbance of the topsoil. This improper tillage practices strongly accelerate soil erosion through destroying SOC and soil structures (Rosa et al., 2009). The study by Senthilkumar et al. (2009) showed that improper tillage can decrease about 12% in SOC level in the agricultural areas. In the rangelands, reduction of SOC occurs by overgrazing with rate five times the optimal capacity (Table 3). Overgrazing contributes to SOC loss through defoliation as well as reduction in plant canopy, forage production and litter accumulation. An investigation by Li et al. (2008) showed that heavy sheep grazing decreased about 16.5% of SOC.
Spatial distribution of SOC in the study area is shown in Fig. 4. Organic carbon is highest in the forest, which is located in the southwest of the catchment. Soils in the agriculture zone, which are mainly concentrated in the north and northwest of the study area, contain less than 1% organic carbon, which is associated with conventional tillage practiced.
CEC: The CEC of soils in the agriculture, rangeland and forest areas was 25.8, 24.6 and 35.1 cmolckg−1 for the topsoil and 31.1, 26.8 and 26.9 cmolckg−1 for the subsoil, respectively (Table 5). The t-test analysis showed that there was no significant difference (P≤ 0.05) within soil depths in the agriculture and rangeland zones, while it was significantly higher in the topsoil of the forest zone due to high level of SOC (2.14%). The ANOVA analysis (Table 6) showed that the CEC of soils in the forest zone was significantly (P≤ 0.05) more than the other agro-ecological zones due to significantly higher value of SOC in this zone (Fig. 6). The high value of CEC for the soils of forest zone was due to the presence of smectite. The results of the mineralogical analyses of soils and rocks (data not presented) showed that smectite is the dominant clay mineral in the soils of the forest area, whereas vermiculite was the dominant clay mineral in the soils of agriculture and rangeland areas.
lead to decline in CEC through SOC loss and soil erosion, especially in the hilly land of the study area.
CONCLUSION
Improper tillage practice (up-down the slope) in the hilly lands, land use shifting (conversion of the rangelands and forest to rain-fed agriculture areas) and crop residue burning contribute to reduction in SOC and soil aggregate stability levels due to soil compaction and soil erosion. Field observations showed that wheat and barley stubbles residues were burnt in late August to early September, before the next cropping. In the hilly areas, exposed soils through plowing are easily detached by rainfall in autumn unless the cultivated seeds grow quickly and produce sufficient canopy cover within a short time. Land use shifting through conversion of rangelands into agricultural areas and forest clearance are causing reduction in SOC, SAS CEC of the soils in the study area, leading to serious land degradation.
ACKNOWLEDGEMENT
The researchers would like to acknowledge University Putra Malaysia (UPM) and Agricultural Research and Education Organization of Iran (AREO) for their cooperation during data collection and analyses.
REFERENCES
An, S., A. Mentler, H. Mayer and W.E.H. Blum, 2010. Soil aggregation, aggregate stability, organic carbon and nitrogen in different soil aggregate fractions under forest and shrub vegetation on the Loess Plateau, China. Catena, 81: 226-233. DOI: 10.1016/j.catena.2010.04.002
Bertol, I., F.L. Engel, A.L. Mafra, O.J. Bertol and S.R. Ritter, 2007. Phosphorus, potassium and organic carbon concentrations in runoff water and sediments under different soil tillage systems during soybean growth. Soil Tillage Res., 94: 142-150. DOI: 10.1016/j.still.2006.07.008
Blanco, H. and R, Lal, 2008. Principles of Soil Conservation and Management. 1st Edn., Springer Publisher, New York, ISBN 9781402087080, pp: 617.
Diaz, A.R., P.M. Sanleandro, A.S. Soriano, F.B. Serrato and H. Faulkner, 2007. The causes of piping in a set of abandoned agricultural terraces in southeast Spain. Catena, 17: 282-293. DOI: 10.1016/j.catena.2006.07.008
Environment Organization of Iran, 2003. Initial National Communication to United Nations Framework Convention on Climate Change. United Nations Development.
FAO, 1996. Agro-Ecological Zoning Guidelines. 1st Edn., Food and Agriculture Org., Rome, ISBN: 9789251038901, pp: 778.
Geissen, V., R. Sanchez-Hernandez, C. Kampichler, R. Ramos-Reyes and A. Sepulveda-Lozada et al., 2009. Effects of land-use change on some properties of tropical soils-An example from Southeast Mexico. Geoderma, 151: 87-97. DOI: 10.1016/j.geoderma.2009.03.011
Gomez, J.A., T.A. Sobrinho, J.V. Giraldez and E. Fereres, 2009. Soil management effects on runoff, erosion and soil properties in an olive grove of Southern Spain. Soil Tillage Res., 102: 5-13. DOI: 10.1016/j.still.2008.05.005
Handyayani, I.P., M.S. Coyne, and R.S. Tokosh, 2010. Soil organic matter fractions and aggregate distribution in response to tall fescue stands. Int. J. Soil, Sediment, Water, 5: 1-10.
Hashim, G.M. and W.Y.W. Abdullah, 2005. Prediction of soil and nutrient losses in a highland catchment. Water, Air Soil Pollut., 5: 103-113. DOI: 10.1007/s11267-005-7406-x
Hazelton, P.A. and B.W. Murphy, 2007. Interpreting Soil Test Results: What do all the Numbers Mean? 2nd Edn., CSIRO Publisher, Sydney, ISBN: 9780643092259, pp: 152.
He, Y., Q. Wang, S. Wang and X. Yu, 2007. Characteristics of carbon and nitrogen of soil microbial biomass and their relationships with soil nutrients in Cunninghamia lanceolata plantations. Frontiers Forestry China, 2: 266-271. DOI: 10.1007/s11461-007-0043-y
Karlen, D.L., M.D. Tomer, J. Neppel and C.A. Cambardella, 2008. A preliminary watershed scale soil quality assessment in north central Iowa, USA. Soil Tillage Res., 99: 291-299. DOI: 10.1016/j.still.2008.03.002
Lal, R., 1998. Methods for Assessment of Soil Degradation. 1st Edn., CRC Press, New York, ISBN: 9780849374432, pp: 558.
Li, C., X. Hao, M. Zhao, G. Han and W.D. Willms, 2008. Influence of historic sheep grazing on vegetation and soil properties of a desert steppe in Inner Mongolia. Agric., Ecosyst. Environ., 128: 109-116. DOI: 10.1016/j.agee.2008.05.008
Marx, E.X., J. Hart and R.G. Stevens, 1999. Soil Test Interpretation Guide. Oregan State University, Oregan.
Masto, R.E., P.K. Chhankar, D. Singh and A.K. Patra, 2006. Soil quality response to long-term nutrient and crop management on a semi-arid Inceptisol. Agric., Ecosyst. Environ., 118: 130-142. DOI: 10.1016/j.agee.2006.05.008
Miller, R.H., D.R. Keeney and A.L. Page, 1983. Methods of Soil Analysis, Part 2: Chemical and Microbiological Properties. 2nd Edn., American Society of Agronomy, Madison, Wisconsin,. ISBN: 9780891180722, pp: 1159.
Newton, A.C., 2007. Biodiversity Loss and Conservation in Fragmented Forest Landscapes: the Forests of Montane Mexico and Temperate South America. 1st Edn.,CABI Publishing, Oxon, ISBN: 9781845932619, pp: 416.
Ruffino, B. and M. Zanetti, 2009. Adsorption study of several hydrophobic organic contaminants on an aquifer material. Am. J. Environ. Sci., 5: 508-516. DOI: 10.3844/ajessp.2009.508.516
Rosa, D.D.L., J.A. Moreno, F. Mayol and T. Bonson, 2000. Assessment of soil erosion vulnerability in western Europe and potential impact on crop productivity due to loss of soil depth using the Impel ERO model. Agric., Ecosyst. Environ., 81: 179-190. DOI: 10.1016/S0167-8809(00)00161-4 Rosa, D.D.L., M. Anaya-Romero, E. Diaz-Pereira, N.
Heredia and F. Shahbazi, 2009. Soil-specific agro-ecological strategies for sustainable land use-A case study by using MicroLEIS DSS in sevilla province (Spain). Land Use Policy,26: 1055-1065. DOI: 10.1016/j.landusepol.2009.01.004
Senthilkumar, S., B. Basso, A.N., Kravachenko and G.P., Roberton, 2009. Contemporary evidence of soil carbon loss in the U.S. corn belt. Soil Sci. Soc. Am. 73: 2078-2085.
Valentin, C., F. Agus, R. Alamban, A. Boosaner, J.P. Bricquet and V. Chaplot et al.,2008. Runoff and sediment losses from 27 upland catchments in Southeast Asia: Impact of rapid land use changes and conservation practices. Agric., Ecosyst.
Environ., 128: 225-238. DOI: