A Nonlinear Growth Analysis of Integrated Device Manufacturers’
Evolution to the Nanotechnology Manufacturing Outsourcing
Hung-Chi Hsiao
1, Hung-Ching Wen
2,*, Masaru Nakano
11
Graduate School of System Design and Management, Keio University, Yokohama, Japan
2
Department of Management Science, National Chiao Tung University, Hsinchu, Taiwan, ROC
Received 12 January 2012; received in revised form 18 February 2012; accepted 17 March 2012
Abstract
With the increasing cost of setting up a semiconductor fabrication facility, coupled with significant costs of
developing a leading nanotechnology process, aggressive outsourcing (asset-light business models) via working
more closely with foundry companies is how semiconductor manufacturing firms are looking to strengthen their
sustainable competitive advantages. This study aims to construct a market intelligence framework for developing a
wafer demand forecasting model based on long-term trend detection to facilitate decision makers in capacity
planning. The proposed framework modifies market variables by employing inventory factors and uses a top-down
forecasting approach with nonlinear least square method to estimate the forecast parameters. The nonlinear
mathematical approaches could not only be used to examine forecasting performance, but also to anticipate future
growth of the semiconductor industry. The results demonstrated the practical viability of this long-term demand
forecast framework.
Keywords: semiconductor, nonlinear growth model, forecast, inventory
1.
Introduction
Worldwide semiconductor industry has undergone several forms of business model change in the last 20 years. Pure
integrated device manufacturer (IDM), asset-light IDM, and pure integrated circuit (IC) chip design (fabless) are three distinct
types of semiconductor business models. The pure IDM model combines both ICs design and manufacturing functions in one
company. The asset-light IDM model maintains an internal manufacturing facility and outsources some process development
and product manufacturing to contract foundry companies (foundries) such as Taiwan Semiconductor Manufacturing
Company (TSMC) and United Microelectronics Corporation (UMC), whose business consists of producing semiconductors
on behalf of other chip companies. The third type is the fabless business model. Fabless companies design their own IC chips
while outsourcing all ICs manufacturing to foundries (Fig. 1) [1]. In 1990 to 2010, the revenue market share held by total
IDMs went from 99% in 1990 to 91% in 2000 and 78% in 2010, while the total fabless companies’ share increased from 1%
in 1990 to 9% in 2000 and 22% in 2010 [2]. The rapid decline in IDM market share suggests that the change of competitive
landscape makes it hard for IDMs to maintain core competency in both IC design and IC manufacturing. According to the
market research firm Gartner, Inc., fabless companies registered a very strong 13% sales compound annual growth rate
(CAGR) from 2000 to 2010, followed by foundries (7% CAGR) and IDMs (2% CAGR). In addition, the silicon wafer
shipments share held by total IDMs went from 88% in 2000 to 78% in 2010, while the total foundries’ share increased from
12% in 2000 to 22% in 2010 [2]. IDMs not only face the problem of keeping up with IC process technology trends, but must
* Corresponding author. E-mail address: wen80211@yahoo.com
also confront the fast-rising cost of constructing new manufacturing facilities. The continued cost escalation of
semiconductor fabrication facilities, process development, and ICs design has cast a shadow over the future of IDMs. The
trend is that an increasing number of IDMs are utilizing the outsourcing model to share resources with foundries, thus,
gaining access to the most-advanced production capabilities without investing large amounts of capital or incur the
significant costs of developing a cutting-edge manufacturing process.
Most IDM companies’ wafer manufacturing facilities are build-to-stock (BTS) operations, focusing on throughput and
machine utilization, while foundries’ manufacturing facilities are build-to-order (BTO) operations, focusing on due date and
cycle time as well as the improvement of customer satisfaction through better achievement of on-time delivery [3-4]. The
adopting of the BTO process allows foundry firms to customize customers’ products effectively and efficiently. BTO
operations create tremendous cost savings of manufacturing, particularly in the areas of reduced raw material and finished
goods’ inventories, improved flexibility, and increased economies of scale [5]. Foundry’s flexibility, wide range of process
capabilities, and the benefits of having an established reputation for intellectual property (IP) secrecy attract more IDMs to
outsource chip manufacturing to foundries. Foundries benefit from scope efficiencies that could be derived from flexible
manufacturing procedures for customized customer products. However, demand fluctuation owing to shortening product life
cycle and increasing product diversification in electronics products makes demand forecasting increasingly difficult and
complicated. Demand forecast errors cause either inefficient capacity utilization or capacity shortage that will significantly
affect the capital effectiveness and profitability of semiconductor manufacturing companies [6]. Therefore, there is an urgent
need to develop flexible market intelligence forecasting frameworks that enable foundries to offer timely responses to the
constantly changing environment and to maintain robust demand fulfillment strategies.
Nonlinear growth curves have been widely used in the modeling of disciplines, such as consumer durable goods, retail
services, agriculture, education, industrial innovations, high technology, administrative innovations, medical innovations,
energy-efficient innovation and biology [7]. Zwietering et al. [8] describe many growth phenomena in nature that have
sigmoid curves which have similar demand patterns as industries just listed above. In this paper, we use the semiconductor
industry as a target to explore more key information about the various capacity decisions that associated with enterprises’
decision. This paper aims to construct in a market intelligence framework, a long-term forecast model for foundries’ total
addressable market (TAM) wafer demand using nonlinear mathematical trend approaches. A market intelligence framework
is used to extract information and derive patterns from production and enterprise data to support strategic decisions [9]. To
System design & IC chip design
Internal IC manufacturing
facilities Internal assembly & test companies
System design & IC chip design
Internal IC manufacturing
facilities Internal assembly & test facilities
Contract foundry companies
Contract assembly & test companies
IC chip design
Contract foundry companies
Contract assembly & test companies
Year 1987
Fabless Companies
IDMs
Fabless Model Asset-light IDM Model
Pure IDM Model
validate the proposed model, an empirical study was conducted in wafer fabrication, in which historical data from
semiconductor industry were used to derive trends in wafer demand and to adjust them for inventory levels. Furthermore, we
compare forecasting performance of our various nonlinear regression models in order to select our best model. This research
first examines the semiconductor manufacturing paradigm shift toward foundry’s BTO operations and the trends that
accelerate foundry’s growth. The long-term impact of manufacturing changes in the semiconductor industry is then
discussed. Our empirical analysis of forecasting performance shows that the Gompertz model achieves the best curve fit and
forecast capability. This paper sheds new light on a forecast framework in semiconductor industry. Managerial implications
and directions for future research are highlighted in the paper.
The paper is organized as follows. In Section 2, we begin with a review of existing literature on trends and constraints
in semiconductor manufacturing as well as demand forecasts in the electronics industry. Section 3 lays out the research
framework to assess foundries’ total addressable wafer demand and sets forth the details of the source data and the
forecasting models proposed in this paper. Section 4 discusses the results of the empirical study and how well our forecasts
performed. The last section summarizes the findings of this study.
2.
The Significance of Demand Forecast
The drive for greater efficiencies and cost reductions has forced many firms to allocate their resources to their core
activities. The decision on whether to manufacture in-house or employ external suppliers has always been a fundamental issue
for manufacturing [10]. The semiconductor industry has continued technology migration and wafer size enlargement to
maintain technology innovation and cost reduction per transistor and thus, achieve unparalleled growth [11]. Assessing the
IDM’s constraints could provide perspective on semiconductor business trends, in particular, IDM movements toward the
foundry business model.
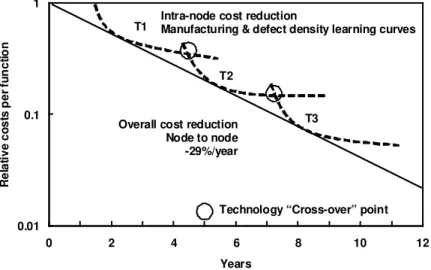
Fig. 2 illustrates that as technology T1 is maturing the technology node, T2 gets introduced. Initially, the defect density
and cost per function on T2 are higher than in technology T1. Through yield enhancement efforts, defect density drops
rapidly, as volume is ramped up in T2. Technology cross-over occurs when the cost per function in the newer technology is
below the cost per function in the older technology [12]. New semiconductor products normally require more advanced
nanotechnology processes for their manufacturing. Fast efficient process development has a direct impact on the commercial
success of new product introductions. In the semiconductor business, process R&D costs about $310-$402 million for 90-65
nanometer (nm), $600-$900 million for 45-32nm, and about $1.3 billion for 22nm, twice that of the 65nm node. Vajpayee
0.01 0.1 1
0 2 4 6 8 10 12
Years
R
el
at
ive
co
st
s p
er
f
u
n
ct
io
n
T1
T2
T3 Overall cost reduction
Node to node -29%/year
Intra-node cost reduction
Manufacturing & defect density learning curves
Technology “Cross-over” point
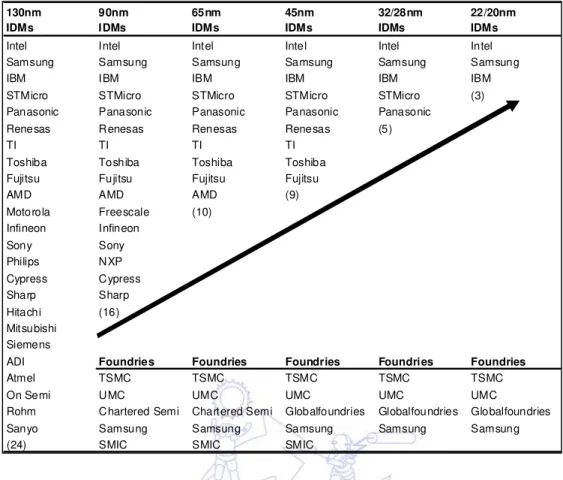
and Dhasmana [13] state only three IDMs (Intel Corporation, Samsung Electronics Co., Ltd., and IBM Microelectronics)
could survive this, at and beyond, the 22nm mark. When comparing that to 16 IDMs at the 90nm node, or 10 IDMs at 45nm
(Table 1), it is clear that the much-awaited trend of IDM outsourcing to foundries is set to gain more momentum. Thus,
foundries, especially larger ones, have benefit of volume lacking in IDMs that reduces defect density and thus can lowers
cost. Such cost reductions have been a cornerstone in the success of foundries through the years.
In the global semiconductor industry, producing the right product in the right quantities at a competitive cost is the
keystone of innovation. However, the cost of building and equipping manufacturing facilities at various levels of technology
increases substantially over time. IDM companies not only face the problem of keeping up with IC process technology
trends, but also confront the fast-rising cost of constructing a new wafer fab. A modern semiconductor wafer fabrication
facility requires a capital investment of US$2.5-3.0 billion for 90-65nm technologies, US$3.5-4.0 billion for 45-32nm
technologies, and US$4.5-6.0 billion for 22-12nm technologies [13]. Table 2 shows that, in 2009, only three semiconductor
suppliers had semiconductor capital outlays of US$1.0 billion or more, down from 16 companies only two years earlier in
2007 [14]. The trend is that more and more IDMs are utilizing the outsourcing model to share resources with foundry
companies and, thus, gain access to top production capabilities without investing large amounts of capital, or incurring the
significant costs of developing a leading-edge manufacturing process themselves. Foundry firms must plan for future
customer demand, production schedules and materials requirement to operate efficiently.
Modeling growth of semiconductor sales or demand has received considerable attention in studies of electronics
industry dynamics and management of capital investment. There is a huge time-series literature on methods to generate
demand forecasts [15]. For example, Norton and Bass [16] modeled diffusion of a new product (demand migration) in the
market. Mahajan and Wind [17] surveyed the new product forecasting models. Kurawarwala and Matsuo [18] studied
seasonal personal computer demands by Bass function [19]. Victor and Ausubel [20] used a logistic model to examine the
global dynamics of eight generations of dynamic random access memory (DRAM) and forecast the market characteristics of
130nm IDMs
90nm IDMs
65nm IDMs
45nm IDMs
32/28nm IDMs
22/20nm IDMs
Intel Intel Intel Intel Intel Intel
Samsung Samsung Samsung Samsung Samsung Samsung
IBM IBM IBM IBM IBM IBM
STMicro STMicro STMicro STMicro STMicro (3)
Panasonic Panasonic Panasonic Panasonic Panasonic
Renesas Renesas Renesas Renesas (5)
TI TI TI TI
Toshiba Toshiba Toshiba Toshiba
Fujitsu Fujitsu Fujitsu Fujitsu
AMD AMD AMD (9)
Motorola Freescale (10)
Infineon Infineon
Sony Sony
Philips NXP
Cypress Cypress
Sharp Sharp
Hitachi (16)
Mitsubishi Siemens
ADI Foundries Foundries Foundries Foundries Foundries
Atmel TSMC TSMC TSMC TSMC TSMC
On Semi UMC UMC UMC UMC UMC
Rohm Chartered Semi Chartered Semi Globalfoundries Globalfoundries Globalfoundries
Sanyo Samsung Samsung Samsung Samsung Samsung
(24) SMIC SMIC SMIC
the next DRAM generations. Frank [21] adopted a modified logistic model to forecast the diffusion of wireless
communications in Finland. Zhu and Thonemann [22] utilized the discrete version of the Bass diffusion model and improved
on Kurawarwala and Matsuo [18] model to develop an adaptive forecasting algorithm. Accurate demand forecast could
effectively reduce decision uncertainty for capacity planning, including capacity level assessment, capacity allocation and
capacity expansion strategies. Any investment in capacity expansion at the wrong stage of life cycle could lead to excess
capacity and reduce profitability for the semiconductor companies.
Furthermore, inventory is a significant influencing factor to the volatile semiconductor market. In the macroeconomic
literature, two essential theories are often utilized to clarify the role of inventory in the business cycle. The first theory
proposed by Blinder [23] is called the production-smoothing theory which assumes that firms hold inventories to smooth the
time path of production. By doing so, firms are able to lower average costs of production under demand uncertainty when the
cost function is convex. This theory predicts that inventory is countercyclical with respect to sales. The other theory of Kahn
[24] on stock-out-avoidance assumes that firms keep inventories in order to prevent losses of opportunity for potential sales.
When production takes time and is unable to respond to demand shock immediately, firms have an incentive to over-produce
in responding to unexpected demand. It results in pro-cyclical inventory. Hence, understanding inventory change is
important for studying the business cycle. Semiconductor companies hold a substantial semiconductor finished-goods
inventory in order to smooth out production. From our exploratory study on forecast model practices, little research has been
done on semiconductor long-term demand forecasting via our proposed top-down approach by using the nonlinear least
square method as well as factoring in inventory effect.
3.
The Framework for the Long-Term Wafer Demand Forecast
Foundries make forecasts of different types to help them handle uncertainties. They must plan for future customer
demand, production schedules and materials requirement planning in order to operate efficiently. The first step is to identify
the objectives. The second step is to plot the observations against time for model selection. The construction of forecast Rank Company Capex* Company Capex* Company Capex* Company Capex* Company Capex*
1 Samsung $6.8B Samsung $8.0B Samsung $6.8B Intel $4.5B Samsung $9.6B
2 Intel $5.8B Hynix $5.1B Intel $5.2B Samsung $3.5B TSMC $5.9B
3 Hynix $4.8B Intel $5.0B Hynix $2.9B TSMC $2.7B Intel $5.2B
4 Toshiba $3.0B Micron $3.7B Micron $2.3B Hynix $3.0B
5 Micron $3.0B Toshiba $3.6B Toshiba $2.2B Globalfoundries $2.8B
6 Powerchip $2.6B Powerchip $2.6B TSMC $1.9B Toshiba $1.9B
7 TSMC $2.4B TSMC $2.6B SanDisk $1.6B Nanya $1.8B
8 AMD $1.9B Nanya $2.1B Infineon $1.3B UMC $1.8B
9 Infineon $1.6B Elpida $2.1B Micron $1.6B
10 ST $1.5B SanDisk $1.9B Elpida $1.2B
11 Fujitsu $1.4B Infineon $1.9B TI $1.2B
12 Sony $1.3B ProMOS $1.8B
13 TI $1.3B AMD $1.7B
14 Elpida $1.3B ST $1.1B
15 SanDisk $1.1B Spansion $1.1B
16 UMC $1.0B Fujitsu $1.0B
2010
2006 2007 2008 2009
Table 2 “Billion-Dollar Club” for capital spending, 2006-2010
model is an iterative process including selecting suitable model, formulating it, estimating the model parameters, carrying
out diagnostic checks and then trying alternative models if necessary. The accuracy of forecasting methods have been
compared on different series data [25]. In order to improve forecasting accuracy, good theoretical models need to incorporate
factors from real setting to improve its practical value and usefulness.
3.1. Research framework
The semiconductor universe consists of analogue ICs, metal-oxide-semiconductor (MOS) logic ICs, MOS memory ICs,
MOS micro components, optoelectronics, sensors, and discrete components. The MOS memory market became
commoditized due to standardization, volatile chip price, slow innovation, and excess entry. They have so far been excluded
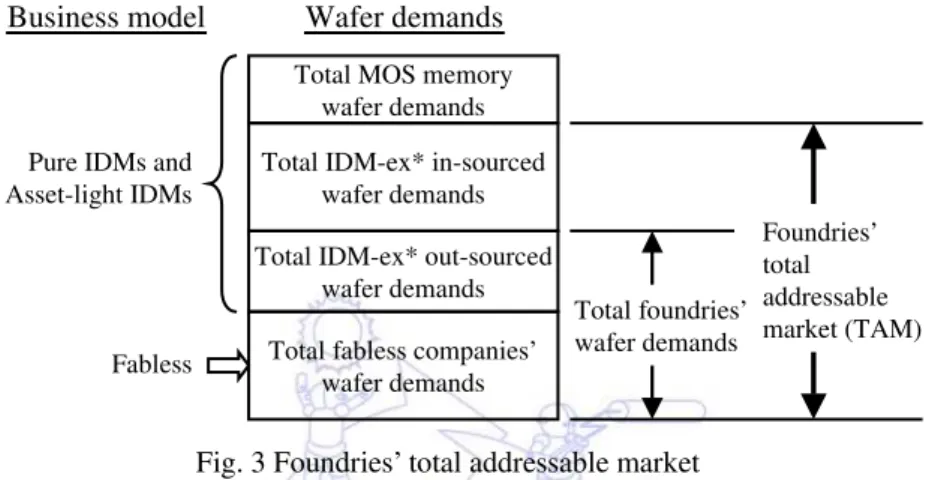
from the foundry addressable market. Two tailwinds will improve foundry growth (Fig. 3). The first is the fabless
semiconductor industry, which is expected to grow significantly faster than the semiconductor industry as a whole. The
second is IDMs’ outsourcing wafer demand, excluding MOS memory products. Fig. 4 presents the framework for building a
model of total semiconductor wafer manufacturing TAM for foundries from two different levels which are influencing
factors and forecast components. The five influencing factors are as follows:
(1) Total semiconductor sales excluding MOS memory products (Semi-ex sales).
(2) Average total semiconductor gross margin excluding MOS memory products (Semi-ex gross margin).
(3) Average total semiconductor days of inventory (DOI) by the end of the year excluding MOS memory products
(Semi-ex DOI).
(4) Wafer demand for total foundry companies.
(5) Total IDM, excluding MOS memory products, in-sourced (IDM-ex in-sourced) wafer demand.
Historical and current data for the five influencing factors were used to derive the trends in semiconductor wafer
demand and to adjust the inventory fluctuation. IDMs and fabless companies outsource wafer fabrication to foundries. The
value of the wafers produced is a subset of the final value of the ICs sold. The cost of purchased wafer from foundries is a
portion of semiconductor companies’ cost of goods sold (COGS). Available data from some research companies regarding
Semi-ex sales, Semi-ex gross margin, Semi-ex DOI, total foundries’ historical wafer demands, and total IDM-ex in-sourced
wafer demands is used for forecasting the trend of Semi-ex COGS per single wafer. The long-term Semi-ex wafer demand
could be simply derived from the result of dividing long-term Semi-ex forecast COGS by the projected COGS per wafer.
Moreover, this framework factors in inventory fluctuation and the inventory change. A ratio of COGS to the sum of COGS
and inventory change is derived from Semi-ex’s sales, gross margin, and DOI. In this ratio, less than one represents the
wafer manufacturing firms over-producing in respond to a soft market demand. The over-built wafers flow into inventory. In Fig. 3 Foundries’ total addressable market
Note: * IDM-ex denotes IDMs’ wafer demand excluding MOS memory products Total MOS memory
wafer demands
Total IDM-ex* in-sourced wafer demands
Total IDM-ex* out-sourced wafer demands
Total fabless companies’ wafer demands Business model
Pure IDMs and Asset-light IDMs
Fabless
Wafer demands
Total foundries’ wafer demands
contrast, a ratio over one represents the semiconductor firms under-producing in response to strong market demand. Wafers
in inventories are filler for the market demand shortages. Semi-ex’s COGS, total foundries’ wafer demands, and IDM-ex’s
in-sourced wafer demand need to be adjusted by some inventory-based adjustment method to exclude inventory effects.
The developed forecasting models of Semi-ex’s sales are evaluated by a simple logistic, the Gompertz, and the
Chapman-Richards models. Therefore, we could estimate the level of Semi-ex’s total addressable wafers contributing to
shipments and excluding the influence caused by inventory. The forecast components of our practical long-term demand
forecast framework could be effectively derived from the proposed framework.
Fig. 4 Framework for the long-term demand forecast of semiconductor total addressable market
Note: Semi-ex denotes semiconductor market excludes MOS memory chip products.
Total foundries wafer demands (history) Total IDM-ex in-sourced wafer demands
(history) Total Semi-ex wafer demands (Total foundries TAM) Semi-ex DOI (history) Semi-ex DOI index (assume year 2003 = 100)
Semi-ex inventory index Semi-ex COGS Semi-ex COGS index Semi-ex sales (history) Semi-ex sales index (assume Year 2003 = 100)
Semi-ex change in inventory
Semi-ex COGS index + change of Semi-ex inventory
Ratio of Semi-ex COGS index to (Semi-ex COGS index+change of
Semi-ex inventory) Semi-ex gross margin (history) Semi-ex sales growth rate Semi-ex COGS adjusted to exclude
+/- inventory
Semi-ex COGS per wafer adjusted to exclude +/- inventory Growth rate of Semi-ex COGS per wafer adjusted
to exclude +/- inventory
Total IDM-ex in-sourced wafer demands adjusted to exclude +/- inventory
Total foundries wafer demands adjusted to exclude +/- inventory
Total Semi-ex wafer demands adjusted to exclude +/- inventory
Total Semi-ex wafer outsourcing ratio to
foundry Influencing Factors 1 3 4 2 5 6
Historical data framework
Semi-ex sales (forecast) Semi-ex gross margin (forecast) Semi-ex sales growth rate (forecast) Semi-ex sales (history) Nonlinear growth curve fit Semi-ex sales index (history) Semi-ex sales index (forecast) Semi-ex gross margin (history) curve fit Semi-ex DOI index (history) Semi-ex COGS (forecast) Semi-ex COGS index (forecast) Semi-ex DOI index (forecast) curve fit Semi-ex inventory index (forecast) Semi-ex change in inventory (forecast) Semi-ex COGS index + change of Semi-ex inventory
(forecast) Ratio of Semi-ex
COGS index to (Semi-ex COGS index+change of Semi-ex inventory)
(forecast)
Growth rate of Semi-ex COGS per wafer adjusted
to exclude +/- inventory (history)
Semi-ex COGS per wafer adjusted to exclude
+/-inventory (history)
Total Semi-ex wafer demands adjusted to exclude
+/-inventory (forecast) Total Semi-ex wafer demands
(Total foundries TAM) (Forecast) Growth rate of Semi-ex
COGS per wafer adjusted to exclude +/- inventory
(forecast) curve
fit
Semi-ex COGS per wafer adjusted to exclude
+/-inventory (forecast)
Semi-ex COGS adjusted to exclude
+/- inventory (forecast) Forecast Components 1 2 3 4 5 6 Forecast framework Total foundries wafer demands (history) Total IDM-ex in-sourced wafer demands
(history) Total Semi-ex wafer demands (Total foundries TAM) Semi-ex DOI (history) Semi-ex DOI index (assume year 2003 = 100)
Semi-ex inventory index Semi-ex COGS Semi-ex COGS index Semi-ex sales (history) Semi-ex sales index (assume Year 2003 = 100)
Semi-ex change in inventory
Semi-ex COGS index + change of Semi-ex inventory
Ratio of Semi-ex COGS index to (Semi-ex COGS index+change of
Semi-ex inventory) Semi-ex gross margin (history) Semi-ex sales growth rate Semi-ex COGS adjusted to exclude
+/- inventory
Semi-ex COGS per wafer adjusted to exclude +/- inventory Growth rate of Semi-ex COGS per wafer adjusted
to exclude +/- inventory
Total IDM-ex in-sourced wafer demands adjusted to exclude +/- inventory
Total foundries wafer demands adjusted to exclude +/- inventory
Total Semi-ex wafer demands adjusted to exclude +/- inventory
Total Semi-ex wafer outsourcing ratio to
foundry Influencing Factors 1 3 4 2 5 6
Historical data framework
Semi-ex sales (forecast) Semi-ex gross margin (forecast) Semi-ex sales growth rate (forecast) Semi-ex sales (history) Nonlinear growth curve fit Semi-ex sales index (history) Semi-ex sales index (forecast) Semi-ex gross margin (history) curve fit Semi-ex DOI index (history) Semi-ex COGS (forecast) Semi-ex COGS index (forecast) Semi-ex DOI index (forecast) curve fit Semi-ex inventory index (forecast) Semi-ex change in inventory (forecast) Semi-ex COGS index + change of Semi-ex inventory
(forecast) Ratio of Semi-ex
COGS index to (Semi-ex COGS index+change of Semi-ex inventory)
(forecast)
Growth rate of Semi-ex COGS per wafer adjusted
to exclude +/- inventory (history)
Semi-ex COGS per wafer adjusted to exclude
+/-inventory (history)
Total Semi-ex wafer demands adjusted to exclude
+/-inventory (forecast) Total Semi-ex wafer demands
(Total foundries TAM) (Forecast) Growth rate of Semi-ex
COGS per wafer adjusted to exclude +/- inventory
(forecast) curve
fit
Semi-ex COGS per wafer adjusted to exclude
+/-inventory (forecast)
Semi-ex COGS adjusted to exclude
3.2. Sample and data sources
Industry data are typically provided by trade organizations in order to assure objectivity. In this study, our data sets
consist of three sources. Semi-ex’s sales, gross margin and DOI are collected form the Global Semiconductor Alliance
(GSA). Total foundries’ wafer demand and sales from fabless and IDM are drawn from Gartner, Inc., an industry research
firm. The selection of sample period, from 2003 to 2010, is based on the longest data availability. Therefore, we have eight
observations for each of data set in our study. The worldwide semiconductor sales and MOS memory sales come from the
World Semiconductor Trade Statistics (WSTS) published by the Semiconductor Industry Association (SIA). The data set has
thirty years of data, covering from 1981 to 2010.
3.3. Nonlinear models for semiconductor sales forecast
(1) Nonlinear growth models
Growth phenomenon of semiconductor sales is a sigmoid curve. Many new forecasting models were proposed based
on nonlinear regression models. Three nonlinear mathematical models considered in this study include the simple Logistic
[26-27], the Gompertz [28], and the Chapman-Richards [28] models. Background and historical information could be found
in the references for further details.
Logistic model y(t)=L/
(
1+ae−bt)
(1)Gompertz model
y
(
t
)
=
Le
−ae−bt (2)Chapman-Richards model bt f
ae L t
y = − − 1−
1
) 1 ( )
( (3)
For all models considered, y is the dependent growth variable, t is the independent variable, L, a, b, and f are parameters to be estimated, e is the exponential function, and ln is the natural logarithm. Khamis et al. [29] notes that the parameters for the growth curve models considered in this paper are defined as follows: L is the asymptote or the possible maximum of the response variable; a is the biological constant and could be specified by evaluate the models at the start of growth when the predictor variable is zero; b is the parameter governing the rate at which the response variable approaches its potential maximum; and f is the allometric constant.
(2) Analytical process
In order to test the forecast accuracy of the simple logistic, the Gompertz, and the Chapman-Richards models, the
analytical process is divided into two steps.
Step 1: Model estimation
The first step is used to estimate the models. After reserving the last five data points to test forecast accuracy of the
selected nonlinear growth models, the remaining data points were used to fit the three models. The coefficients of the models
are estimated by using nonlinear least squares with STATISTICA statistical software. After the coefficients were computed
and the models were fitted, the estimated values were calculated.
Step 2: Fit and forecast performance
The nonlinear equations were fitted to growth data by nonlinear regression with a Levenberg-Marquardt algorithm.
This algorithm seeks the values of the parameters that minimize the sum of the squared differences between the values of the
observed and the predicted values of the dependent variable. The Levenberg-Marquardt nonlinear regression procedure
available in STATISTICA 9 [30] was used to demonstrate the method of parameter estimation by using the datasets of
The program then calculated the set of parameters with the lowest residual sum of squares and their 95% confidence
intervals. The coefficient of determination (R2
n Y Y RMSE
n
t
t t ˆ) /
(
1
2
−
=
∑
=
) and root mean square error (RMSE) are used to measure performance as
recommended in the literature. Comparison of RMSEs is one useful approach to determine forecasting accuracy between
competing models. For forecast performance, the models are used to forecast the last five data points of the datasets. The
accuracy of out-of-sample forecasts is evaluated by the mean absolutely percentage error (MAPE). The mathematical
representations are shown below:
(4)
(
ˆ)
/ / 100%1
×
−
=
∑
= Y Y Y n
MAPE
n
t
t t
t (5)
where Yt is the actual value at time t, Ŷt
Moreover, if a three-parameter model is sufficient to describe the data, it is recommended over a four-parameter model
because the three-parameter model is simpler and therefore, it’s easier to use and because the three-parameter solution is
more stable since the parameters are less correlated.
is the estimate at time t, and n is the number of observations. These measurements are based on the residuals, which represent the distance between real data and predictive data. Consequently, if the value of
the residuals is small, the fit and prediction performance is considered acceptable. Nonlinear models yielded plausible
prediction values when MAPE is low. According to Lewis [31], MAPE is an effective index to evaluate forecasting
performance. A forecast with MAPE less than 10% is considered an excellent fit, those between 10% to 20% as good fits,
those between 20% to 50% as reasonable fits, and over 50% as incorrect fit.
4.
Results and Discussions
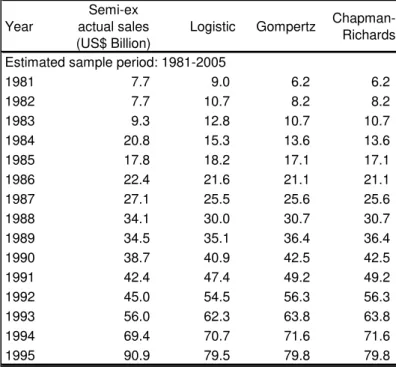
Thirty time-series datasets describing worldwide semiconductor revenues and MOS memory sales were collected to test
the forecast accuracy of the simple logistic, the Gompertz, and the Chapman-Richards models. Since the sample period for
these data is bigger than 30 years, both time series datasets are quite valid if the predicted sample period about 5 years is
correctly identified. Table 3 presents the estimated sample period, predicted sample period, and the fitting and forecasting
performance for the data set of worldwide semiconductor sales excluding MOS memory.
Year
Semi-ex actual sales (US$ Billion)
Logistic Gompertz
Chapman-Richards
Estimated sample period: 1981-2005
1981 7.7 9.0 6.2 6.2
1982 7.7 10.7 8.2 8.2
1983 9.3 12.8 10.7 10.7
1984 20.8 15.3 13.6 13.6
1985 17.8 18.2 17.1 17.1
1986 22.4 21.6 21.1 21.1
1987 27.1 25.5 25.6 25.6
1988 34.1 30.0 30.7 30.7
1989 34.5 35.1 36.4 36.4
1990 38.7 40.9 42.5 42.5
1991 42.4 47.4 49.2 49.2
1992 45.0 54.5 56.3 56.3
1993 56.0 62.3 63.8 63.8
1994 69.4 70.7 71.6 71.6
1995 90.9 79.5 79.8 79.8
The evaluation rule is that the larger the value for R2 and the smaller the value for RMSE, the better the fit performance
is. All models have considerably high R2 values. The best fit models are the Gompertz and Chapman-Richards models
because of the highest R2 Year
Semi-ex actual sales (US$ Billion)
Logistic Gompertz
Chapman-Richards
1996 95.9 88.6 88.2 88.2
1997 107.9 98.0 96.8 96.8
1998 102.6 107.3 105.5 105.5
1999 117.1 116.6 114.3 114.3
2000 155.2 125.5 123.1 123.1
2001 114.1 134.0 131.9 131.9
2002 113.7 141.9 140.7 140.7
2003 133.9 149.2 149.3 149.3
2004 165.9 155.9 157.8 157.8
2005 179.0 161.9 166.1 166.1
R2 0.952 0.953 0.953
RMSE 11.4 11.3 11.3
Rank of fit 2 1 1
Predicted sample period: 2006-2010 (out-of-sample)
2006 189.2 167.2 174.1 174.1
2007 197.8 171.9 182.0 182.0
2008 202.3 175.9 189.6 189.6
2009 181.5 179.4 197.0 197.0
2010 228.7 182.5 204.1 204.1
MAPE 11.8% 8.3% 8.3%
Rank of predict 2 1 1
Forecsting Power* good excellent excellent
value (0.953) and RMSE value (11.300). In addition, the Gompertz and the Chapman-Richards Table 3 Fitting and forecasting performance ranks of three nonlinear regression models (Continued)
Note: * A forecast with MAPE less than 10% is considered an excellent fit, those between 10% and 20% as good fits,
those between 20% to 50% as reasonable fits, and those over 50% as incorrect fits.
(1=Year 1981; 5-year predictions) 0
50 100 150 200 250
0 5 10 15 20 25 30
Time
W
or
ld
w
id
e
S
em
ico
n
d
uct
or
S
a
les
e
xcl
u
d
in
g
MO
S
me
mo
ry (U
S
Bi
ll
io
n
D
ol
lar
)
Observed Logistic Gompertz Chapman-Richards
5-year predictions (2006-2010)
Out-of-sample (2006-2010):
MAPE of Chapman-Richards model in 2006-2010: 11.8% MAPE of Gompertz model in 2006-2010: 8.3%
MAPE of Logistic model in 2006-2010: 8.3%
models accurately predict worldwide semiconductor sales with a smaller MAPE value (8.3%) than the simple Logistic model
for the out-of-sample data from 2006 to 2010 (Fig. 5). The smaller the value for MAPE, the better the prediction
performance is. Furthermore, it is recommended to describe the data by the three-parameter Gompertz model over the
four-parameter Chapman-Richards model because the three-parameter model is simpler and easier to use. Thus, the
Gompertz model is best model that we are looking for. As a result, we note that the total semiconductor sales excluding
MOS memory for 2010, globally, are expected to be US$229 billion and should enjoy a 3.4% CAGR over 2010-2015, and
2.9% CAGR from 2010 to 2020 based on the Gompertz model forecast.
Bringing together five influencing factors versus the implied semiconductor wafer demand growth in the proposed
forecast framework as shown in Fig. 4, we can estimate the level of semiconductor wafer demand implicit in projections.
There remain elements of assumptions here, but in most cases, we notice that our semiconductor forecast framework needs
simply to revert back to its levels from 2003 to 2007 to meet the forecast assumptions due to an unusual severe downturn in
2008 to 2009. Table 4 shows the results of the estimating semiconductor’s total addressable wafer market. Row 11 shows
inventory ratio from 0.94 to 1.05 in 2003 to 2010. It represents inventory smooth out the semiconductor shortage and
oversupply ranges from -6% to 5%. The fluctuations of volatile semiconductor demand make the inventory factor important.
The results show the practical viability of employing the proposed framework for long-term demand forecast. It considers an
inventory factor to enhance the decision quality for foundry’s capacity planning, i.e., to reduce the risks of capacity shortage
or surplus.
Moreover, the rapid growth of fabless production and the rise of IDM wafer outsourcing to foundries would have a
direct bearing on increasing the semiconductor TAM for foundries. The total foundry long-term forecast demand relied on
Row Items 2003 2004 2005 2006 2007 2008 2009 2010
1 Semi-ex* sales (US$ billion) 134 166 179 189 198 202 182 229
2 Semi-ex sales growth rate (%) 18% 24% 8% 6% 5% 2% -10% 26%
3 Semi-ex sales index (assume Yr2003 = 100) 100 124 134 141 148 151 136 171
4 Semi-ex gross margin (%) 45% 47% 47% 46% 45% 47% 45% 51%
5 Semi-ex COGS (US$ billion) 74 88 95 103 110 108 100 111
6 Semiex COGS index ( = semiex sales index x (1 -semi-ex gross margin))
55
66 71 77 82 80 75 83
7 Semi-ex EOY wafer DOI (assume Yr2003 = 100) 100 98 93 103 93 102 93 105
8 ex inventory index ( = (semi-ex DOI x Semi-ex COGS) / 360)
15
18 18 22 21 23 19 24
9 Change of semi-ex inventory 2.4 2.6 0.4 3.7 -0.8 1.5 -3.5 5.0
10 Semi-ex COGS index + change of semi-ex inventory
57
68 72 81 81 82 71 88
11 Ratio of semi-ex COGS index to (semi-ex COGS index + change of semi-ex inventory)
0.96
0.96 0.99 0.95 1.01 0.98 1.05 0.94
12 Semi-ex COGS adjusted to exclude +/- inventory (US$ billion)
71
84 95 98 111 106 105 105
13 Semi-ex COGS per wafer adjusted to exclude +/-inventory (US$)
1,304
1,368 1,353 1,323 1,223 1,100 1,232 1,107
14 Semi-ex COGS per wafer adjusted to exclude +/-inventory growth rate (%)
-2% 5% -1% -2% -8% -10% 12% -10%
15 Semi-ex wafer shipments (8"-eq. Mpcs†) 57 64 70 78 90 98 81 100
16 Semi-ex wafer shipments growth rate (%) 12% 13% 10% 11% 15% 9% -17% 24%
17 Semi-ex wafer shipments adjusted to exclude +/-inventory (8"-eq. Mpcs)
54
62 70 74 91 96 85 95
18 Of which: IDM-ex‡ in-sourced wafer shipments adjusted to exclude +/- inventory (8"-eq. Mpcs)
43
47 53 55 68 73 63 66
19 Of which: Total foundry wafer shipments adjusted to exclude +/- inventory (8"-eq. Mpcs)
11
15 17 19 23 23 22 29
20 Semi-ex wafer outsourcing ratio to foundry (%) 19% 23% 24% 25% 26% 24% 27% 29%
Table 4 Estimating semiconductor total addressable wafer demands, 2003-2010
Note: * Semi-ex denotes the total semiconductor excluding MOS memory market segment, † 8”-eq. Mpcs denotes million
the result of multiplying the total semiconductor wafer TAM by the semiconductor wafer outsourcing ratio to foundries.
Row 20 presents an outsourcing ratio gain of ten percentage points from 20% in 2003 to 30% in 2010 as shown in Table 4.
We assume the 30% outsourcing ratio in 2010 as a baseline and make an incremental outsourcing ratio assumption over the
2011 to 2020 time-frame from flat to 5% outsourcing ratio increase per year. Curves in Fig. 6 represent the total
semiconductor wafer demand outsourced to foundry firms in 2003 to 2020. The flat outsourcing ratio assumption in 2011 to
2020 shows that total foundry wafer demand is forecast to grow to 51 million eight-inch (8”) equivalent wafers in 2020 from
29 million 8” equivalent wafers, a 2010 to 2020 CAGR of 6% as compared to 12% CAGR from 2005 to 2010. In addition,
the assumption of 5% outsourcing ratio increase per year in 2011 to 2020 reflects the total foundry wafer demand forecast to
grow to 140 million 8” equivalent wafers in 2020, in which the outsourcing ratio of semiconductor wafer to foundry
increases to 79% in 2020 from 30% in 2010. The rise of fabless business and an unstoppable movement for IDMs toward an
asset-light business model are two further tailwinds to foundry expansion in the coming future. Therefore, total foundry
long-term wafer demand forecast can be derived from the domain knowledge judgment for the long-term strategic capacity
decisions.
5.
Conclusions
Aggressive outsourcing by IDMs (asset-light business model) and working more closely with foundries are new trends
in the semiconductor manufacturing industry. The rising of IDM wafer fabrication outsourcing to foundries is a significant
tailwind to the growth of foundry businesses. This study proposes a market intelligence long-term demand forecasting
framework for foundries which is constructed by using the five influencing factors of historical semiconductor market data
sets, including Semi-ex sales, Semi-ex gross margin, Semi-ex DOI, total foundry wafer demand and total IDM-ex in-sourced
wafer demand. The nonlinear growth model-fitting result of Semi-ex sales has shown that the Gompertz model performs
excellent MAPE and outperforms the simple Logistic and the Chapman-Richards models. The selected Gompertz model
enables to anticipate Semi-ex sales growth, and consequently enables to forecast the total foundry wafer demand with
different scenarios of Semi-ex wafer outsourcing ratios to foundry.
References
[1] K. C. Ku, H. P. Kao, and C. K. Gurumurthy, “Virtual inter-firm collaborative framework—An IC foundry
merger/acquisition project,” Technovation, vol. 27, pp. 388-401, Jun.-Jul. 2007. [2] Gartner, “Gartner, Inc. database,” http://my.gartner.com/, June 20, 2011.
[3] S. H. Chang, P. F. Pai, K. J. Yuan, B. C. Wang, and R. K. Li, “Heuristic PAC model for hybrid MTO and MTS production environment,” International Journal of Production Economics, vol. 85, pp. 347-358, Sep. 2003.
[4] K. H. Kang and Y. H. Lee, “Make-to-order scheduling in foundry semiconductor fabrication,” International Journal of Production Research, vol. 45, pp. 615-630, Feb. 2007.
[5] A. Sharma and P. LaPlaca, “Marketing in the emerging era of build-to-order manufacturing,” Industrial Marketing Management, vol. 34, pp. 476-486, Jul. 2005.
[6] C. F. Chien, Y. J. Chen, and J. T. Peng, “Manufacturing intelligence for semiconductor demand forecast based on technology diffusion and product life cycle,” International Journal of Production Economics, vol. 128, pp. 496-509, Dec. 2010.
[7] V. Mahajan, E. Muller, and F. M. Bass, “New product diffusion models in marketing: A review and directions for research,” Journal of Marketing, vol. 54, pp. 1-26, Jan. 1990.
[8] M. H. Zwietering, I. Jongenburger, F. M. Rombouts, and K. VAN’T Riet, “Modeling of the bacterial growth curve,” Applied and Environmental Microbiology, vol. 56, pp. 1875-1881, Jun. 1990.
[9] C. J. Kuo, C. F. Chien, and J.D. Chen, “Manufacturing intelligence to exploit the value of production and tool data to reduce cycle time,” IEEE Transactions on Automation Science and Engineering, vol. 8, pp. 103-111, Jan. 2011.
[10]G. Hoetker, “How much you know versus how well I know you: Selecting a supplier for a technically innovative component,” Strategic Management Journal, vol. 26, pp. 75-96, Jan. 2005.
[11]R. C. Leachman, S. Ding, and C. F. Chien, “Economic efficiency analysis of wafer fabrication,” IEEE Transactions on Automation Science and Engineering, vol. 4, pp. 501-512, Oct. 2007.
[12]R. Kumar, Fabless semiconductor implementation. New York: McGraw-Hill, 2008.
[13]B. Vajpayee, and V. Dhasmana, “Standoff: Gunning for returns,” http://www.thomsonone.com/, January 13, 2011. [14]R. Lineback, B. McClean, B. Matas, and T. Yancey, “The McCLEAN Report 2011 Edition,” http://www.icinsights.com/,
February 15, 2011.
[15]G. E. P. Box, G. M. Jenkins, and G. C. Reinsel, Time series analysis: forecasting and control, 4th edition. San Francisco: Wiley, 2008.
[16]J. A. Norton and F. M. Bass, “A diffusion theory model of adoption and substitution for successive generations of high technology products,” Management Science, vol. 33, pp. 1069-1086, Sep. 1987.
[17]V. Mahajan and Y. Wind, “New product forecasting models: Directions for research and implementation,” International Journal of Forecasting, vol. 4, pp. 341-358, 1988.
[18]A. A. Kurawarwala and H. Matsuo, “Forecasting and inventory management of short life-cycle products,” Operations Research, vol. 44, pp. 131-150, Jan.-Feb. 1996.
[19]F. M. Bass, “A new product growth for model consumer durables,” Management Science, vol. 15, pp. 215-227, Jan. 1969.
[20]N. M. Victor and J. H. Ausubel, “DRAMs as model organisms for study of technological evolution,” Technological Forecasting and Social Change, vol. 69, pp. 243-262, Apr. 2002.
[21]L. D. Frank, “An analysis of the effect of the economic situation on modeling and forecasting the diffusion of wireless communications in Finland,” Technological Forecasting and Social Change, vol. 71, pp. 391-403, May 2004.
[22]K. Zhu and U. W. Thonemann, “An adaptive forecasting algorithm and inventory policy for products with short life cycles,” Naval Research Logistics, vol. 51, pp. 633-653, Aug. 2004.
[23]A. S. Blinder, “Inventories and sticky prices: More on the microfoundations of macroeconomics,” The American Economic Review, vol. 72, pp. 334-348, Jun. 1982.
[24]J. A. Kahn, “Inventories and the volatility of production,” The American Economic Review, vol. 77, pp. 667-679, Sep. 1987.
[25]M. Çakanyildirim and R. O. Roundy, “SeDFAM: Semiconductor demand forecast accuracy model,” IIE Transactions, vol. 34, pp. 449-465, May 2002.
[26]J. A. Nelder, “The fitting of a generalization of the logistic curve,” Biometrics, vol. 17, pp. 89-110, Mar. 1961. [27]F. R. Oliver, “Methods of estimating the logistic growth function,” Applied Statistics, vol. 13, pp. 57-66, Jun. 1964. [28]N. R. Draper and H. Smith, Applied Regression Analysis, 2nd edition. New York: John Wiley & Sons, 1981.
[29]A. Khamis, Z. Ismail, K. Haron, and A. T. Mohammed, “Nonlinear growth models for modeling oil palm yield growth,” Journal of Mathematics and Statistics, vol. 1, pp. 225-233, Jul. 2005.