Micronutrients Involved in One-Carbon
Metabolism and Risk of Breast Cancer
Subtypes
Ilaria Cancarini1, Vittorio Krogh1, Claudia Agnoli1, Sara Grioni1, Giuseppe Matullo2, Valeria Pala1, Samuele Pedraglio1, Paolo Contiero3, Cristina Riva4, Paola Muti5, Sabina Sieri1*
1Department of Preventive and Predictive Medicine, Epidemiology and Prevention Unit, Fondazione IRCSS Istituto Nazionale dei Tumori, Milan, Italy,2Department of Medical Sciences, University of Torino and Human Genetics Foundation (HuGeF), Turin, Italy,3Department of Preventive and Predictive Medicine, Environmental Epidemiology Unit, Fondazione IRCSS Istituto Nazionale dei Tumori, Milan, Italy,
4Department of Surgical and Morphological Sciences, University of Insubria, Varese, Italy,5Department of Oncology, Faculty of Health Science, McMaster University, Hamilton, Ontario, Canada
Abstract
Background
Vitamins involved in one-carbon metabolism are hypothesized to influence breast cancer (BC) risk. However, epidemiologic studies that examined associations between B vitamin intake and BC risk have provided inconsistent results. We prospectively examined, in the Italian ORDET cohort, whether B vitamin consumption was associated with risk of BC and BC subtypes.
Methods
After a mean follow-up of 16.5 years, 391 BCs were diagnosed among 10,786 cohort women. B vitamin intakes were estimated from food frequency questionnaires. Cox propor-tional hazard models adjusted for energy intake and confounders, estimated hazard ratios (HR) with 95% confidence intervals (CIs) for BC according to intake.
Results
RRs were 0.61 (95% CI 0.38–0.97 highest vs. lowest quartile; P trend 0.025) for thiamine;
0.48 (95% CI 0.32–0.71; P trend<0.001) for riboflavin; 0.59 (95% CI 0.39–0.90; P trend
0.008) for vitamin B6, and 0.65 (95% CI 0.44–0.95; P trend 0.021) for folate. As regards risk
of BC subtypes, high riboflavin and folate were significantly associated with lower risk of estrogen receptor positive (ER+) and progesterone receptor positive (PR+) cancers, and high thiamine was associated with lower risk of ER-PR- cancers. High riboflavin was associ-ated with lower risk of both HER2+ and cancers, high folate with lower risk of HER2-disease, and high thiamine with HER2+ disease.
OPEN ACCESS
Citation:Cancarini I, Krogh V, Agnoli C, Grioni S, Matullo G, Pala V, et al. (2015) Micronutrients Involved in One-Carbon Metabolism and Risk of Breast Cancer Subtypes. PLoS ONE 10(9): e0138318. doi:10.1371/journal.pone.0138318
Editor:Chung-Jung Chiu, Tufts University, UNITED STATES
Received:May 14, 2015
Accepted:August 28, 2015
Published:September 16, 2015
Copyright:© 2015 Cancarini et al. This is an open access article distributed under the terms of the
Creative Commons Attribution License, which permits unrestricted use, distribution, and reproduction in any medium, provided the original author and source are credited.
Data Availability Statement:Data cannot be made freely available because of restrictions imposed by the ethics committee of the Fondazione IRCCS Istituto Nazionale dei Tumori (Milan, Italy), which does not allow open/public sharing of individual data. Aggregated data are available to other researchers upon request. Requests may be sent to Dr Vittorio Krogh ([email protected]).
Conclusions
These findings support protective effects of thiamine and one-carbon metabolism vitamins (folate, riboflavin, and vitamin B6) against BC in general; while folate may also protect against ER+PR+ and HER2- disease; and thiamine against ER-PR-, and HER2+ disease.
Introduction
One-carbon metabolism is a network of biochemical pathways that provides methyl groups for a variety of essential biomolecules and biological processes. Disruption of one-carbon metabo-lism can interfere with DNA replication, DNA repair, and regulation of gene expression through methylation, each of which could promote carcinogenesis. The B vitamin folate/folic acid is a major dietary source of methyl groups, whereas riboflavin (vitamin B2) and vitamin B6 are essential cofactors for enzymes involved in one-carbon metabolism that may influence methyl group bioavailability. Thus it is reasonable that dietary intake of B vitamins may influ-ence the development and progression of cancer, and dietary changes in the intake of these nutrients may modify the risk of cancer [1–4].
While many epidemiological studies have investigated the effect of dietary folate intake on breast cancer risk, relatively few studies have evaluated the influence of intake of other B vitamins on risk. Finding on folate have been inconsistent [5]. Two 2014 meta-analyses of observational studies[6,7] found that evidence from prospective epidemiological studies was inconclusive, while data from case-control studies[7] suggested that high folate had a signifi-cant protective effect against breast cancer. Studies that evaluated the influence of intake of other B vitamins on breast cancer risk have also produced mixed results [8–16].
Breast cancer is now classified into subtypes based in theory on gene expression profiles but determined in clinical practice by the expression of estrogen receptor (ER), progesterone recep-tor (PR), overexpression of human epidermal growth facrecep-tor receprecep-tor 2 (HER2) and the Ki67 proliferation index [17].
These subtypes differ in prognosis and factors that influence their occurrence [18,19]. Only limited data on the influence of intake of micronutrients involved in one-carbon metabolism on the risk of developing breast cancer subtypes are available. Two recent meta-analyses that investigated folate did not find any significant associations [5,6].
The aim of the present study was to investigate the hypothesis that breast cancer subtypes defined by ER, PR and HER2 status (but not Ki67, since we had no data available) have differ-ing etiologic pathways differentially influenced by intake of nutrients involved in one-carbon metabolism. We investigated women enrolled in the Italian ORDET (HORmones andDiet in theEtiology of BreastTumours) study.
Materials and Methods
Study population
The ORDET cohort consisted of 10,786 healthy women, residents of Varese Province in northern Italy, recruited voluntarily between June 1987 and June 1992. Age at recruitment was 35–69 years. Women taking hormone therapy in the three months before recruitment, with chronic or acute liver disease, with a history of cancer, or who had undergone bilateral
The study protocol was approved by the ethics committee of the Fondazione IRCCS Istituto Nazionale dei Tumori (Milan, Italy). The study complies with the Helsinki Declaration, and participants gave written informed consent to use clinical data for research.
At recruitment, information on lifestyle, menstrual history and reproductive history was collected; height, weight, and waist and hip circumferences were measured; and blood and urine samples were collected. The women also completed a self-administered semi-quantitative food frequency questionnaire (FFQ) [20].
The ORDET database was linked to the local Varese Cancer Registry, which is considered a high quality registry with less than 3% of cancers identified only through death certificates [21], to ascertain incident breast cancer cases (invasive and in situ) up to December 2006. Local residential and mortality databases were accessed to check vital status. Information on the ER, PR and HER2 status of cancers was obtained from electronic pathology reports. To standardize the quantification of receptor status, the following criteria for positivity were adopted:10% cells stained, any‘positive’description,20 fmol/mg, Allred score3, immu-noreactive score2, or H-score10 [22]. HER2 was considered overexpressed (positive) when>30% of cancer cells showed complete intense membrane staining (score 3+ according to ASCO 2007 guidelines) [23].
The FFQ only became available 30 months after starting recruitment. Women recruited at the beginning (n = 1500) did not complete the FFQ and were excluded from the present analy-sis. We also excluded women found to have a cancer diagnosis before recruitment, or who were lost to early follow-up, leaving 9093 women potentially eligible women. We subsequently excluded women for whom variables used as covariates in the statistical model were missing, and those for whom the ratio of total energy intake (determined from the FFQ) to basal meta-bolic rate (determined by the Harris-Benedict equation)[24] was in the first or last half-percen-tiles of the distribution: this to reduce the effect of implausible extreme values on the analysis. We therefore analysed 9009 women including 391 incident breast cancer cases.
Food frequency questionnaire
Dietary habits over the preceding year were assessed using a validated semi-quantitative FFQ, as described in detail elsewhere [20]. Volunteers completed the FFQ, on their own, at recruit-ment, with immediate review by a nurse/volunteer to draw attention to any missing items. The FFQ consisted of 107 food items and included photos with two or three sample dishes of defi-nite sizes, or references to standard portion sizes. The composition in nutrients of individual food items was obtained from Italian food composition tables [25] and the average intakes of macro and micronutrients for each volunteer were estimated. Few women in the ORDET cohort used B vitamin supplements at recruitment (0.58%) and while folic acid fortification of grain products is mandatory in the US, this is not the case in Italy. In this study we only esti-mated vitamin B intake from dietary sources excluding supplements.
Statistical analyses
Hazard ratios (HRs) with 95% confidence intervals (CIs) of developing breast cancer in relation to intakes of thiamine (B1), riboflavin (B2), niacin (B3), vitamin B6, and folate (B9) were esti-mated by multivariable Cox proportional hazard modelling with age as primary time variable. Vitamin intakes were categorized into quartiles based on the distribution of intake in the whole cohort, with the lowest quartile as reference. HRs were also calculated for 1 standard deviation increments in vitamin intake as a continuous variable.
(years), menopausal status (pre-, peri-, postmenopausal), oral contraception use (yes or no), parity (nulliparous, 1–2 children,>2 children), years of education, family history of breast can-cer (yes or no), and alcohol intake (g/day). Tests for linear trend were calculated by assigning an ordinal number to each quartile.
The proportional hazards assumption for B vitamins and all other covariates in relation to breast cancer risk was tested using the Grambsch and Therneau method [26]. In all cases, the proportional hazards assumption was satisfied.
In additional analyses, we tested whether effects of vitamin intake differed with alcohol intake, menopausal status, and BMI. To do this we performed stratified analyses using product terms (1 for alcohol intake<12g/d and 0 for alcohol12 g/d; 1 for pre-menopause and 0 for menopause, 1 for BMI25 and 0 for>25) that were multiplied by vitamin intake as a continu-ous variable. These models were adjusted with the same covariates as in the fully-adjusted model, with appropriate exclusions (menopausal status excluded in the model stratifying by menopausal status; alcohol intake excluded in the model stratifying by alcohol intake). The sig-nificance of interactions was assessed using a likelihood ratio test that compared the model that included the product term and the model that did not include it.
We investigated associations between vitamin intake and breast cancer in general, and also breast cancer subtypes defined by ER status (ER+, ER-), PR status (PR+, PR-), combined ER and PR status (ER+PR+, ER-PR-) and HER2 status (HER2+, HER2-).
The heterogeneity of associations according to receptor status was assessed using the data augmentation method [27] in which the difference in log likelihood between a model with receptor status-specific variables, and a model with a single HR estimate for each receptor sta-tus category, was compared to a chi-square distribution with 1 degree of freedom (comparison between receptor positive and receptor negative). In these analyses, women who developed a competing breast cancer subtype or had missing receptor status were censored at time of diagnosis.
Results
After a mean follow up of 16.3 years, 391 breast cancer cases were identified in the cohort (362 invasive and 29 in situ). Of these, 282 were ER+ and 82 ER- (27 unknown); 236 were PR+ and 126 PR- (29 unknown); and 62 HER2+ and 273 HER2- (56 unknown).
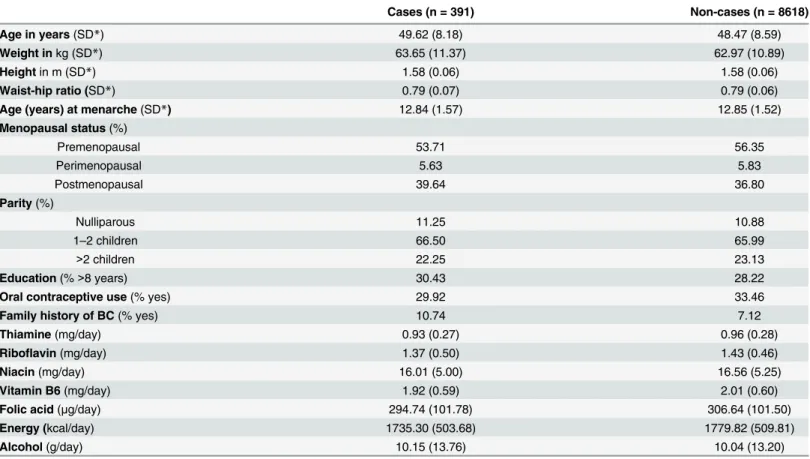
The distributions of vitamin intake and breast cancer risk factors in the cohort at recruit-ment are shown inTable 1according to disease status. Women who developed breast cancer were more educated, used less oral contraceptives, more often had a family history of breast cancer, and overall had a lower intake of B vitamins than those who did not.
Table 3shows associations between B vitamin intake and breast cancer risk according to ER status. High riboflavin intake was associated with significantly reduced risk of ER+ disease, evi-dent both in the quartile (HR 0.40; 95% CI 0.25–0.65 highest vs. lowest; P trend<0.001) and continuous (HR 0.77; 95% CI 0.63–0.94) models.
High vitamin B6 intake was also associated with reduced risk of ER+ disease: with a signifi-cant P trend, and signifisignifi-cant by the continuous model (HR 0.82; 95% CI 0.66–1.00).
High folate intake was also associated with a significantly reduced risk of ER+ disease, evi-dent in both the quartile (HR 0.58; 95% CI 0.36–0.91 highest vs. lowest; P trend 0.018) and con-tinuous (HR 0.84; 95% CI 0.70–1.00) models.
No significant associations of thiamine or niacin with ER+ breast cancer were found; neither were significant associations of riboflavin, folate, thiamine or niacin with ER- breast cancer found, although HR estimates were in the same direction as those for ER+ breast cancer. Vita-min B6 intake was significantly associated with reduced risk of ER- disease in the continuous model only (HR 0.63; 95% CI 0.44–0.91).
As regards PR+ disease, high intakes of riboflavin (HR 0.38; 95% CI 0.23–0.63 highest vs. lowest quartile; P trend<0.001) and of folate (HR 0.58; 95% CI 0.35–0.96 highest vs. lowest quartile; P trend, 0.049) were significantly associated with reduced incidence of this cancer sub-type in the quartile models; riboflavin also had a significant effect in the continuous model (HR 0.72; 95% CI 0.58–0.89).
Table 1. Baseline distribution of nutrients and factors influencing breast cancer risk by disease status in ORDET women.
Cases (n = 391) Non-cases (n = 8618)
Age in years(SD*) 49.62 (8.18) 48.47 (8.59)
Weight inkg (SD*) 63.65 (11.37) 62.97 (10.89)
Heightin m (SD*) 1.58 (0.06) 1.58 (0.06)
Waist-hip ratio (SD*) 0.79 (0.07) 0.79 (0.06)
Age (years) at menarche(SD*) 12.84 (1.57) 12.85 (1.52)
Menopausal status(%)
Premenopausal 53.71 56.35
Perimenopausal 5.63 5.83
Postmenopausal 39.64 36.80
Parity(%)
Nulliparous 11.25 10.88
1–2 children 66.50 65.99
>2 children 22.25 23.13
Education(%>8 years) 30.43 28.22
Oral contraceptive use(% yes) 29.92 33.46
Family history of BC(% yes) 10.74 7.12
Thiamine(mg/day) 0.93 (0.27) 0.96 (0.28)
Riboflavin(mg/day) 1.37 (0.50) 1.43 (0.46)
Niacin(mg/day) 16.01 (5.00) 16.56 (5.25)
Vitamin B6(mg/day) 1.92 (0.59) 2.01 (0.60)
Folic acid(μg/day) 294.74 (101.78) 306.64 (101.50)
Energy (kcal/day) 1735.30 (503.68) 1779.82 (509.81)
Alcohol(g/day) 10.15 (13.76) 10.04 (13.20)
*SD = standard deviation
As regards PR- disease, high thiamine (HR 0.37; 95% CI 0.16–0.88 highest vs. lowest quartile; P trend 0.012) and high vitamin B6 (HR 0.48; 95% CI 0.23–0.98 highest vs. lowest quartile; P trend 0.016) were significantly associated with lowered risk of this cancer subtype in the quartile models; vitamin B6 was also effective in the continuous model (HR 0.58; 95% CI 0.42–0.80). The test for heterogeneity between PR+ and PR- for vitamin B6 was significant (P = 0.030). No association of riboflavin, niacin, or folate with PR- breast cancer was found.
Table 4shows associations between vitamin intake with risk of breast cancer subtypes defined by joint ER and PR status. High intakes of riboflavin and folate were significantly asso-ciated with lowered risk of ER+PR+ disease, both in the quartile (HR 0.36; 95% CI 0.21–0.62 highest vs. lowest; P trend<0.001; HR 0.52, 95% CI 0.31–0.90 highest vs. lowest; P trend 0.024, respectively) and the continuous (HR 0.69; 95% CI 0.55–0.88; HR 0.79; 95% CI 0.64–0.97, respectively) models.
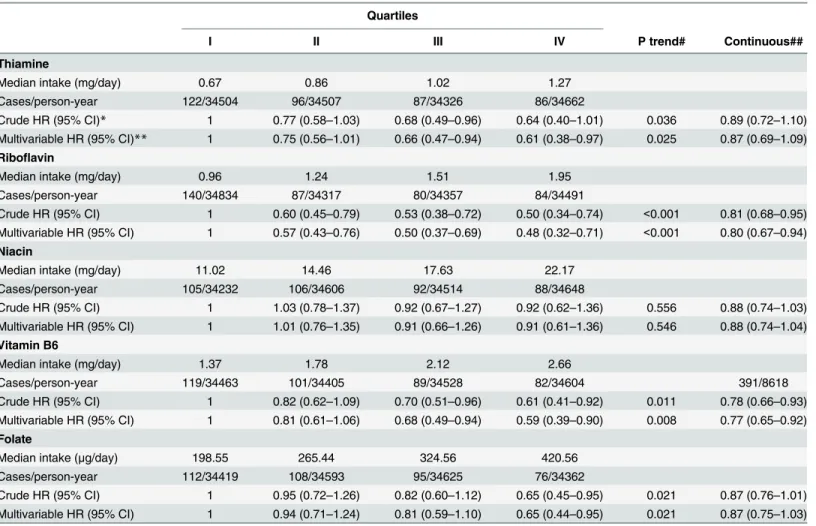
Table 2. HRs (95% CIs) of breast cancer in relation to quartiles of B vitamin intake in ORDET women.
Quartiles
I II III IV P trend# Continuous##
Thiamine
Median intake (mg/day) 0.67 0.86 1.02 1.27
Cases/person-year 122/34504 96/34507 87/34326 86/34662
Crude HR (95% CI)* 1 0.77 (0.58–1.03) 0.68 (0.49–0.96) 0.64 (0.40–1.01) 0.036 0.89 (0.72–1.10) Multivariable HR (95% CI)** 1 0.75 (0.56–1.01) 0.66 (0.47–0.94) 0.61 (0.38–0.97) 0.025 0.87 (0.69–1.09)
Riboflavin
Median intake (mg/day) 0.96 1.24 1.51 1.95
Cases/person-year 140/34834 87/34317 80/34357 84/34491
Crude HR (95% CI) 1 0.60 (0.45–0.79) 0.53 (0.38–0.72) 0.50 (0.34–0.74) <0.001 0.81 (0.68–0.95) Multivariable HR (95% CI) 1 0.57 (0.43–0.76) 0.50 (0.37–0.69) 0.48 (0.32–0.71) <0.001 0.80 (0.67–0.94)
Niacin
Median intake (mg/day) 11.02 14.46 17.63 22.17
Cases/person-year 105/34232 106/34606 92/34514 88/34648
Crude HR (95% CI) 1 1.03 (0.78–1.37) 0.92 (0.67–1.27) 0.92 (0.62–1.36) 0.556 0.88 (0.74–1.03) Multivariable HR (95% CI) 1 1.01 (0.76–1.35) 0.91 (0.66–1.26) 0.91 (0.61–1.36) 0.546 0.88 (0.74–1.04)
Vitamin B6
Median intake (mg/day) 1.37 1.78 2.12 2.66
Cases/person-year 119/34463 101/34405 89/34528 82/34604 391/8618
Crude HR (95% CI) 1 0.82 (0.62–1.09) 0.70 (0.51–0.96) 0.61 (0.41–0.92) 0.011 0.78 (0.66–0.93) Multivariable HR (95% CI) 1 0.81 (0.61–1.06) 0.68 (0.49–0.94) 0.59 (0.39–0.90) 0.008 0.77 (0.65–0.92)
Folate
Median intake (μg/day) 198.55 265.44 324.56 420.56
Cases/person-year 112/34419 108/34593 95/34625 76/34362
Crude HR (95% CI) 1 0.95 (0.72–1.26) 0.82 (0.60–1.12) 0.65 (0.45–0.95) 0.021 0.87 (0.76–1.01) Multivariable HR (95% CI) 1 0.94 (0.71–1.24) 0.81 (0.59–1.10) 0.65 (0.44–0.95) 0.021 0.87 (0.75–1.03)
*Adjusted by energy intake.
**Adjusted by height, waist hip ratio, age at menarche, menopausal status, oral contraceptive use, parity, education, family history of breast cancer, energy intake and alcohol intake.
# Tests for linear trend were calculated by assigning an ordinal number to each quartile. ## HR of developing breast cancer per 1 SD increase in vitamin intake
Table 3. HRs*(95% CIs) of breast cancer by ER and PR status in relation to quartiles of B vitamin intake in ORDET women.
ER+ ER- PR+
PR-Cases/
person-year
Multivariable HR (95% CI)*
Cases/
person-year
Multivariable HR (95% CI)
Cases/ person-year
Multivariable HR (95% CI)
Cases/
person-year
Multivariable HR (95% CI)
Thiamine
I 90/34246 1 25/33593 1 71/34039 1 43/33788 1
II 72/34283 0.80 (0.57–1.12) 17/33777 0.56 (0.29–1.08) 54/34085 0.76 (0.51–1.11) 35/33973 0.72 (0.44–1.18) III 61/34083 0.68 (0.45–1.03) 16/33632 0.46 (0.22–0.98) 53/33995 0.74 (0.47–1.16) 25/33732 0.48 (0.26–0.89) IV 59/34487 0.65 (0.37–1.13) 24/34057 0.51 (0.20–1.33) 58/34426 0.80 (0.44–1.44) 23/34102 0.37 (0.16–0.88)
P trend** 0.087 0.118 0.388 0.012
Continuous# 0.85 (0.65–1.11) 0.88 (0.55–1.41) 0.89 (0.67–1.18) 0.75 (0.50–1.13) P for
heterogeneity##
0.870 0.516
Riboflavin
I 105/34534 1 28/33742 1 87/34318 1 46/33959 1
II 66/34140 0.57 (0.41–0.80) 13/33629 0.41 (0.21–0.80) 51/33988 0.52 (0.36–0.74) 26/33770 0.55 (0.33–0.91) III 58/34184 0.49 (0.34–0.71) 17/33811 0.47 (0.24–0.92) 49/34063 0.45 (0.30–0.68) 27/33938 0.58 (0.33–1.01) IV 53/34241 0.40 (0.25–0.65) 24/33876 0.53 (0.24–1.19) 49/34177 0.38 (0.23–0.63) 27/33928 0.57 (0.29–1.14)
P trend <0.001 0.129 <0.001 0.103
Continuous# 0.77 (0.63–0.94) 0.89 (0.63–1.25) 0.72 (0.58–0.89) 0.94 (0.71–1.25) P for
heterogeneity##
0.472 0.130
Niacin
I 75/33964 1 24/33457 1 56/33752 1 42/33658 1
II 80/34387 1.10 (0.79–1.54) 20/33812 0.74 (0.40–1.38) 69/34261 1.23 (0.85–1.79) 32/33949 0.76 (0.47–1.23) III 70/34318 1.04 (0.71–1.52) 14/33778 0.46 (0.22–0.95) 57/34177 1.06 (0.69–1.62) 27/33918 0.64 (0.37–1.13) IV 57/34429 0.93 (0.57–1.50) 24/34012 0.64 (0.28–1.44) 54/34356 1.04 (0.62–1.75) 25/34070 0.60 (0.30–1.22)
P trend 0.761 0.155 0.958 0.121
Continuous# 0.89 (0.73–1.08) 0.80 (0.56–1.13) 0.92 (0.75–1.14) 0.75 (0.55–1.02) P for
heterogeneity##
0.601 0.262
Vitamin B6
I 88/34211 1 25/33575 1 67/33988 1 44/33781 1
II 76/34191 0.84 (0.60–1.16) 19/33633 0.65 (0.35–1.21) 62/34030 0.88 (0.61–1.27) 34/33806 0.72 (0.45–1.16) III 61/34270 0.67 (0.45–0.98) 15/33829 0.45 (0.22–0.92) 54/34179 0.74 (0.49–1.12) 23/33925 0.47 (0.26–0.85) IV 57/34427 0.62 (0.38–1.01) 23/34022 0.52 (0.23–1.20) 53/34349 0.70 (0.41–1.18) 25/34084 0.48 (0.23–0.98)
P trend 0.030 0.073 0.133 0.016
Continuous# 0.82 (0.66–1.00) 0.63 (0.44–0.91) 0.88 (0.71–1.10) 0.58 (0.42–0.80) P for
heterogeneity##
0.240 0.031
Folate
I 83/34188 1 23/33557 1 64/33982 1 41/33752 1
II 82/34353 0.98 (0.71–1.35) 17/33745 0.66 (0.35–1.27) 66/34175 0.98 (0.68–1.41) 32/33917 0.80 (0.49–1.30) III 69/34415 0.81 (0.57–1.17) 19/33941 0.68 (0.34–1.33) 63/34326 0.90 (0.60–1.33) 26/34042 0.66 (0.38–1.14) IV 48/34144 0.58 (0.36–0.91) 23/33816 0.73 (0.34–1.60) 43/34063 0.58 (0.35–0.96) 27/33884 0.74 (0.39–1.41)
P trend 0.018 0.467 0.049 0.254
Continuous# 0.84 (0.70–1.00) 0.98 (0.72–1.32) 0.84 (0.69–1.01) 0.93 (0.71–1.20)
As regards ER-PR- disease, thiamine had a significant effect only in the quartile model (HR 0.29; 95% CI 0.09–0.91 highest vs. lowest; P trend 0.024) while vitamin B6 intake was associ-ated with lowered risk only in the continuous model (HR 0.53; 95% CI 0.34–0.82). The test for heterogeneity between ER+PR+ and ER-PR- for vitamin B6 was significant (P = 0.040).
Table 5shows associations between vitamin intake and risk of HER2+/- breast cancer. The highest quartile of riboflavin intake, compared to lowest, was associated with significantly reduced risk of both HER2+ (HR 0.28; 95% CI 0.10–0.74; P trend 0.004) and HER2- (HR 0.47; 95% CI 0.29–0.76; P trend 0.002) disease.
The highest quartile of thiamine intake, compared to lowest, was associated with signifi-cantly reduced risk of HER2+ disease (HR 0.31; 95% CI 0.10–0.99; P trend, 0.017).
Compared to the lowest, the highest quartiles of vitamin B6 (HR 0.58; 95% CI 0.36–0.94; P trend 0.011) and folate (HR 0.60; 95% CI 0.38–0.94 P trend 0.028) were associated with sig-nificantly lowered risk of HER2- disease. Vitamin B6 intake was also sigsig-nificantly associated with reduced risk of HER2- disease in the continuous model (HR 0.77; 95% CI 0.63–0.95). No significant associations of niacin, vitamin B6 or folate with HER2+ disease were found. No sig-nificant associations of niacin or thiamine with HER2- disease were found. Tests for heteroge-neity between HER2+ and HER2- cancers were not significant for any B vitamin.
We further investigated the association of vitamin B with the risk of triple-negative cancers (ER-/PR-/HER2-, only 37 cases), but found no significant association between dietary intake of vitamin B and the risk of this poor prognosis breast cancer subtype (HR of 0.51; 95% CI 0.24–
1.07 for thiamine, HR of 1.21; 95% CI 0.75–1.94 for riboflavin, HR of 0.69; 95% CI 0.40–1.21 for niacin, HR of 0.59; 95% CI 0.33–1.04 for vitamin B6 and HR of 1.05; 95% CI 0.67–1.65 for folate intake).
When the analyses were stratified by BMI, vitamin B6 was significantly associated with reduced risk in lean women whereas thiamine was associated with reduced risk in overweight women. Tests for heterogeneity were not significant (P = 0.088 for thiamine and P = 0.896 for vitamin B6) (S1 Table). In no case were associations between vitamin intake and breast cancer risk influenced by menopausal status (tests for interaction not significant). However, high vita-min B6 was significantly associated with reduced risk in premenopausal women, whereas high riboflavin was significantly associated with reduced risk both in pre- and post-menopausal women (S2 Table). Folic acid intake was associated with reduced breast cancer risk in women who did not consume, or consumed little (<12g/day) alcohol; however it is unlikely that our study had the power to adequately examine such associations (S3 Table).
Table 3. (Continued)
ER+ ER- PR+
PR-Cases/
person-year
Multivariable HR (95% CI)*
Cases/
person-year
Multivariable HR (95% CI)
Cases/ person-year
Multivariable HR (95% CI)
Cases/
person-year
Multivariable HR (95% CI)
P for
heterogeneity##
0.378 0.534
*Adjusted for height, waist-hip-ratio, age at menarche, menopausal status, oral contraceptive use, parity, education, family history of breast cancer, energy intake, and alcohol intake.
**Tests for linear trend calculated by assigning an ordinal number to each quartile. # HR of developing breast cancer per 1 SD increase in vitamin intake.
## Receptor positive vs. receptor negative (ER+ vs. ER-; PR+ vs. PR-).
Table 4. HRs (95% CIs) of breast cancer by ER plus PR status in relation to quartiles of B vitamin intake in ORDET women.
ER+PR+
ER-PR-Cases/person-year Multivariable HR (95% CI)* Cases/person-year Multivariable HR (95% CI)
Thiamine
I 68/34027 1 22/33581 1
II 50/34055 0.73 (0.49–1.09) 14/33752 0.50 (0.25–1.03)
III 49/33966 0.72 (0.45–1.14) 13/33615 0.40 (0.17–0.91)
IV 50/34400 0.71 (0.38–1.33) 14/34015 0.29 (0.09–0.91)
P trend** 0.254 0.024
Continuous # 0.84 (0.62–1.14) 0.64 (0.37–1.12)
P for Heterogeneity## 0.405
Riboflavin
I 83/34295 1 24/33720 1
II 47/33962 0.51 (0.35–0.74) 9/33611 0.36 (0.16–0.79)
III 44/34037 0.43 (0.28–0.66) 13/33790 0.47 (0.22–1.02)
IV 43/34154 0.36 (0.21–0.62) 17/33841 0.55 (0.22–1.38)
P trend** <0.001 0.201
Continuous# 0.69 (0.55–0.88) 0.85 (0.57–1.28)
P for Heterogeneity## 0.379
Niacin
I 53/33736 1 21/33442 1
II 65/34231 1.24 (0.85–1.83) 17/33793 0.73 (0.37–1.43)
III 51/34148 1.03 (0.66–1.61) 9/33754 0.35 (0.15–0.84)
IV 48/34334 1.03 (0.60–1.78) 16/33974 0.53 (0.20–1.36)
P trend** 0.901 0.072
Continuous# 0.92 (0.74–1.14) 0.71 (0.46–1.07)
P for Heterogeneity## 0.275
Vitamin B6
I 63/33966 1 21/33554 1
II 58/33999 0.89 (0.61–1.30) 16/33613 0.67 (0.34–1.33)
III 49/34159 0.74 (0.48–1.14) 11/33813 0.41 (0.18–0.94)
IV 47/34325 0.69 (0.40–1.20) 15/33982 0.44 (0.17–1.18)
P trend** 0.136 0.054
Continuous# 0.88 (0.70–1.11) 0.53 (0.34–0.82)
P for Heterogeneity## 0.040
Folate
I 62/33975 1 21/33550 1
II 61/34148 0.95 (0.65–1.38) 12/33718 0.54 (0.26–1.13)
III 57/34285 0.85 (0.56–1.27) 14/33912 0.59 (0.28–1.26)
IV 37/34040 0.52 (0.31–0.90) 16/33780 0.64 (0.26–1.54)
P trend** 0.024 0.334
Continuous# 0.79 (0.64–0.97) 0.84 (0.58–1.22)
P for Heterogeneity## 0.760
*Adjusted for height, waist-hip-ratio, age at menarche, menopausal status, oral contraceptive use, parity, education, family history of breast cancer, energy intake, and alcohol intake.
**Tests for linear trend were calculated by assigning an ordinal number to each quartile. # HR of developing breast cancer per 1 SD increase in vitamin intake.
## ER+PR+ vs.
Table 5. HRs and 95% CIs of breast cancer by HER2 status in relation to quartiles of B vitamin intake in ORDET women.
HER2+
HER2-Cases/person-year Multivariable HR (95% CI)* Cases/person-year Multivariable HR (95% CI)
Thiamine
I 17/33560 1 90/34183 1
II 20/33817 0.87 (0.44–1.75) 60/34132 0.66 (0.46–0.94)
III 11/33632 0.38 (0.55–0.92) 61/34013 0.67 (0.44–1.01)
IV 14/34055 0.31 (0.10–0.99) 62/34404 0.66 (0.38–1.15)
P trend** 0.017 0.120
Continuous # 0.88 (0.51–1.52) 0.80 (0.61–1.04)
P for Heterogeneity## 0.720
Riboflavin
I 23/33756 1 97/34356 1
II 14/33664 0.44 (0.22–0.89) 60/34054 0.58 (0.41–0.82)
III 10/33792 0.26 (0.11–0.61) 61/34151 0.57 (0.39–0.83)
IV 15/33852 0.28 (0.10–0.74) 55/24171 0.47 (0.29–0.76)
P trend 0.004 0.002
Continuous 0.67 (0.43–1.04) 0.82 (0.67–1.00)
P for Heterogeneity## 0.430
Niacin
I 15/33401 1 76/33911 1
II 14/33792 0.85 (0.40–1.82) 79/34334 1.04 (0.75–1.46)
III 17/33842 1.00 (0.45–2.22) 59/34153 0.80 (0.54–1.19)
IV 16/34029 0.89 (0.33–2.36) 59/34335 0.82 (0.51–1.32)
P trend 0.923 0.252
Continuous 0.91 (0.61–1.36) 0.82 (0.67–1.00)
P for Heterogeneity## 0.638
Vitamin B6
I 16/33542 1 87/34113 1
II 18/33653 0.96 (0.47–1.95) 72/34120 0.79 (0.56–1.09)
III 11/33822 0.55 (0.23–1.30) 56/34163 0.59 (0.40–0.87)
IV 17/34047 0.73 (0.27–1.96) 58/34337 0.58 (0.36–0.94)
P trend 0.324 0.011
Continuous 0.74 (0.48–1.14) 0.77 (0.63–0.95)
P for Heterogeneity## 0.862
Folate
I 16/33530 1 81/34106 1
II 16/33766 0.89 (0.43–1.85) 74/34238 0.89 (0.64–1.25)
III 15/33954 0.80 (0.36–1.76) 67/34306 0.79 (0.55–1.14)
IV 15/33813 0.78 (0.31–1.98) 51/34083 0.60 (0.38–0.94)
P trend 0.563 0.028
Continuous 0.92 (0.64–1.33) 0.87 (0.73–1.04)
P for Heterogeneity## 0.772
*Adjusted for height, waist-hip-ratio, age at menarche, menopausal status, oral contraceptive use, parity, education, family history of breast cancer, energy intake, and alcohol intake.
**Tests for linear trend were calculated by assigning an ordinal number to each quartile. # HR of developing breast cancer per 1 SD increase in vitamin intake.
## HER2+ vs. HER2-.
Discussion
In the present prospective study we found that high intakes of thiamine and B vitamins involved in one-carbon metabolism (folate, riboflavin, vitamin B6) were associated with signifi-cantly lowered breast cancer risk. Furthermore, high folate intake was associated with reduced risk of ER+, PR+, ER+PR+ and HER2- subtypes; high thiamine was associated with reduced risk of ER-PR- and HER2+ disease; high riboflavin was associated with reduced risk of ER+, PR+, HER2+, and HER2- disease; and high vitamin B6 was associated with reduced risk of ER+, ER-, PR-, and HER2- cancers.
We examine first folate. The literature on folate intake and breast cancer is extensive. Recent reviews/meta-analyses do not provide a clear picture [6,7]. Most cohort studies did not find an association of folate intake with breast cancer risk [8,9,12,14,28–34], but several case-control studies reported an apparent protective effect,[35], in agreement with the findings of the pres-ent study.
The literature (cohort studies) on folate intake and risk of breast cancer subtypes defined by ER and PR status is less extensive[8,12,13,30,34,36,37]; some reported null results [8,36], whereas the Nurses’Health Study[37], the Vitamins And Lifestyle study [12], and the EPIC study (in premenopausal women only) [34] found that high folate intake was associated with lowered risk of ER- breast cancer. To our knowledge four cohort studies have assessed folate in relation to risk of breast cancer according to joint ER/PR status [30,34,38,39]. In the Swedish Mammography Cohort [30] folate intake was associated with a significantly reduced risk of ER +PR- breast cancer, but not of ER+PR+ or ER-PR- cancer. The Shanghai Women’s Health Study [38] and the EPIC study [34] did not find significant associations of folate with ER+PR + or ER-PR- breast cancer, but Roswall et al.[39] reported that high dietary folate was ated with increased risk of ER+PR- breast cancer. We found that high folate intake was associ-ated with reduced risk of ER+, PR+, and ER+PR+ cancers, and also that high folate tended to be associated with lowered risk of ER- breast cancer, but not significantly.
To our knowledge, only the EPIC study [34] has evaluated the relation of folate intake to the HER2 status of breast cancer, reporting null results. We found that high folate intake was asso-ciated with significantly lowered risk of HER2- breast cancer.
Folate plays an important role in DNA methylation [40,41] and is involved in the conver-sion of homocysteine to methionine and the production of S-adenosyl methionine (SAM)–an essential component of protein, RNA and DNA methylation reactions [42]. Low folate status may alter DNA methylation to influence gene expression, and adversely affect DNA integrity and stability [41]. DNA methylation occurs mainly on the cytosine of CpG islands and typi-cally results in epigenetic downregulation of gene expression.
Methylation of CpG islands on the ER gene has been associated with lack of ER gene expres-sion in breast cancer cell lines and primary breast cancers [43–46]. Hypermethylation has also been found to be involved in silencing PR gene expression [47]. However, findings from our study do not support the hypothesis that low folate intake is associated with increased risk of ER- breast cancer.
significantly reduced risk of ER+PR+, HER2+ and HER2- breast cancers, so that the apparent protective effect of riboflavin was independent of HER2 status. We also found that high vita-min B6 was associated with reduced risk of HER2- breast cancer.
Vitamin B6 and riboflavin may protect against breast cancer by mechanisms unrelated to one-carbon metabolism. It is known that chronic inflammation plays a role in the development and progression of several types of cancer [52] including breast cancer [53]. Vitamin B6 is required for the production of inflammation-mediating cytokines [54] and the activation of lymphocytes as part of the inflammatory response [55]. So it is of interest that several inflam-matory conditions have been associated with low plasma levels vitamin B6, although the signif-icance of this association remains unclear [56].
As regards thiamine, this enzyme cofactor is involved in metabolic processes that are often altered in tumour tissue [57,58]. However the few studies that investigated thiamine intake in relation to breast cancer risk found no significant association [9,32,59]; and no studies appear to have investigated thiamine intake and risk of specific breast cancer subtypes. In the present study we found that high thiamine intake was associated with significantly lowered risks of developing breast cancer in general, and also of PR-, ER-PR- and HER2+ subtypes. However, further studies are required to confirm these associations and elucidate their mechanisms.
The strengths of the present study are its prospective design, and highly complete follow-up. Furthermore, dietary habits, over the year prior to assessment, were assessed using a food frequency questionnaire that was designed to capture the eating habits of the enrolled women by including local recipes and products. The main sources of folate in our cohort were vegeta-bles (28.0%), cereals (17.4%) and fruits (12.2%); for riboflavin they were milk and dairy prod-ucts (24.5.0%), meat and meat prodprod-ucts (21.8%), and vegetables (15.2%); for vitamin B6 they were meat and meat products (28.9%), cereals (16.7%) and fruits (15.3%); for thiamine they were cereals (23.0%), meat and meat products (22.0%), and fruits (14.0%). Given the wide dis-tribution of sources for these micronutrients it is unlikely that the risk reductions can be attrib-uted to a specific dietary pattern (for example a Mediterranean-type diet) or to generic factors such as overall healthy lifestyle, however we cannot exclude these possibilities.
A limitation is that only a single dietary assessment was made and any changes in dietary habits since that assessment (20 years ago) will have been missed. Furthermore, we cannot rule out confounding by factors that we were not able to estimate or estimated in a sub-optimal way in our questionnaires.
Another limitation is the hormone receptor expression of the cancers was determined using various biochemical and immunohistochemical techniques that may not be completely equiva-lent to each other, resulting in some misclassification receptor status.
To conclude, our study supports the hypothesis that high dietary intakes of folate and other B vitamins involved in one-carbon metabolism reduce breast cancer risk. It also suggests that folate protects against ER+PR+ and HER2- subtypes; and that thiamine protects against be ER-PR- and HER2+ subtypes. However further prospective studies are required to clarify the associations of these vitamins with risk of developing different breast cancer subtypes.
Supporting Information
S1 Table. HRs (95% CIs) of breast cancer in relation to quartiles of B vitamin intake in ORDET women, stratified by BMI
(DOCX)
S3 Table. HRs (95% CIs) of breast cancer in relation to quartiles of folate intake in ORDET women, stratified by alcohol consumption
(DOCX)
Acknowledgments
We thank all ORDET study participants, A. Evangelista and D. Del Sette for technical support, and Don Ward for help with the English.
Author Contributions
Conceived and designed the experiments: SS VK PM. Performed the experiments: SS CA SG SP. Analyzed the data: IC SS. Contributed reagents/materials/analysis tools: PC SP CR GM VP. Wrote the paper: IC SS VK CA PM.
References
1. Choi SW, Mason JB (2000) Folate and carcinogenesis: an integrated scheme. J Nutr 130: 129–32. PMID:10720158
2. Duthie SJ, Hawdon A (1998) DNA instability (strand breakage, uracil misincorporation, and defective repair) is increased by folic acid depletion in human lymphocytes in vitro. FASEB J 12: 1491–7. PMID:
9806758
3. Mason JB, Choi SW (2000) Folate and carcinogenesis: developing a unifying hypothesis. Adv Enzyme Regul 40: 127–41. PMID:10828349
4. Ames BN (2001) DNA damage from micronutrient deficiencies is likely to be a major cause of cancer. Mutat Res 475: 7–20. PMID:11295149
5. Tio M, Andrici J, Eslick GD (2014) Folate intake and the risk of breast cancer: a systematic review and meta-analysis. Breast Cancer Res Treat.
6. Chen P, Li C, Li X, Li J, Chu R, Wang H (2014) Higher dietary folate intake reduces the breast cancer risk: a systematic review and meta-analysis. Br J Cancer 110: 2327–38. doi:10.1038/bjc.2014.155 PMID:24667649
7. Zhang YF, Shi WW, Gao HF, Zhou L, Hou AJ, Zhou YH (2014) Folate intake and the risk of breast can-cer: a dose-response meta-analysis of prospective studies. PLoS One 9: e100044. doi:10.1371/ journal.pone.0100044PMID:24932496
8. Cho E, Holmes M, Hankinson SE, Willett WC (2007) Nutrients involved in one-carbon metabolism and risk of breast cancer among premenopausal women. Cancer Epidemiol Biomarkers Prev 16: 2787–90. PMID:18086790
9. Kabat GC, Miller AB, Jain M, Rohan TE (2008) Dietary intake of selected B vitamins in relation to risk of major cancers in women. Br J Cancer 99: 816–21. doi:10.1038/sj.bjc.6604540PMID:18665162
10. Levi F, Pasche C, Lucchini F, La VC (2001) Dietary intake of selected micronutrients and breast-cancer risk. Int J Cancer 91: 260–3. PMID:11146455
11. Ma E, Iwasaki M, Junko I, Hamada GS, Nishimoto IN, Carvalho SM, et al. (2009) Dietary intake of folate, vitamin B6, and vitamin B12, genetic polymorphism of related enzymes, and risk of breast can-cer: a case-control study in Brazilian women. BMC Cancer 9: 122. doi:10.1186/1471-2407-9-122
PMID:19389261
12. Maruti SS, Ulrich CM, White E (2009) Folate and one-carbon metabolism nutrients from supplements and diet in relation to breast cancer risk. Am J Clin Nutr 89: 624–33. doi:10.3945/ajcn.2008.26568 PMID:19116331
13. Shrubsole MJ, Jin F, Dai Q, Shu XO, Potter JD, Hebert JR, et al. (2001) Dietary folate intake and breast cancer risk: results from the Shanghai Breast Cancer Study. Cancer Res 61: 7136–41. PMID:
11585746
14. Zhang S, Hunter DJ, Hankinson SE, Giovannucci EL, Rosner BA, Colditz GA, et al. (1999) A prospec-tive study of folate intake and the risk of breast cancer. JAMA 281: 1632–7. PMID:10235158
16. Lajous M, Lazcano-Ponce E, Hernandez-Avila M, Willett W, Romieu I (2006) Folate, vitamin B(6), and vitamin B(12) intake and the risk of breast cancer among Mexican women. Cancer Epidemiol Biomark-ers Prev 15: 443–8. PMID:16537699
17. Goldhirsch A, Winer EP, Coates AS, Gelber RD, Piccart-Gebhart M, Thurlimann B, et al. (2013) Per-sonalizing the treatment of women with early breast cancer: highlights of the St Gallen International Expert Consensus on the Primary Therapy of Early Breast Cancer 2013. Ann Oncol 24: 2206–23. doi:
10.1093/annonc/mdt303PMID:23917950
18. de Kruijf EM, Bastiaannet E, Ruberta F, de Craen AJ, Kuppen PJ, Smit VT, et al. (2014) Comparison of frequencies and prognostic effect of molecular subtypes between young and elderly breast cancer patients. Mol Oncol.
19. Taherian-Fard A, Srihari S, Ragan MA (2014) Breast cancer classification: linking molecular mecha-nisms to disease prognosis. Brief Bioinform.
20. Sieri S, Krogh V, Muti P, Micheli A, Pala V, Crosignani P, et al. (2002) Fat and protein intake and subse-quent breast cancer risk in postmenopausal women. Nutr Cancer 42: 10–7. PMID:12235640
21. Contiero P, Tittarelli A, Maghini A, Fabiano S, Frassoldi E, Costa E, et al. (2008) Comparison with man-ual registration reveals satisfactory completeness and efficiency of a computerized cancer registration system. J Biomed Inform 41: 24–32. PMID:17452020
22. Layfield LJ, Gupta D, Mooney EE (2000) Assessment of Tissue Estrogen and Progesterone Receptor Levels: A Survey of Current Practice, Techniques, and Quantitation Methods. Breast J 6: 189–96. PMID:11348363
23. Wolff AC, Hammond ME, Schwartz JN, Hagerty KL, Allred DC, Cote RJ, et al. (2007) American Society of Clinical Oncology/College of American Pathologists guideline recommendations for human epider-mal growth factor receptor 2 testing in breast cancer. Arch Pathol Lab Med 131: 18–43. doi:10.1043/
1543-2165(2007)131[18:ASOCCO]2.0.CO;2PMID:19548375
24. Harris JA, Benedict FG (1918) A Biometric Study of Human Basal Metabolism. Proc Natl Acad Sci U S A 4: 370–3. PMID:16576330
25. Salvini S, Parpinel M, Gnagnarella P, Maisonneuve P, Turrini A. Banca dati di composizione degli ali-menti per studi epidemiologici in Italia. Milano: 1998.
26. Grambsch PTT (1994) Proportional hazards tests and diagnostics based on weighted residuals. Bio-metrika 81: 515–26.
27. Lunn M, McNeil D (1995) Applying Cox regression to competing risks. Biometrics 51: 524–32. PMID:
7662841
28. Duffy CM, Assaf A, Cyr M, Burkholder G, Coccio E, Rohan T, et al. (2009) Alcohol and folate intake and breast cancer risk in the WHI Observational Study. Breast Cancer Res Treat 116: 551–62. doi:10.
1007/s10549-008-0167-2PMID:18785003
29. Ericson U, Sonestedt E, Gullberg B, Olsson H, Wirfalt E (2007) High folate intake is associated with lower breast cancer incidence in postmenopausal women in the Malmo Diet and Cancer cohort. Am J Clin Nutr 86: 434–43. PMID:17684216
30. Larsson SC, Bergkvist L, Wolk A (2008) Folate intake and risk of breast cancer by estrogen and proges-terone receptor status in a Swedish cohort. Cancer Epidemiol Biomarkers Prev 17: 3444–9. doi:10.
1158/1055-9965.EPI-08-0692PMID:19064560
31. Rohan TE, Jain MG, Howe GR, Miller AB (2000) Dietary folate consumption and breast cancer risk. J Natl Cancer Inst 92: 266–9. PMID:10655445
32. Sellers TA, Kushi LH, Cerhan JR, Vierkant RA, Gapstur SM, Vachon CM, et al. (2001) Dietary folate intake, alcohol, and risk of breast cancer in a prospective study of postmenopausal women. Epidemiol-ogy 12: 420–8. PMID:11416780
33. Lajous M, Romieu I, Sabia S, Boutron-Ruault MC, Clavel-Chapelon F (2006) Folate, vitamin B12 and postmenopausal breast cancer in a prospective study of French women. Cancer Causes Control 17: 1209–13. PMID:17006726
34. De Batlle J (2014) Dietary folate and breast cancer risk:European Prospective Investigation into Cancer and Nutrition. J Natl Cancer Inst 107: Dju367. doi:10.1093/jnci/dju367PMID:25505228
35. Larsson SC, Giovannucci E, Wolk A (2007) Folate and risk of breast cancer: a meta-analysis. J Natl Cancer Inst 99: 64–76. PMID:17202114
36. Sellers TA, Vierkant RA, Cerhan JR, Gapstur SM, Vachon CM, Olson JE, et al. (2002) Interaction of die-tary folate intake, alcohol, and risk of hormone receptor-defined breast cancer in a prospective study of postmenopausal women. Cancer Epidemiol Biomarkers Prev 11: 1104–7. PMID:12376515
38. Shrubsole MJ, Shu XO, Li HL, Cai H, Yang G, Gao YT, et al. (2011) Dietary B vitamin and methionine intakes and breast cancer risk among Chinese women. Am J Epidemiol 173: 1171–82. doi:10.1093/
aje/kwq491PMID:21447479
39. Roswall N, Olsen A, Christensen J, Dragsted LO, Overvad K, Tjonneland A (2010) Micronutrient intake and breast cancer characteristics among postmenopausal women. Eur J Cancer Prev 19: 360–5. PMID:20698054
40. Mason JB, Levesque T (1996) Folate: effects on carcinogenesis and the potential for cancer chemopre-vention. Oncology (Williston Park) 10: 1727–3.
41. Kim YI (2004) Folate and DNA methylation: a mechanistic link between folate deficiency and colorectal cancer? Cancer Epidemiol Biomarkers Prev 13: 511–9. PMID:15066913
42. Kim YI (2007) Folate and colorectal cancer: an evidence-based critical review. Mol Nutr Food Res 51: 267–92. PMID:17295418
43. Ferguson AT, Lapidus RG, Baylin SB, Davidson NE (1995) Demethylation of the estrogen receptor gene in estrogen receptor-negative breast cancer cells can reactivate estrogen receptor gene expres-sion. Cancer Res 55: 2279–83. PMID:7538900
44. Lapidus RG, Nass SJ, Butash KA, Parl FF, Weitzman SA, Graff JG, et al. (1998) Mapping of ER gene CpG island methylation-specific polymerase chain reaction. Cancer Res 58: 2515–9. PMID:9635570
45. Ottaviano YL, Issa JP, Parl FF, Smith HS, Baylin SB, Davidson NE (1994) Methylation of the estrogen receptor gene CpG island marks loss of estrogen receptor expression in human breast cancer cells. Cancer Res 54: 2552–5. PMID:8168078
46. Piva R, Rimondi AP, Hanau S, Maestri I, Alvisi A, Kumar VL, et al. (1990) Different methylation of oes-trogen receptor DNA in human breast carcinomas with and without oesoes-trogen receptor. Br J Cancer 61: 270–5. PMID:2155643
47. Lapidus RG, Ferguson AT, Ottaviano YL, Parl FF, Smith HS, Weitzman SA, et al. (1996) Methylation of estrogen and progesterone receptor gene 5' CpG islands correlates with lack of estrogen and proges-terone receptor gene expression in breast tumors. Clin Cancer Res 2: 805–10. PMID:9816234
48. Mason JB (2003) Biomarkers of nutrient exposure and status in one-carbon (methyl) metabolism. J Nutr 133 Suppl 3: 941S–7S. PMID:12612180
49. McCormick DB (1989) Two interconnected B vitamins: riboflavin and pyridoxine. Physiol Rev 69: 1170–98. PMID:2678166
50. Lin J, Lee IM, Cook NR, Selhub J, Manson JE, Buring JE, et al. (2008) Plasma folate, vitamin B-6, vita-min B-12, and risk of breast cancer in women. Am J Clin Nutr 87: 734–43. PMID:18326613
51. Bassett JK, Baglietto L, Hodge AM, Severi G, Hopper JL, English DR, et al. (2013) Dietary intake of B vitamins and methionine and breast cancer risk. Cancer Causes Control 24: 1555–63. doi:10.1007/
s10552-013-0232-yPMID:23686442
52. Coussens LM, Werb Z (2002) Inflammation and cancer. Nature 420: 860–7. PMID:12490959
53. Vona-Davis L, Rose DP (2007) Adipokines as endocrine, paracrine, and autocrine factors in breast cancer risk and progression. Endocr Relat Cancer 14: 189–206. PMID:17639037
54. Doke S, Inagaki N, Hayakawa T, Tsuge H (1998) Effects of vitamin B6 deficiency on cytokine levels and lymphocytes in mice. Biosci Biotechnol Biochem 62: 1008–10. PMID:9648235
55. Kwak HK, Hansen CM, Leklem JE, Hardin K, Shultz TD (2002) Improved vitamin B-6 status is positively related to lymphocyte proliferation in young women consuming a controlled diet. J Nutr 132: 3308–13. PMID:12421844
56. Paul L, Ueland PM, Selhub J (2013) Mechanistic perspective on the relationship between pyridoxal 5'-phosphate and inflammation. Nutr Rev 71: 239–44. doi:10.1111/nure.12014PMID:23550784
57. Liu S, Miriyala S, Keaton MA, Jordan CT, Wiedl C, Clair DK, et al. (2014) Metabolic effects of acute thia-mine depletion are reversed by rapamycin in breast and leukemia cells. PLoS One 9: e85702. doi:10. 1371/journal.pone.0085702PMID:24454921
58. Zastre JA, Sweet RL, Hanberry BS, Ye S (2013) Linking vitamin B1 with cancer cell metabolism. Can-cer Metab 1: 16. doi:10.1186/2049-3002-1-16PMID:24280319