Identification of genes associated with intramuscular fat deposition and
composition in Nellore breed
Aline Silva Mello Cesar
Thesis presented to obtain the degree of Doctor in Science. Area: Animal Science and Pastures
Aline Silva Mello Cesar Animal Scientist
Identification of genes associated with intramuscular fat deposition and composition in Nellore breed
Advisor:
Prof. Dr. LUIZ LEHMANN COUTINHO
Thesis presented to obtain the degree of Doctor in Science. Area: Animal Science and Pastures
DadosInternacionais de Catalogação na Publicação DIVISÃO DE BIBLIOTECA - DIBD/ESALQ/USP
Cesar, Aline Silva Mello
Identification of genes associated with intramuscular fat deposition and composition in Nellore breed / Aline Silva Mello Cesar. - - Piracicaba, 2014.
99 p: il.
Tese (Doutorado) - - Escola Superior de Agricultura “Luiz de Queiroz”, 2014.
1. Expressão gênica 2. Gordura 3. Gene posicional 4. GWAS 5. SNP I. Título
CDD 636.291
C421i
DEDICATION
ACKNOWLEDGMENTS
I would like to express my sincere gratitude to my advisor, Dr. Luiz Coutinho for his guidance, help, professionalism, dedication, commitment and friendship. I am grateful for the opportunity to work in his research team.
I would like to thank Dra. Luciana Regitano at EMBRAPA Southeast-Cattle Research Center for her suggestions, help, criticism during the conception and development of my experimental project.
To University of São Paulo - "Luiz de Queiroz" College of Agriculture (USP /ESALQ) for opportunity and support. To the Department of Animal Science for the teachings, opportunity and support provided by faculty and staff. To fellow students in the Department of Animal Science at ESALQ/USP that I had opportunity to became friends.
To the São Paulo State Research Foundation (FAPESP) for a Doctoral scholarship (Process 2011/00005-7) and a Research Abroad Internship (Process 2012/02383-1), which supports my Doctoral studies at University of São Paulo and and Iowa State University.
To all researchers and staffs involved in BifeQuali project (Macroprograma 1, 01/2005) of EMBRAPA for financial support, collaborative efforts, infrastructure, teachings and opportunity.
To Dra. Marisa d’Darce for playing a very important role in my learning about food
lipid chemistry, extraction, quality and nutritional importance.
To James Koltes and Eric Fritz-Waters for their constant help, teachings, patience and friendship during my training at Iowa State University.
To Dr. Dante Lanna and Maria Etchegaray at Animal Nutrition and Growth Laboratory at ESALQ for help and infrastructure to fatty acid analysis. To Dr. Gilberto Batista de Souza at Laboratory of Animal Nutrition at EMBRAPA Southeast-Cattle Research Center for help and infrastructure to ether extract analysis.
To Dr. Dorian Garrick and his group for their teachings, suggestions and support to genome-wide association analysis, also for allowing me to sit in his graduate classes during my research internship.
To my parents, Cesar and Madalena, my sisters Andréa, Alessandra e Andrezza, my brother, Alexandre, my nieces and nephews, and my brothers and sister-in-law for their love.
To my family-friends at Animal Biotechnology Laboratory, which I had opportunity to know and work together during my Doctoral studies. Thanks for your friendship, reception, confidence and support on the difficult and happy moments.
To all my professors for playing an important role in my personal and professional life, in special Eidiomar Angelucci, Viviane de Abreu Nunes Cerqueira Dantas, Flávio Vieira Meirelles, Paola Mariani, Robson Carlos Antunes, James Reecy and Luiz Lehmann Coutinho.
To God as an expression of my gratitude.
CONTENTS
RESUMO ... 9
ABSTRACT ... 11
1 INTRODUCTION ... 13
1.1 Hypothesis ... 15
1.2 Objectives ... 15
References ... 16
2 GENOME-WIDE ASSOCIATION STUDY FOR INTRAMUSCULAR FAT DEPOSITION AND COMPOSITION IN NELLORE CATTLE ... 19
Abstract ... 19
2.1 Introduction ... 19
2.2 Materials and Methods ... 20
2.2.1 Animals and Phenotypes ... 21
2.2.2 DNA Extraction and Genotypic Data ... 22
2.2.3 Descriptive Statistics and Heritability ... 22
2.2.4 Genome Wide Association Study ... 23
2.3 Results and discussion ... 25
2.3.1 Intramuscular fat deposition and composition ... 25
2.3.2 Heritability ... 26
2.3.3 Genome wide association studies and genomic regions identified ... 28
2.3.4 Saturated fatty acids ... 28
2.3.5 Monounsaturated fatty acids ... 37
2.3.6 Polyunsaturated fatty acids ... 41
2.4 Conclusion ... 44
References ... 44
3 PUTATIVE REGULATORY FACTORS INVOLVED IN MOLECULAR MECHANISMS OF INTRAMUSCULAR FAT DEPOSITION IN NELLORE STEERS ... 53
Abstract ... 53
3.1 Introduction ... 53
3.2 Materials and Methods ... 55
3.2.1 Ethics statement ... 55
3.2.4 RNA extraction, quality analysis, library preparation and sequencing ... 56
3.2.5 Quality control and read alignment ... 57
3.2.6 Identification of differential expressed genes and pathway analysis ... 57
3.2.7 PCIT and differential hubbing network analysis ... 58
3.2.8 Regulatory Impact Factor (RIF) network co-expression analysis and phenotypic impact factor (PIF) scores ... 58
3.3 Results ... 58
3.3.1 Phenotypic groups, mapping and annotation ... 58
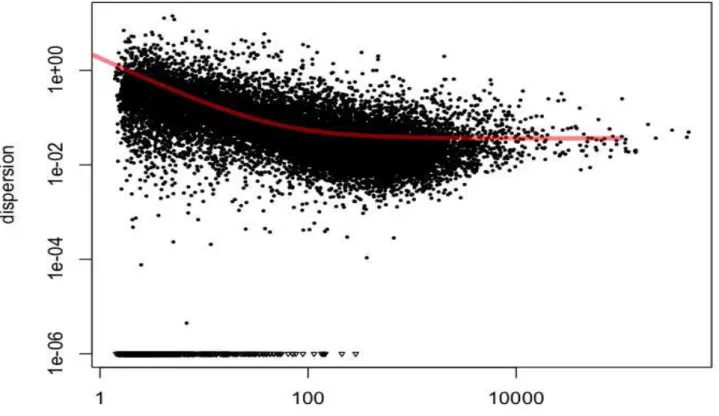
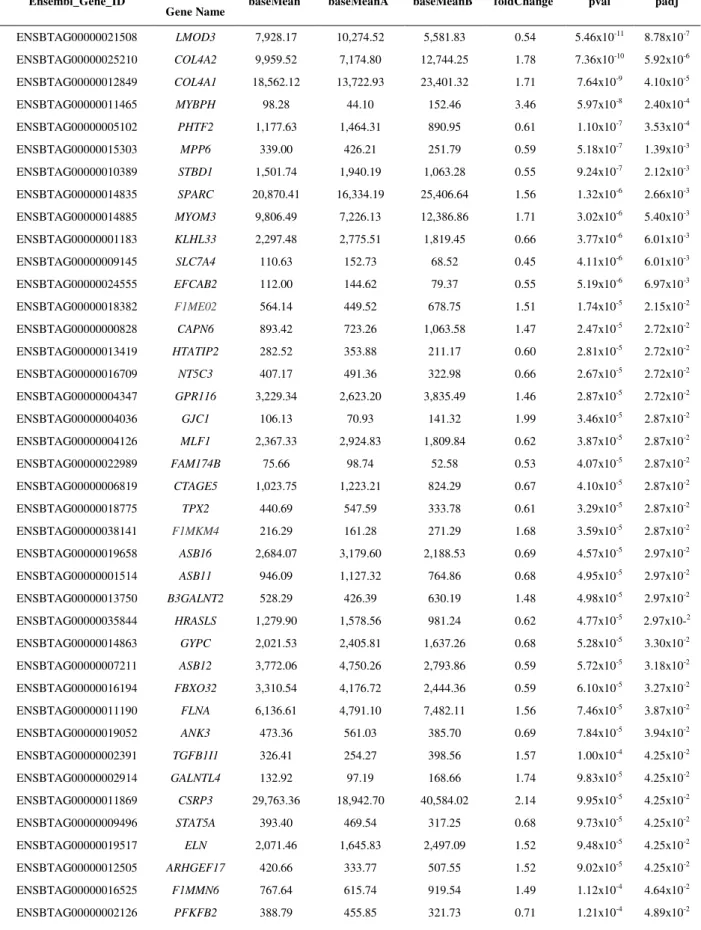
3.3.2 Differential expression analysis and differentially expressed genes ... 59
3.3.3 Functional enrichment and pathways ... 64
3.4 Discussion ... 85
3.5 Conclusion ... 92
RESUMO
Identificação de genes associados à deposição e composição da gordura intramuscular em bovinos da raça Nelore
A quantidade e composição da gordura intramuscular (GIM) pode influenciar as características sensoriais, o valor nutricional da carne bovina e na saúde humana. O perfil dos seus ácidos graxos pode se apresentar de maneira diversificada conforme a genética, o manejo e a nutrição dos animais de origem. A deposição e composição da gordura são determinadas por muitos genes que participam direta ou indiretamente da adipogênese e do metabolismo lipídico. A seleção de animais com teor e composição de gordura adequado para o consumidor é complexa pela difícil mensuração destas características, pela moderada herdabilidade e pelo desconhecimento dos genes envolvidos. Na última década, presenciamos um grande avanço na área da genômica bovina que resultou no sequenciamento completo do genoma e no desenvolvimento de chips de alta densidade de SNP. Este progresso científico, aliado aos avanços tecnológicos de equipamentos, resultou na identificação de genes responsáveis pela determinação de características quantitativas de interesse científico e comercial na bovinocultura. Este estudo teve como objetivo identificar e caracterizar genes associados à deposição e composição de gordura intramuscular em bovinos Nelore. Para este fim foi conduzido um estudo de associação genômica (Genome-wide association studies, GWAS) para identificar regiões genômicas associadas às características de interesse e identificar genes candidatos posicionais. Para o estudo de expressão diferencial foi conduzido um estudo do transcriptoma a partir do sequenciamento de RNA total (RNA-Seq) do músculo Longissimus dorsi. Foram utilizados 386 Nelores para a avaliação do teor de lipídeos total e perfil de ácidos graxos do músculo LD e, genotipagem com chip de alta densidade de SNP (Illumina SNP800 BeadChip). Um subconjunto de 14 animais, sendo sete animais de cada extremo para os valores genômicos estimados (GEBV) foi utilizado para o estudo de RNA-Seq. Foram encontradas 25 regiões genômicas (intervalos de 1 MB) associadas com deposição e composição de gordura intramuscular, as quais explicaram ≥ 1% da variância genética. Estas regiões foram identificadas nos cromossomos 2, 3, 6, 7, 8, 9, 10, 11, 12, 17, 26 e 27, muitas destas não foram previamente detectadas em outras raças. Nestas regiões foram identificados importantes genes e podem ajudar no entendimento da base genética envolvida na deposição e composição de gordura. As regiões genômicas e genes aqui identificados e apresentados contribuem para um melhor entendimento do controle genético da deposição e composição de gordura em gado de corte e ainda podem ser aplicados em programas de seleção genética de animais que produzam carne com qualidade e com perfil de gordura saudável ao homem.
ABSTRACT
Identification of genes associated with intramuscular fat deposition and composition in Nellore breed
The amount and composition of intramuscular fat (IMF) influence the sensory characteristics, nutritional value of beef and human health. The amount of fatty acid and its composition in beef varies by breed, nutrition, sex, age or carcass finishing level. The fat deposition and composition are determined by many genes that participate directly or indirectly in adipogenesis and lipid metabolism. The selection of animals with fat amount and composition suitable for the consumer is complex due to high cost of measurement, the moderate heritability and polygenic traits (many genes are involved with these traits). In the last decade with a great advance in bovine genomics resulted in the complete genome sequencing and the development of high-density chips of SNPs. This scientific advance jointly with technological improvement allowed the identification of genes responsible for important quantitative traits in cattle. This study aimed to identify and characterize genes associated with the deposition and composition of intramuscular fat in Nellore. A genome-wide association study (genome- genome-wide association studies, GWAS) was performed to identify genomic regions associated with traits of interest and positional candidate genes. A total RNA sequencing (RNA-Seq) analysis was applied to transcriptome study of Longissimus dorsi muscle. Three hundred and eighty six Nellore steers were used for the evaluation of lipid content and fatty acid profile of LD, and genotyping with high-density chip SNP (SNP800 Illumina BeadChip). A subset of 14 animals, seven animals for each extremes of genomic estimated values (GEBV) were used to RNA-Seq analysis. Twenty-five genomic regions (1 MB window) were associated with the deposition and composition of intramuscular fat, which explained ≥ 1 % of the genetic variance. These regions were identified on chromosomes 2, 3, 6, 7, 8, 9, 10, 11, 12, 17, 26 and 27, many of these have not previously been found in other breeds and in these regions important genes were identified. Genomic regions and genes identified and presented here should be contribute to a better understanding of the genetic control of deposition and fat composition in beef cattle, and can be applied in breeding programs for animals that produce a quality and healthy beef to human consumers.
1 INTRODUCTION
The amount of intramuscular fat (IMF) affects the sensory characteristics and nutritional value of meat. Many consumers associate this fat with coronary heart disease, diabetes and obesity, due to the presence of cholesterol, the high concentration of saturated fatty acids and the low concentration of polyunsaturated fatty acids present in beef. However, consumption of fatty acids is necessary for human nutrition (LABORDE et al., 2001).
The fat composition influences the qualities of meat, on the sense that the saturated fats containing long-chain fatty acids that give the solid consistency and upon cooling affect the palatability. On the other hand, the unsaturated fatty acid can be easily oxidized affecting the meat flavor and odor (CASEY; VAN NIEKERK; WEBB, 2003).
The beef, as well as other animal species, is of great importance for human nutrition because it is a dense food (very low-calorie food) and high nutritional value. Meets the nutritional requirements of all ages, from children to seniors, it is a rich source of protein (essential amino acids), iron, zinc, B vitamins and essential polyunsaturated fatty acids such as linoleic and linolenic acid (LUCHIARI FILHO, 2000). Studies have shown that beef fat has a high concentration of monounsaturated fatty acids (MUFA), whose melting point is low and can reduce the concentration of bad cholesterol (LDL) in blood circulation (JAKOBSEN et al., 2008). The beef has about 48% saturated fat and 52% unsaturated fat, and is low in essential fatty acids (MOREIRA et al., 2003).
An adult animal gets to have 25-30% of your body weight compound by fats, which are very important for the proper functioning of the organism and maintaining homeostasis. They are part of cell membranes, of some hormones and vitamins; can function as cofactors enzymatic; and still are important forms of energy storage (LABORDE et al., 2001).
The set of isomers of linoleic fatty acid called conjugated linoleic acid (CLA) found in milk and meat is associated with reduced body fat, protection against cancer, fight against LDL cholesterol and control diabetes (ARITA et al., 1999). Saturated fatty acids are deposited as excess triglycerides and polyunsaturated fatty acids, specifically omega-3 phospholipids are deposited mostly as structural (PONNAMPALAM et al., 2001).
of atherogenesis and thrombosis.
Brazil has the largest commercial cattle herd in the world with over 193 million head in 2013, 40 million head slaughtered and from a total of 9,600 tonnes (UNITED STATES DEPARTMENT OF AGRICULTURE - USDA, 2013) of carcass equivalent 1,694 tonnes were exported presenting income of US$ 4,835,129 (FNP, 2013).
In recent years the countries of the European Union (EU) became the largest importers of Brazilian beef, reaching a total of 21% of exports of this product in Brazil. Only Italy reported an increase of almost 45% in imports, which rose from 5,981 tons in 2008 to 13,276 tons of frozen boneless beef in 2009, according to FNP (2013).
In Brazil, cutting the animals are mostly Nellore (Bos indicus from Zebu origin) or crossbreeds of this breed. These animals are well adapted to tropical conditions in Brazil and are resistant to heat and parasites. The zebu animals when slaughtered in earlier ages, in relation to taurine animals, present more homogeneous distribution of subcutaneous fat (coverage) and lower amount of intramuscular fat (LUCHIARI FILHO; MOURÃO, 2006). For some markets in Continental Europe the least amount of fat in the carcass is desirable, but for others, like Asia and the UK this feature makes Brazilian beef with lower market value.
The adipogenesis (pre-adipocyte differentiation into adipocytes) and lipogenesis (fat synthesis) are controlled by transcription factors and enzymes participating in lipid metabolism. Some genes such as the acetyl coenzimaA carboxylase (ACC), esteroil coenzimaA desaturase (SCD), fatty acid synthase (FAS), adiponectin (ADIPOQ) binding protein and fatty acid (FABP) (HOASHI et al., 2008) were associated with amount of body fat deposited, the profile of fatty acids synthesized and the cell differentiation of adipocytes.
Breeding programs around the world for many years, selected parents (bulls or cows) of the next generation only by phenotypes, and achieved much success. However, for some traits with low heritability (tenderness, marbling, etc.) phenotypic analysis possible only in adult animals (disease resistance, fertility, production efficiency, quality and quantity of milk) the annual genetic gain becomes limited and the selection became a challenge for improving programs (SORIA; CORVA, 2004).
With advances in biotechnology (DNA and RNA extraction, Polymerase Chain Reaction (PCR), gene expression chip, microsatellites and, more recently, high-density chips for single nucleotide polymorphisms (SNPs - single nucleotide polymorphisms) that allow the study of genome-wide association (GWAS) programs for animal breeding began to study the expression of genes of interest (OROZCO et al., 2010).
markers available in unrelated individuals who possess a condition phenotypic (eg: deposition of intramuscular fat) of interest, to identify markers associated with this phenotype, 500kb to 1000kb regions are involved in GWAS and are analyzed by statistical tools and software available and appropriate for each situation (HAYES et al., 2009).
The use of panels of high-density SNPs in animal breeding programs allows the detection of significant QTLs for traits of economic importance with greater accuracy, allowing an analysis with multiple markers. These panels can be used for genomic selection from adjacent markers and to estimate the effects of these markers or haplotypes over the entire genome (HAYES et al., 2009). This enables getting all QTLs that contribute to genetic variation of a characteristic of interest.
Other interesting molecular technology is RNA-Seq that has been used in livestock to provide insight into the biological mechanisms relevant to economically important traits. For example, recent RNA-Seq studies of pigs with extreme IMF phenotypes have defined differentially expressed genes (DEG) and potential gene networks important in lipid and fatty acid metabolism in the liver (RAMAYO-CALDAS et al., 2012). In beef cattle, DEG were identified in backfat thickness from Bos taurus crossed steers, revealing that expression pattern depends on the genetic background (OLSON et al., 2012).
These tools of molecular biology allow a better understanding of biological processes such as deposition of IMF in animals, revealing regions of the genome, putative candidate genes and biological pathways responsible for this and other traits of economic interest to the cattle industry nationally and globally.
1.1 Hypothesis
This study was carried out with the purpose that the high-density SNP genotyping and the next-generation mRNA sequencing technologies may allow the genome-wide study, the identification of putative candidate genes and the detection of biological pathways involved with deposition and composition of intramuscular fat, specifically for Nellore steers.
1.2 Objectives
addition, identify differentially expressed genes (DEG) in the Longissimus dorsi (LD) muscle in steers of the Nellore breed and biological pathways associated with lipid metabolism.
References
ARITA, Y.; KIHARA, S.; OUCHI, N.; TAKAHASHI, M.; MAEDA, K.; MIYAGAWA, J.; HOTTA, K.; SHIMOMURA, I.; NAKAMURA, T.; MIYAOKA, K.; KURIYAMA, H.; NISHIDA, M.; YAMASHITA, S.; OKUBO, K.; MATSUBARA, K.; MURAGUCHI, M.; OHMOTO, Y.; FUNAHASHI, T.; MATSUZAWA, Y. Paradoxical decrease of an adipose-specific protein, adiponectin, in obesity. Biochemical and Biophysical Research
Communications, Orlando,v. 257, n. 1, p. 79-83, 1999.
FNP CONSULTORIA & COMÉRCIO. ANUALPEC 2013: anuário da pecuária brasileira. São Paulo, 2013. 360 p.
HAYES, B.J.; BOWMAN, P.J.; CHAMBERLAIN, A.C.; VERBYLA, K.; GODDARD, M.E. Accuracy of genomic breeding values in multi-breed dairy cattle populations. Genetics Seletion Evolution, Paris,v. 41, n. 51, 2009. Available in:
<http://www.gsejournal.org/content/pdf/1297-9686-41-51.pdf>. Accessed in: 22 oct. 2013.
HOASHI, S.; HINENOYA, T.; TANAKA, A.; OHSAKI, H.; SASAZAKI, S.; TANIGUCHI, M.; OYAMA, K.; MUKAI, F.; MANNEN, H.Association between fatty acid compositions and genotypes of FABP4 and LXR-alpha in Japanese Black cattle. BMC Genetics, London, v. 9, n. 84, 2008. Available in: < http://www.biomedcentral.com/content/pdf/1471-2156-9-84.pdf>. Accessed on: 14 sept. 2013.
JAKOBSEN, M.U.; OVERVAD, K.; DYERBERG, J.; HEITMANN, B.L. Intake of ruminant trans fatty acids and risk of coronary heart disease. International Journal of Epidemiology, Oxford, v. 37, n. 1, p. 173-182, 2008.
LABORDE, F.L.; MANDELL, I.B.; TOSH, J.J.; WILTON, J.W.; BUCHANAN-SMITH, J. G. Breed effects on growth performance, carcass characteristics, fatty acid composition, and palatability attributes in finishing steers. Journal of Animal Science, Savoy,v. 79, n. 2, p. 355-365, 2001.
LUCHIARI FILHO, A. Pecuária da carne bovina. Nova Odessa: O Autor, 2000. 147 p.
LUCHIARI FILHO, A.; MOURÃO, G.B. Melhoramento, raças e seus cruzamentos na pecuária de corte brasileira. Pirassununga: A. Luchiari Filho, 2006. 142 p.
MOREIRA, F.B.; DE SOUZA, N.E.; MATSUSHITA, M.; DO PRADO, I.N.; DO
NASCIMENTO, W.G.Evaluation of carcass characteristics and meat chemical composition of Bos indicus and Bos indicus x Bos taurus crossbred steers finished en pasture systems.
Brazilian Archives of Biology and Technology, Londrina, v. 46, p. 607-614, 2003.
PETIT, H.V. Digestion, milk production, milk composition, and blood composition of dairy cows fed whole flaxseed. Journal of Dairy Science, Champaign, v. 85, p. 1482-1490, 2002.
PONNAMPALAM, E.N.; SINCLAIR, A.J.; EGAN, A.R.; BLAKELEY, S.J.; LI, D.; LEURY, B.J. Effect of dietary modification of muscle long chain n-3 fatty acid on plasma insulin and lipid metabolites, carcass traits, and fat deposition in lambs. Journal of Animal Science, Savoy, v. 79, p. 895-903, 2001.
RULE, D.C.; BROUGHTON, K.S.; SHELLITO, S.M.; MAIORANO, G. Comparison of muscle fatty acid profiles and cholesterol concentrations of bison, beef cattle, elk, and chicken. Journal of Animal Science, Savoy, v. 80, p. 1202-1211, 2002.
TAPIERO, H.; BA, G.N.; COUVREUR, P.; TEW, K.D. Polyunsaturated fatty acids (PUFA) and eicosanoids in human health and pathologies. Biomedicine and Pharmacotherapy, Paris, v. 56, n. 5, p. 215-222, 2002.
2 GENOME-WIDE ASSOCIATION STUDY FOR INTRAMUSCULAR FAT DEPOSITION AND COMPOSITION IN NELLORE CATTLE
Abstract
Meat from Bos taurus and Bos indicus breeds are an important source of nutrients for humans and intramuscular fat (IMF) influences its flavor, nutritional value and impacts human health. Human consumption of fat that contains high levels of monounsaturated fatty acids (MUFA) can reduce the concentration of undesirable cholesterol (LDL) in circulating blood. Different feeding practices and genetic variation within and between breeds influences the amount of IMF and fatty acid (FA) composition in meat. However, it is difficult and costly to determine fatty acid composition, which has precluded beef cattle breeding programs from selecting for a healthier fatty acid profile. In this study, we employed a high-density single nucleotide polymorphism (SNP) chip to genotype 386 Nellore steers, a Bos indicus breed and, a Bayesian approach to identify genomic regions and putative candidate genes that could be involved with deposition and composition of IMF. Twenty-three genomic regions (1-Mb SNP windows) associated with IMF deposition and FA composition that each explains
≥ 1% of the genetic variance were identified on chromosomes 2, 3, 6, 7, 8, 9, 10, 11, 12, 17, 26 and 27. Many of these regions were not previously detected in other breeds. The genes present in these regions were identified and some can help explain the genetic basis of deposition and composition of fat in cattle. The genomic regions and genes identified contribute to a better understanding of the genetic control of fatty acid deposition and can lead to DNA-based selection strategies to improve meat quality for human consumption.
Keywords:Fatty acid; GWAS; Bos indicus; Beef; Positional candidate gene
2.1 Introduction
Many consumers associate consumption of fat from beef with coronary heart disease, diabetes and obesity, due to the presence of cholesterol, high concentration of saturated fatty acids (SFA), and low concentration of polyunsaturated fatty acids (PUFA). However, consumption of fatty acids is necessary for human nutrition (LABORDE et al., 2001). Beef has high nutritional value from children to seniors, is a rich source of protein (essential amino acids), iron, zinc, B vitamins and essential polyunsaturated fatty acids such as linoleic and linolenic acid (MCNEILL; VAN ELSWYK, 2012). Beef fat also has a high concentration of monounsaturated fatty acids (MUFA), whose melting point is low and can reduce the concentration of bad cholesterol (LDL) in blood circulation (JAKOBSEN et al., 2008).
progress in the production of healthier beef.
The development of high-density bovine genotyping (MATUKUMALLI et al., 2009) and their use in genome-wide association studies (GWAS) have allowed identification of genomic regions associated with phenotypes of interest. The technique of GWAS exploits differences in allele frequencies of thousands of polymorphic markers available in unrelated individuals who possess different phenotypes (for example, deposition and composition of intramuscular fat), and leads to the identification of markers associated with a given phenotype (HAYES et al., 2009). Bayesian approaches have been applied to GWAS to detect significant quantitative trait loci (QTL) for traits of economic importance. One such approach uses multiple regression (evaluating marker effects simultaneously), treating marker effects as random to reduce overestimation bias of significant QTL effects, generating the actual posterior distribution of QTL effects given the data which can provide richer inference than can be obtained by simply constructing p-values as well as providing an alternative to the use of p-values to avoid false positives (PETERS et al., 2012; GARRICK; FERNANDO, 2013; KIZILKAYAet al., 2013).
Brazilian beef is exported and consumed in more than 100 countries (PRAKASH; STIGLER, 2012). Purebred and crossbred Nellore cattle, which are of Bos indicus descent, are the predominant source of beef in Brazil. Previous research has documented that muscle and fat tissues from Bos indicus cattle develop in a different manner than in Bos taurus breeds (PICARD et al., 2002; LEHNERT et al., 2007; DU et al., 2013; DUARTE et al., 2013). However, studies documenting the genetics of fatty acid deposition and composition in Bos
indicus breeds are limited.
In this study we performed a GWAS using high-density single nucleotide polymorphism (SNP) chips (770k) and Bayesian methods (Bayes B) to identify genomic regions associated with fat deposition and fatty acid composition (FA) in Nellore beef.
2.2 Materials and Methods
2.2.1 Animals and Phenotypes
Nellore steers (386) bred in the Brazilian Agricultural Research Corporation (EMBRAPA/Brazil) experimental breeding herd between 2009 and 2011 were available for this study. Steers were sired by 34 unrelated sires, and were selected to represent the main genealogies used in Brazil according to the National Summary of Nellore produced by the Brazilian Association of Zebu Breeders (ABCZ) and National Research Center for Beef Cattle. Animals were raised in feedlots under identical nutrition and handling conditions until slaughter at an average age of 25 months (TIZIOTO et al., 2012). Steaks (2.54 cm thick) from the Longissimus dorsi muscle between the 12th and 13th ribs were collected 24 hours after slaughter.
Muscle samples (~100 g) were lyophilized and ground for IMF and FA analysis. The IMF was obtained using an Ankom XT20 extractor as described (AOCS, 2000). FA analysis was conducted as described by Hara and Radin (1978), except the hexane to propanol ratio was increased to 3:2. Approximately 4 g of LD muscle was lyophilized, ground in liquid nitrogen, mixed with 28 mL of hexane/propanol (3:2 vol/vol) and homogenized for 1 min. Samples were vacuum filtered and 12 ml sodium sulfate (67 mg mL− 1) solution was added and agitated for 30 s. The supernatant was transferred to a tube with 2 g of sodium sulfate and insufflated with N2, after which the tube was sealed and incubated at room temperature for
30 min. Subsequently, the liquid was transferred to 10 mL test tube, insufflated with N2,
sealed and kept at − 20 °C until dry with N2 for methylation. The extracted lipids were
hydrolyzed and methylated as described by Christie (1983), except that hexane and methyl acetate were used instead of hexane:diethyl ether:formic acid (90:10:1). Around 40 mg of lipids were transferred to a tube containing 2 mL of hexane. Subsequently, 40 μL of methyl
oven temperature was held at 70 °C for 4 min, then increased to 170 °C at a rate of 13 °C min− 1, and subsequently increased to 250 °C at a rate of 35 °C min− 1, and held at 250 °C for 5 min. The gas fluxes were 1.8 mL min− 1 for carrier gas (He), 45 mL min− 1 for make-up gas (N2), 40 mL min− 1 for hydrogen, and 450 mL min− 1 for synthetic flame gas. One µL sample
was analyzed. Injector and detector temperatures were 250 and 300 °C, respectively. Fatty acids were identified by comparison of retention time of methyl esters of the samples with standards of fatty acids butter reference BCR-CRM 164, Anhydrous Milk Fat-Producer (BCR Institute for Materials and Reference Measurements) and also with commercial standard for 37 fatty acids Supelco TM Component FAME Mix (cat 18919, Supelco, Bellefonte, PA). The nomenclature of fatty acids follow IUPAC Compendium (MCNAUGHT; WILKINSON, 1997). Fatty acids were quantified by normalizing the area under the curve of methyl esters using Chromquest 4.1 software (Thermo Electron, Italy). Fatty acids were expressed as a weight percentage (mg/mg). These analyses were performed at the Animal Nutrition and Growth Laboratory at ESALQ, Piracicaba, São Paulo, Brazil.
2.2.2 DNA Extraction and Genotypic Data
DNA was isolated from blood as described by Tizioto et al. (2012). Genotyping was performed at the Bovine Functional Genomics Laboratory ARS/USDA and Genomics Center at ESALQ, Piracicaba, São Paulo, Brazil using BovineHD 770k BeadChip (Infinium BeadChip, Illumina, San Diego, CA) according to manufacturer's protocol. Genotypes were obtained in Illumina A/B allele format and used to represent a covariate value at each locus coded as 0, 1, or 2, representing the number of B alleles. Missing genotypes, represented < 0.2% of genotypes and were replaced with the average covariate value at that locus. Initial visualization and data analysis was performed by GenomeStudio Data Analysis Software (ILLUMINA, 2012). The SNPs with call rate ≤ 95%, minor allele frequency (MAF) ≤ 5%,
those located on sex chromosomes and those not mapped in the Bos taurus UMD 3.1 assembly were removed. After filtering, a total of 449,363 SNP were utilized in GWAS.
2.2.3 Descriptive Statistics and Heritability
effects included contemporary group classes (animals with the same origin, birth year and slaughter date) and hot carcass weight as a covariate. Animal and residuals were fitted as random effects. Restricted maximum likelihood was used to estimate animal and residual variance components, heritability and standard error (SE) using ASREML software (GILMOUR et al., 2009). The model used in single-trait analyses of all traits was,
, where y is the vector of observations representing the trait of interest (dependent variable), X and Z are the design or incidence matrices for the vectors of fixed and random effects in b and u, respectively, and e was the vector of random residuals. The variance of vector u was G2m for the genomic analyses where G is the genomic relationship matrix derived from SNP markers using allele frequencies as suggested by VanRaden (2008), with
2
m being the marker-based additive genetic variance.
2.2.4 Genome Wide Association Study
Associations between SNP and phenotypes (IMF and FA) were obtained using Bayes B, which analyzed all SNP data simultaneously and assumed a different genetic variance for each SNP locus (MEUWISSEN; HAYES; GODDARD, 2001; HABIER et al., 2011). The prior genetic and residual variances were estimated using Bayes C (KIZILKAYA; FERNANDO; GARRICK, 2010), with being 0.9997. The model equation was:
∑
where y was the vector of the phenotypic values, Xwas the incidence matrix for fixed effects, b was the vector of fixed effects defined above, k was the number of SNP loci (449,363), aj
was the column vector representing the SNP covariate at locus j coded as the number of B
alleles, βj was the random substitution effect for locus j, which conditional on 2β was
assumed to be normally distributed N (0, 2β ) when δj = 1 but βj = 0 when δj = 0, with δj
being a random 0/1 variable indicating the absence (with probability π) or presence (with probability 1-π) of locus j in the model, and e was the vector of the random residual effects assumed normally distributed N (0, 2e ). The variance 2β (or 2e) was a priori assumed to
follow a scaled inverse Chi-square with vβ = 4 (or ve = 10) degrees of freedom and scale
parameter S2β (or S2e). The scale parameter for markers was derived as a function of the
frequency and number of SNP assumed to have nonzero effects based on parameter being 0.9997. This procedure used GenSel software (GARRICK; FERNANDO, 2013) to obtain the posterior distributions of SNP effects using Markov chain Monte Carlo (MCMC). This comprised a burn-in period of 1,000 iterations from which results were discarded, followed by 40,000 iterations from which results were accumulated to obtain the posterior mean effect of
each SNP. In the Bayesian variable selection multiple-regression models with = 0.9997 about 100-150 SNP markers were fitted simultaneously in each MCMC iteration. Inference of associations in these multiple-regression models was based on 1-Mb genomic windows rather than on single markers (ONTERU et al., 2011; GARRICK; FERNANDO, 2013). Genomic windows were constructed from the chromosome and base-pair positions denoted in the marker map file (GARRICK; FERNANDO, 2013) based on UMD3.1 bovine assembly.
The SNP effects from every 40th post burn in iteration were used to obtain samples from the posterior distribution of the proportion of variance accounted for by each window from 1,000 MCMC samples of genomic merit for each animal following Onteru et al. (2011) and Peters et al. (PETERSet al., 2012). In the present study there were 2,527 1 Mb SNP windows across the 29 autosomes. The proportion of genetic variance explained by each window in any particular iteration was obtained by dividing the variance of window BV by the variance of whole genome BV in that iteration. The window BV was computed by multiplying the number of alleles that represent the SNP covariates for each consecutive SNP in a window by their sampled substitution effects in that iteration.
All traits were used for GWAS and genomic heritability estimate, but only the ones
with genomic heritability ≥ 0.10 were reported. Fatty acids were indexed as groups of
saturated, monounsaturated, polyunsaturated fatty acid, total of saturated fatty acid (SFA), total monounsaturated (MUFA), total of polyunsaturated (PUFA), total of omega 3 (n-3) and total of omega 6 (n-6). Genome windows with the highest posterior mean proportion of
genetic variance 1% were considered the most important regions associated with the traits, and were declared the most promising QTL regions.
2013). The functional classification of genes was done using DAVID (HUANG; SHERMAN; LEMPICKI, 2009 and BioGPS (WU et al., 2009) online annotation databases. Those genes reported to be involved in fatty acid and lipid metabolism were selected as positional candidate genes.
2.3 Results and discussion
2.3.1 Intramuscular fat deposition and composition
Modern consumers are concerned with their overall health and often desire to reduce their caloric intake. This has increased the demand for lean meat production with a healthier fatty acid composition, which would comprise a lower proportion of SFA and greater proportion of MUFA. The amount of fat deposition in meat represented as IMF (mean = 2.77%) reported in this feedlot-finished study was greater than for pasture-finished counterparts, as expected, but lower than normally observed in Continental and English breeds (CHARLES; JOHNSON, 1976; HOLLOWAY et al., 1990; HUERTA-LEIDENZ et al., 1996). Despite of that, IMF observed in this work was within limits of reasonable amount of fat to assure acceptable quality levels for consumers according to Nuernberg et al. (2005).
The fatty acid composition observed for the most abundant FAs were: C14:0 at 3.54%, C16:0 at 26.69%, C18:0 at 14.98%, C16:1 cis-9 at 3.31%, C18:0 at 14.98%, C18:1 cis-9 at 37.46%, C18:2 cis-9 cis 12 at 1.60%, SFA at 47.23%, MUFA at 48.34%, and PUFA at 2.87% (Table 1). The proportion of MUFA was higher than SFA, and oleic acid (C18:1 cis-9) was the most abundant single fatty acid (37.46%).The FA composition presented in this work is similar to those reported in the literature for Nellore or other Bos indicus breeds (PRADO et al., 2003; PADRE et al., 2006; BRESSAN et al., 2011). This population also presented, in relation to Bos taurus breeds, average composition of fatty acids which is in agreement with reports from the USDA (2010). However, in this study a lower quantity of PUFA was observed in general, but not for C18:2 cis-9 trans-11, consequently a lower ratio of PUFA/SFA (6.08%). Similar MUFA and PUFA results have been reported in previous studies that utilized Bos indicus steers (RUIZet al., 2005; BRESSANet al., 2011).
important for many biological functions. These fatty acids are also essential for synthesis of prostaglandins, thromboxane, leukotriene, hydroxyl fatty acids, and lipoxins that are involved with inflammatory response. Humans and other mammals can convert n-6 to n-3 using desaturation enzymes but this conversion is slow and there is competition between 6 and n-3 fatty acids for the desaturation enzymes (SIMOPOULOS, 2008).
2.3.2 Heritability
Descriptive statistics and heritabilities estimated using a genomic relationship G matrix are in Table 1. Heritabilities estimated in this study varied from low (<0.10 for C12:0, C16:0, C18:1 cis-11, C18:1 cis-12, C18:2 cis-9 trans-11, C20:1, C20:3 n-6, C20:4 n-6, C20:5 n-3 and AI, respectively) to moderate (up to 0.29 for IMF, C14:0, C14:1 cis-9, C16:1 cis-9, C17:0, C17:1, C18:0, C18:1 9, C18:1 trans-6, 7, 8, C18:1 trans-10, 11, 12, C18:2 cis 9 cis-12 n-6, C18:2 trans-11 cis-15, C18:3 n-6, C18:3 n-3, C22:5 n-3, C22:6 n-3, SFA, MUFA, PUFA, Sn-3, Sn-6 and n-6:n-3). For C15:0, C18:1 cis-13, C18:1 cis-15, C18:1 trans-16, C20:2 the heritability estimates were zero. In Angus (TAIT et al., 2007) and Japanese Black cattle (NOGI et al., 2011) estimates of heritability for IMF fat deposition and composition traits were higher than in this study. The lower values of heritability reported for this population could be explained by the reduced sample size (CASAS et al. 2001) or lower amount of genetic variation in the population (CASAS et al., 2003).
Table 1 - Descriptive statistics, variance components and heritability by GBLUP for IMF deposition and composition in Nellore
Trait Terminology 1 N Mean±SE2 Genetic Variance
Residual Variance
Total Variance
h2±SE
IMF (%) Intramuscular fat 382 2.77±0.05 0.196 0.490 0.686 0.29±0.16 C12:0 (mg/mg) Lauric acid 374 0.07±0.001 0.000039 0.00072 0.000761 0.05±0.09 C14:0 Myristic acid 378 3.54±0.03 0.0530 0.250 0.303 0.17±0.11 C14:1 cis-9 Myristoleic acid 378 0.96±0.01 0.0076 0.041 0.0486 0.16±0.11 C15:0 Pentadecylic acid 378 0.80±0.02 0.0 0.052 0.052 0±0.06 C16:0 Palmitic acid 378 26.69±0.15 0.6070 7.068 7.675 0.08±0.10 C16:1 cis-9 Palmitoleic acid 378 3.31±0.04 0.0640 0.354 0.418 0.15±0.10 C17:0 Margaric acid 378 1.07±0.009 0.0061 0.019 0.0251 0.24±0.15 C17:1 Heptadecenoic acid 378 0.58±0.007 0.0024 0.009 0.0114 0.20±0.12 C18:0 Stearic acid 378 14.98±0.14 1.3380 5.348 6.686 0.20±0.12 C18:1 cis-9 Oleic acid 378 37.46±0.22 2.0720 10.826 12.898 0.16±0.11 C18:1 cis-11 Cis-Vaccenic acid 378 2.98±0.05 0.0850 0.357 0.442 0.02±0.09 C18:1 cis-12 Cis-12 Octadecenoic 377 0.91±0.02 0.0030 0.034 0.037 0.09±0.10 C18:1, cis-13 Cis-13 Octadecenoic 377 0.58±0.008 0.0 0.021 0.021 0±0.06 C18:1 cis-15 Cis-15 Octadecenoic 377 0.06±0.002 0.0 0.0005 0.0005 0±0.06 C18:1 trans-6, 7, 8 Trans-6,7,8 Octadecenoic 378 0.18±0.004 0.0007 0.0055 0.0062 0.11±0.09 C18:1 trans-10, 11, 12 Trans-10,11,12 Octadecenoic 378 1.07±0.02 0.0236 0.0926 0.1162 0.20±0.12 C18:1 trans-16 Trans-16 Octadecenoic 377 0.14±0.003 0.0 0.0023 0.0023 0±0.09 C18:2 cis-9 cis-12 n-6 Linoleic acid 377 1.60±0.03 0.0340 0.239 0.273 0.12±0.10 C18:2 cis-9 trans-11 Vaccenic acid 377 0.21±0.003 0.0001 0.0026 0.0027 0.04±0.09 C18:2 trans-11 cis-15 Octadecenoic acid 374 0.07±0.001 0.00007 0.0004 0.00047 0.13±0.11 C18:3 n-6 -Linolenic acid 377 0.06±0.001 0.00008 0.0002 0.00028 0.24±0.13 C18:3 n-3 -Linolenic acid 376 0.16±0.005 0.00026 0.0017 0.00196 0.13±0.11 C20:1 Eicosanoic acid 374 0.11±0.002 0.00013 0.0014 0.00153 0.09±0.10 C20:2 Eicosadienoic acid 306 0.01±0.0003 0.0 0.00004 0.00004 0±0.08 C20:3 n-6 Eicosatrienoic acid 373 0.11±0.003 0.00018 0.00235 0.00253 0.07±0.09 C20:4 n-6 Arachidonic acid 377 0.36±0.008 0.00221 0.0235 0.0251 0.09±0.10 C20:5 n-3 (EPA) Eicosapentaenoic acid 376 0.08±0.002 0.00005 0.00135 0.00139 0.04±0.09 C22:5 n-3 (DPA) Docosapentaenoic acid 377 0.17±0.003 0.00047 0.00387 0.00434 0.11±0.10 C22:6 n-3 (DHA) Docosahexaenoic acid 364 0.03±0.001 0.00003 0.00018 0.00021 0.13±0.10 SFA3 Sum of saturated FA 377 47.23±0.23 1.960 15.00 16.960 0.11±0.09
MUFA3 Sum of monounsaturated FA 377 48.34±0.23 2.367 14.963 17.33 0.14±0.10
PUFA3 Sum of polyunsaturated FA 377 2.87±0.04 0.097 0.547 0.644 0.15±0.10
n-34 Sum of omega-3 377 0.44±0.09 0.00034 0.0016 0.00194 0.17±0.11
n-64 Sum of omega-6 377 2.13±0.04 0.00055 0.0031 0.00365 0.15±0.11
PUFA:SFA Ratio of PUFA to SFA 377 6.08±0.003 0.0623 0.41 0.4723 0.13±0.10 n-6:n-3 Ratio of n-6 to n-3 377 4.84±0.11 0.00395 0.0231 0.02705 0.14±0.10 AI5 Atherogenic index 377 0.82±0.05 0.03943 1.0784 1.11783 0.03±0.09 1IUPAC Compendium of Chemical Terminology
2SE Standard error
3MUFA, PUFA and SFA were the total of all monounsaturated, polyunsaturated and saturated fatty acids, respectively. 4n-3 and n-6 were total of omega 3 and 6 fatty acids
2.3.3 Genome wide association studies and genomic regions identified
All traits were used for GWAS and genomic heritability estimate, but only the ones with genomic heritability ≥ 0.10 were reported: IMF, 33 different FA and ratios, and one FA
index. Top three QTL regions associated with IMF deposition and composition traits in Nellore by Bayes B are showed in Table 3. The 1-Mb SNP window regions that explained more than 1% of the genetic variance were used to search for putative candidate genes (PCG) and are presented on Table 4. Therefore, 35 traits were used for GWAS and these represented 23 different 1-Mb genomic regions (Table 4). These regions were distributed over 12 different chromosomes: 2, 3, 6, 7, 8, 9, 10, 11, 12, 17, 26 and 27 and the corresponding PCG in these regions are reported in Table 3. Intramuscular fat was one of the traits that presented moderate heritability (0.25), however no region that explained more than 1% of the genetic variance for this trait was identified.
2.3.4 Saturated fatty acids
Eight genomic regions (1 Mb windows) explained more than 1% of genotypic variation for C12:0, C14:0, C16:0, and C18:0 (Table 4). These regions overlap with QTL previously reported for marbling score (CASAS et al., 2001), backfat thickness (CASAS et al., 2003), carcass weight and body weight in Angus cattle (MCCLUREet al., 2010). Figure 1 shows in more detail the Manhattan plot of the proportion of genetic variance explained by window across the 29 autosomes for the important saturated fatty acids for beef palatability: C12:0 (lauric acid), palmitic acid (C16:0), stearic acid (C18:0).
Table 2 - Posterior means of variance components for IMF deposition and composition in Nellore by Bayes B
Trait Genetic
Variance Residual Variance Total Variance Genomic Heritability
IMF (%) 0.16 0.48 0.64 0.25
C12:0 (mg/mg) 0.0001 0.0006 0.0007 0.18
C14:0 0.06 0.23 0.29 0.20
C14:1 cis-9 0.03 0.02 0.05 0.25
C15:0 0.006 0.04 0.046 0.12
C16:0 2.42 5.47 7.89 0.31
C16:1 cis-9 0.10 0.30 0.40 0.24
C17:0 0.004 0.02 0.024 0.17
C17:1 0.002 0.01 0.012 0.17
C18:0 1.23 5.28 6.51 0.19
C18:1 cis-9 6.08 7.11 13.19 0.46
C18:1 cis-11 0.04 0.33 0.37 0.11
C18:1 cis-12 0.005 0.03 0.035 0.13
C18:1, cis-13 0.02 0.002 0.022 0.09
C18:1 cis-15 0.0009 0.0004 0.00049 0.17
C18:1 trans-6, 7, 8 0.0008 0.005 0.0058 0.13
C18:1 trans-10, 11, 12 0.02 0.09 0.11 0.16
C18:1 trans-6 0.0003 0.002 0.0023 0.16
C18:2 cis 9 cis-12 n-6 0.03 0.23 0.26 0.13
C18:2 cis9, trans-11 0.0003 0.002 0.0023 0.12
C18:2 trans-11 cis-15 0.0001 0.0004 0.0005 0.22
C18:3 n-6 0.00007 0.0003 0.00037 0.21
C18:3 n-3 0.0003 0.002 0.0023 0.14
C20:1 0.0002 0.001 0.0012 0.16
C20:2 0.00005 0.00002 0.00007 0.22
C20:3 n-6 0.0003 0.002 0.0023 0.14
C20:4 n-6 0.002 0.02 0.022 0.08
C20:5 n-3 0.0002 0.001 0.0012 0.17
C22:5 n-3 0.0007 0.003 0.0037 0.16
C22:6 n-3 0.00006 0.0002 0.00026 0.24
SFA1 1.36 15.54 16.90 0.08
MUFA1 1.67 15.18 16.85 0.10
PUFA1 0.09 0.54 0.63 0.14
n-32 0.004 0.013 0.017 0.25
n-62 0.0005 0.003 0.0035 0.15
PUFA:SFA 0.003 0.02 0.023 0.11
n-6:n-3 0.66 1.23 1.89 0.34
AI3 0.007 0.03 0.037 0.16
1MUFA, PUFA and SFA were the total of all monounsaturated, polyunsaturated and saturated fatty acids, respectively 2n-3 and n-6 were total of omega 3 and 6 fatty acids
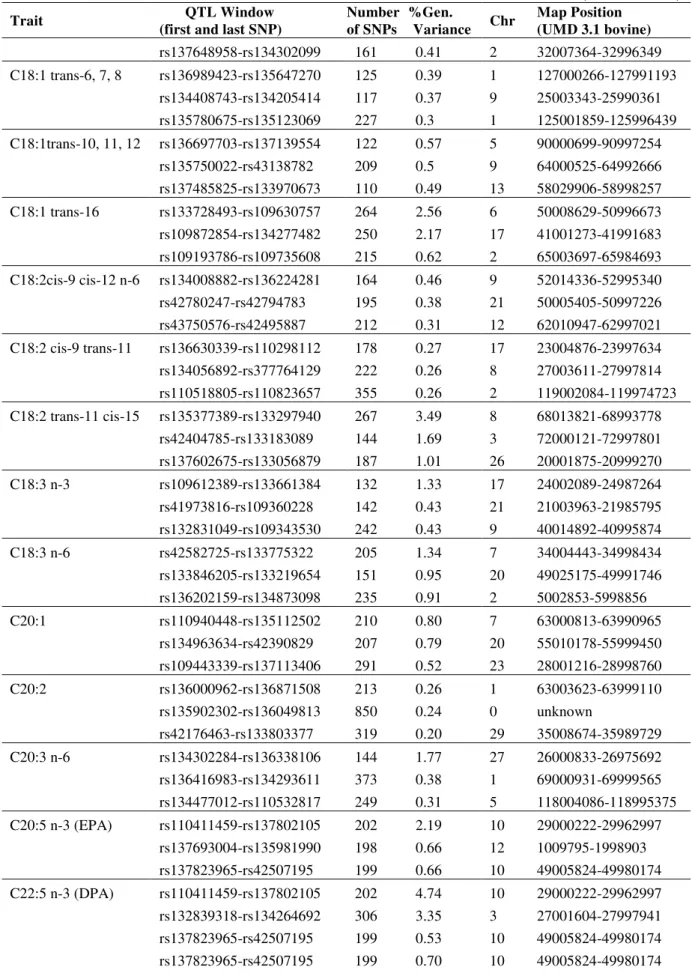
Table 3 - Top three QTL regions associated with IMF deposition and composition traits in Nellore by Bayes B
(continues)
Trait QTL Window
(first and last SNP)
Number of SNPs
%Gen.
Variance Chr
Map Position (UMD 3.1 bovine)
IMF rs110852801-rs110852801 144 0.66 10 50013104-50992412 rs110396618-rs42932197 131 0.42 9 3018763-3997425 rs109843584-rs137009265 243 0.4 6 28008364-28996379 C12:0 rs42924061-rs134942057 214 3.48 12 60000226-60994461 rs135783220-rs109238095 169 0.44 5 38001237-38999839 rs42639909-rs43332310 221 0.32 3 31001943-31992879 C14:0 rs41627556-rs110731616 332 1.43 9 36013595-36997263
rs43328164-rs134696015 295 1.06 3 6009105-6999643 rs134043558-rs134858042 182 0.82 2 107001640-107997035 C14:1 cis-9 rs137683417-rs29003360 232 1.86 2 26002605-26999718
rs137754875-rs135670282 203 1.55 12 66002783-66997356 rs110517663-rs137137362 127 1.43 11 27000446-27993515 C15:0 rs133645667-rs41591263 239 0.58 18 26001094-26997723 rs133520595-rs135893631 199 0.45 14 75014305-75995520 rs110569600-rs109846765 238 0.34 22 27024539-27994243 C16:0 rs109773631-rs135618512 277 1.53 12 13000697-13997298 rs134160160-rs109942510 285 1.38 3 26002777-26998679 rs135379047-rs136882159 173 0.58 8 20012045-20991197 C16:1 cis-9 rs133274959-rs136576856 213 1.42 3 25008982-25990012 rs136405986-rs137105475 114 1.18 10 74001100-74957582 rs135892505-rs109693564 184 1.04 7 80006438-80997126 C17:0 rs43471077-rs110039814 219 0.56 6 66005071-66997033 rs137480735-rs137082211 153 0.51 4 38001142-38996557 rs135375532-rs109902967 114 0.45 18 50001050-50870670 C17:1 rs110761991-rs110425294 83 0.83 5 55000572-55989100 rs110775410-rs110218142 202 0.67 6 32002888-32998721 rs133062684-rs109893445 144 0.6 6 21006361-21998823 C18:0 rs133274959-rs136576856 213 3.46 3 25008982-25990012
rs132804279-rs109645596 102 2.08 11 105009792-105985714 rs136405986-rs137105475 114 1.08 10 74001100-74957582 C18:1 cis-9 rs133274959-rs136576856 213 2.57 3 25008982-25990012 rs109773631-rs135618512 277 1.91 12 13000697-13997298 rs134160160-rs109942510 285 1.40 3 26002777-26998679 C18:1 cis-11 rs133850149-rs133020896 205 0.58 16 15004033-15997381 rs135337759-rs43566804 192 0.51 8 76000301-76995458 rs136472828-rs110306459 206 0.43 15 70000108-70998968 C18:1 cis-12 rs41776470-rs133872693 243 0.93 15 71015181-71997242 rs137532692-rs134926660 186 0.44 24 49001908-49998425 rs133496949-rs42611028 214 0.38 1 5004036-5976378 C18:1 cis-15 rs135695322-rs136588271 283 0.79 15 73014830-73997794
Table 3 - Top three QTL regions associated with IMF deposition and composition traits in Nellore by Bayes B
(continuation)
Trait QTL Window
(first and last SNP)
Number of SNPs
%Gen.
Variance Chr
Map Position (UMD 3.1 bovine)
rs137648958-rs134302099 161 0.41 2 32007364-32996349 C18:1 trans-6, 7, 8 rs136989423-rs135647270 125 0.39 1 127000266-127991193
rs134408743-rs134205414 117 0.37 9 25003343-25990361 rs135780675-rs135123069 227 0.3 1 125001859-125996439 C18:1trans-10, 11, 12 rs136697703-rs137139554 122 0.57 5 90000699-90997254
rs135750022-rs43138782 209 0.5 9 64000525-64992666 rs137485825-rs133970673 110 0.49 13 58029906-58998257 C18:1 trans-16 rs133728493-rs109630757 264 2.56 6 50008629-50996673 rs109872854-rs134277482 250 2.17 17 41001273-41991683 rs109193786-rs109735608 215 0.62 2 65003697-65984693 C18:2cis-9 cis-12 n-6 rs134008882-rs136224281 164 0.46 9 52014336-52995340 rs42780247-rs42794783 195 0.38 21 50005405-50997226 rs43750576-rs42495887 212 0.31 12 62010947-62997021 C18:2 cis-9 trans-11 rs136630339-rs110298112 178 0.27 17 23004876-23997634 rs134056892-rs377764129 222 0.26 8 27003611-27997814 rs110518805-rs110823657 355 0.26 2 119002084-119974723 C18:2 trans-11 cis-15 rs135377389-rs133297940 267 3.49 8 68013821-68993778
rs42404785-rs133183089 144 1.69 3 72000121-72997801 rs137602675-rs133056879 187 1.01 26 20001875-20999270 C18:3 n-3 rs109612389-rs133661384 132 1.33 17 24002089-24987264 rs41973816-rs109360228 142 0.43 21 21003963-21985795 rs132831049-rs109343530 242 0.43 9 40014892-40995874 C18:3 n-6 rs42582725-rs133775322 205 1.34 7 34004443-34998434 rs133846205-rs133219654 151 0.95 20 49025175-49991746 rs136202159-rs134873098 235 0.91 2 5002853-5998856 C20:1 rs110940448-rs135112502 210 0.80 7 63000813-63990965
rs134963634-rs42390829 207 0.79 20 55010178-55999450 rs109443339-rs137113406 291 0.52 23 28001216-28998760 C20:2 rs136000962-rs136871508 213 0.26 1 63003623-63999110
rs135902302-rs136049813 850 0.24 0 unknown
rs42176463-rs133803377 319 0.20 29 35008674-35989729 C20:3 n-6 rs134302284-rs136338106 144 1.77 27 26000833-26975692 rs136416983-rs134293611 373 0.38 1 69000931-69999565 rs134477012-rs110532817 249 0.31 5 118004086-118995375 C20:5 n-3 (EPA) rs110411459-rs137802105 202 2.19 10 29000222-29962997
Table 3 - Top three QTL regions associated with IMF deposition and composition traits in Nellore by Bayes B
(conclusion)
Trait QTL Window
(first and last SNP)
Number of SNPs
%Gen.
Variance Chr
Map Position (UMD 3.1 bovine)
C22:6 n-3 (DHA) rs109739360-rs137396104 232 0.46 7 99009734-99993114 rs134412504-rs134289230 125 0.45 4 26004144-26999199 MUFA rs133274959-rs136576856 213 3.24 3 25008982-26998679 rs134160160-rs109942510 285 1.13 3 26002777-26998679 rs133803779-rs29003226 155 0.46 3 51006901-51976646 PUFA rs135174883-rs381709624 78 0.44 5 48109149-48993294 rs109612389-rs133661384 132 0.42 17 24002089-24987264 rs387618166-rs136897467 152 0.36 6 33002421-33992354 n-3 rs110411459-rs137802105 202 2.59 10 29000222-29962997 rs137823965-rs42507195 199 2.25 10 49005824-49980174 rs132839318-rs134264692 306 1.37 3 27001604-27997941 n-6 rs134302284-rs136338106 144 2.47 27 26000833-26975692 rs132773171-rs42068328 123 0.77 25 33001144-33982544 rs109016980-rs137260120 300 0.53 6 70000724-70995843 PUFA:SFA rs42522569-rs108981640 203 0.2 18 64004373-64999126 rs137135250-rs136369955 257 0.19 14 28001989-28998719 rs136562362-rs43211407 315 0.18 1 2009127-2995356 n-6:n-3 rs136309202-rs43468791 216 0.74 12 58000573-58990041
BTA-38252-rs133950976 229 0.48 16 27024889-27996193 rs135537573-rs133828431 275 0.43 22 57004878-57970902 AI1 rs135990954-rs134959509 283 0.19 1 68013613-68999267 rs42964986-rs110471760 286 0.19 28 40001693-40996451 rs135812645-rs110103414 297 0.18 9 102003073-102995933
1Atherogenic index = [12:0 + 4(14:0) + 16:0]/(SSFA + SPUFA)
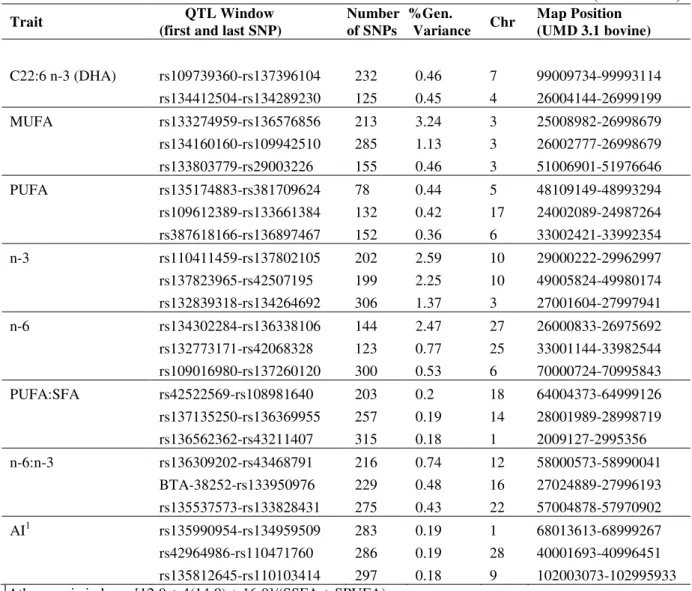
Table 4 - QTL regions associated with fatty acid composition in Nellore steers by Bayes B
(continues)
Group Traits QTL Window
(first and last SNP)
Number
of SNP
/window1
%Variance
explained
SNP
Window1
Chr Map Position (UMD 3.1
bovine assembly) PCG
2
Saturated
Fatty Acid
C14:0 rs43328164 - rs134696015 295 1.06 3 6009105 - 6999643 -3
C18:0 rs133274959 - rs136576856 213 3.46 3 25008982 - 25990012 HMGCS2, PHGDH, HSD3B1, HAO2
C16:0 rs134160160 - rs109942510 285 1.38 3 26002777 - 26998679 WARS2
C14:0 rs41627556 - rs110731616 332 1.43 9 36013595 - 36997263 GNG11, RGS5
C18:0 rs136405986 - rs137105475 114 1.08 10 74001100 - 74957582 DHRS7
C18:0 rs132804279 - rs109645596 102 2.08 11 105009792 - 105985714 NUP214
C16:0 rs109773631 - rs135618512 277 1.53 12 13000697 - 13997298 -
C12:0 rs42924061 - rs134942057 214 3.48 12 60000226 - 60994461 SLITRK6
Monounsat.
Fatty Acid
C14:1 cis-9 rs137683417 - rs29003360 232 1.86 2 26002605 - 26999718 GAD1, Sp5
C18:1 cis-9 rs134160160 - rs109942510 285 1.40 3 26002777 - 26998679 WARS2
C16:1 cis-9 rs133274959-rs136576856 213 1.42 3 25008982 - 25990012 HMGCS2, PHGDH, HSD3B1, HAO2
C18:1 cis-9 rs133274959-rs136576856 213 2.57 3 25008982 - 25990012 HMGCS2, PHGDH, HSD3B1, HAO2
C18:1 t-16 rs133728493 - rs109630757 264 2.56 6 50008629 - 50996673
-C16:1cis-9 rs135892505 - rs109693564 184 1.04 7 80006438 - 80997126 -
C16:1cis-9 rs136405986 - rs137105475 114 1.18 10 74001100 - 74957582 DHRS7
C14:1cis-9 rs110517663 - rs137137362 127 1.43 11 27000446 - 27993515 ABCG5
C18:1 cis-9 rs109773631 - rs135618512 277 1.91 12 13000697 - 13997298 -
C14:1 cis-9 rs137754875 - rs135670282 203 1.55 12 66002783 - 66997356 GPC6
Table 4 - QTL regions associated with fatty acid composition in Nellore steers by Bayes B
(conclusion)
Group Traits QTL Window
(first and last SNP)
Number
of SNP
/window1
%Variance
explained
SNP
Window1
Chr Map Position (UMD 3.1
bovine assembly) PCG
2
Polyunsat.
Fatty Acid
C22:5 n-3 rs132839318 - rs134264692 306 3.35 3 27001604 - 27997941 SPAG7, WDR3
C18:2 t-11c-15 rs42404785 - rs133183089 144 1.69 3 72000121 - 72997801 AQP7, LOXL2
C18:3 n-6 rs109612389 - rs133661384 205 1.34 7 34004443 - 34998434 -
C18:2 t-11c-15 rs135377389 - rs133297940 267 3.49 8 68013821 - 68993778 -
C22:5 n-3 rs110411459 - rs137802105 202 4.74 10 29000222 - 29962997
-C20:5 n-3 rs137823965 - rs42507195 199 2.19 10 49005824 - 49980174 RORA
C18:3 n-3 rs42582725 - rs133775322 132 1.33 17 24002089 - 24987264 -
C18:2 t-11c-15 rs137602675 - rs133056879 187 1.01 26 20001875 - 20999270 -
C20:3 n-6 rs134302284 - rs136338106 144 1.77 27 26000833 - 26975692 -
Total of
MUFA MUFA
rs133274959 - rs136576856 213 3.24 3 25008982 - 25990012 HMGCS2, PHGDH, HSD3B1, HAO2
rs134160160 - rs109942510 285 1.13 3 26002777 - 26998679 WARS2
Total of n-3 n-3
rs110411459 - rs137802105 202 2.59 10 29000222 - 29962997 -
rs137823965 - rs42507195 199 2.25 10 49005824 - 49980174 -
rs1322839318 - rs134264692 306 1.37 3 27001604 - 27997941 SPAG7, WDR3
Total of n-6 n-6 rs134302284 - rs136338106 144 2.47 27 26000833 - 26975692 -
11Mb window
2 Positional candidate genes
Figure 1 - Manhattan plot of the genome-wide association study result for A) C12:0 (lauric acid) B) C16:0 (palmitic acid) C) C18:0 (stearic acid) in Nellore. The X-axis represents the chromosomes, and the Y-axis shows the proportion of genetic variance explained by SNP window from Bayes B analysis
BTA3 at 6 Mb and BTA9 at 36 Mb were associated with C14:0 fatty acid. In the first region, no PCG was identified. In the second region, the following PCGs were identified: guanine nucleotide binding protein (G protein), gamma 11 (GNG11) and regulator of G-protein signaling 5 (RGS5). These genes are associated with G proteins that have been implicated in the regulation of body weight and metabolic function, hyperinsulinemia, impaired glucose tolerance and resistance to insulin in mice (DENGet al., 2012).
BTA3 at 26 Mb and BTA12 at 13 Mb were associated with C16:0 fatty acid. In the first QTL region the tryptophanyl tRNA synthetase 2, mitochondrial (WARS2) gene was identified. In BTA12 at 13 Mb no PCG was identified. WARS2 gene encodes an essential enzyme that catalyzes aminoacylation of tRNA with tryptophan. The WARS2 protein contains a signal peptide for mitochondrial import, OMIM: 604733 (MCKUSICK, 2007), and is involved with regulation of fat distribution in human visceral and subcutaneous fat (SCHLEINITZet al., 2013).
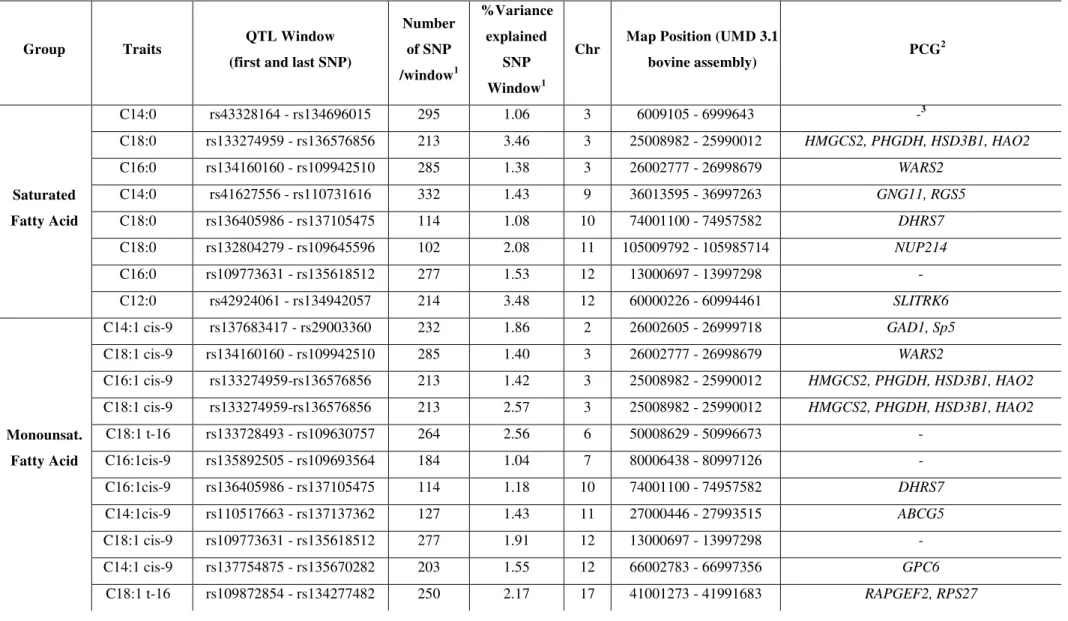
BTA3 at 25Mb, BTA10 at 74 Mb and BTA11 at 105 Mb QTL regions were associated with C18:0 fatty acid. On BTA3 at 25Mb four PCG were identified: 3-hydroxy-3-methylglutaryl-Coenzyme A synthase 2, mitochondrial (HMGCS2), phosphoglycerate dehydrogenase (PHGDH), hydroxy-5-steroid dehydrogenase, 3 beta- and steroid delta-isomerase 1 (HSD3B1) and hydroxyacid oxidase 2, long chain (HAO2). HMGCS2 was associated with fatty acid oxidation and ketogenesis in HepG2 cells (VILA-BRAU et al., 2011) and is directly regulated by PPAR-α gene that is an important key regulator of β -oxidation. On the other hand the PPARg expression induces lipogenesis by PXR activation in mice liver (WADA; GAO; XIE, 2009). PHGDH is related to the regulation of gene expression according to gene ontology (GO) terms (GO:0010468), HSD3B1 gene is associated with steroid biosynthesis (GO:0006694) and metabolic process (GO: 0008202) and
HAO2 is associated with fatty acid oxidation (GO:0019395).
On BTA10 at 74 Mb QTL region, dehydrogenases/reductases (SDRs) (DHRS7) was identified. DHRS7 catalyzes the oxidation/reduction of a wide range of substrates, including retinoid and steroids (HAESELEER; PALCZEWSKI, 2000) and has high expression level in adipocyte and skeletal muscle (WU et al., 2009). In addition, this gene is responsible for the final step in cholesterol production, the conversion of 7-dehydrocholesterol to cholesterol (PORTER, 2000).
(FG) repeat sequences and the FG domains have an unfolded structure and are responsible for interaction with cargo complexes that move through the pore. One of these importin-cargo complexes is sterol regulatory element binding proteins-sterol-sensing accessory factor (SREBP-SCAP). This factor enters the nucleus, then binds to sterol regulatory elements (SRE) in the promoter regions of genes, whose products mediate the synthesis of cholesterol and fatty acids (ZHOUet al., 2011).
2.3.5 Monounsaturated fatty acids
Ten genomic regions (1 Mb region) explained more than 1% of genotypic variation for monounsaturated fatty acids, which relates C14:1 cis-9, C16:1 cis-9, C18:1 cis-9, and C18:1 trans-16 (Table 4). These regions overlap with QTL reported for carcass weight, marbling score in Angus (MCCLURE et al., 2010), docosahexaenoic acid content in Charolais x Holstein crossbred cattle (GUTIERREZ-GIL et al., 2009) and palmitoleic acid in dairy cattle (MORRIS et al., 2007). Manhattan plots of the proportion of genetic variance explained by each 1-Mb window (2,527 windows) across the 29 autosomes for the most important fatty acid for beef quality and human health: myristoleic acid (C14:1 cis-9), palmitoleic acid (C16:1 cis-9), and oleic acid (C18:1 cis-9) and are in Figures 1, 2 and 3, respectively.
BTA2 at 26 Mb, BTA11 at 27 Mb, and BTA12 at 66 Mb were associated with C14:1 cis-9 fatty acid. On BTA2 at 26 Mb region, glutamate decarboxylase 1 (GAD1) and specificity protein 5-transcription factor (Sp5) were identified. The GAD1 gene is involved with food behavior and insulin secretion. It was shown to be associated with morbid obesity (MEYRE et al., 2005) in humans, and body weight and daily gain in cattle (LI et al., 2012).
Sp5 transcription factors are involved in the regulation of pyruvate kinase, lactate
dehydrogenase and fatty acid synthase in cancer cells (BLACK; BLACK; AZIZKHAN-CLIFFORD, 2001; ARCHER, 2011). On BTA11 at 27 Mb region, ATP-binding cassete, sub-family G (WHITE), member 5 (ABCG5) was identified. The ABCG family members were associated with cellular lipid-trafficking in macrophages and hepatocytes. This gene also presents an important role in the PPARg and LXR pathways. (SCHMITZ; LANGMANN; HEIMERL, 2001). On BTA12 at 66 Mb region, glypican 6 (GPC6) was identified. Glypicans family are involved with the control of cell growth and cell division. Other glypican gene,
A previous GWAS using chicken population reported an association between GPC6 and body weight, which has a stronger correlation with body fatness and obesity (GU et al., 2011).
BTA3 at 25 Mb, BTA7 at 80 Mb and BTA10 at 74 Mb were associated with C16:1 cis-9 fatty acid. Both BTA3 at 25Mb and BTA10 at 74 Mb regions were also associated with saturated fatty acids, where HMGCS2, PHGDH, HSD3B1, HAO2, and DHRS7 were described above. On BTA7 at 80 Mb region, no PCG associated with this trait was identified.
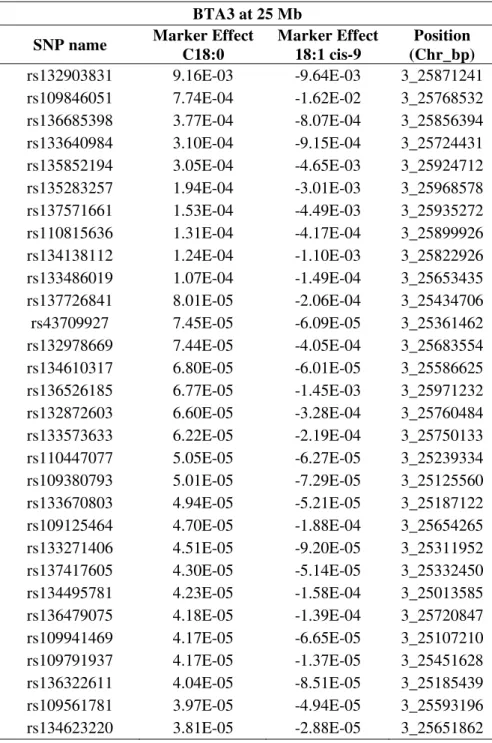
BTA3 at 25 Mb, BTA3 at 26 Mb, and BTA12 at 13 Mb were associated with C18:1 cis-9. The first two regions were also associated with saturated fatty acids (C18:0 and C16:0, respectively) and C16:1 cis-9. On BTA12 at 13 Mb region, there were no annotated genes (Cattle Genome UMD3.1).
BTA6 at 50 Mb and BTA17 at 41 Mb were associated with C18:1 trans-16. On BTA 6 at 50 Mb region, no PCG associated with this trait was identified, and on BTA17 at 41 Mb region one PCG was found: Rap guanine nucleotide exchange factor (RAPGEF2), that selectively and non-covalently interacts with diacylglycerol, a diester of glycerol and two fatty acids (GO:0019992).
Table 5 - Top 30 markers effect in BTA3 at 25 Mb associated with C18:0 and C18:1 cis-9 in Nellore steers
BTA3 at 25 Mb
SNP name Marker Effect
C18:0
Marker Effect 18:1 cis-9
Position (Chr_bp)
rs132903831 9.16E-03 -9.64E-03 3_25871241
rs109846051 7.74E-04 -1.62E-02 3_25768532
rs136685398 3.77E-04 -8.07E-04 3_25856394
rs133640984 3.10E-04 -9.15E-04 3_25724431
rs135852194 3.05E-04 -4.65E-03 3_25924712
rs135283257 1.94E-04 -3.01E-03 3_25968578
rs137571661 1.53E-04 -4.49E-03 3_25935272
rs110815636 1.31E-04 -4.17E-04 3_25899926
rs134138112 1.24E-04 -1.10E-03 3_25822926
rs133486019 1.07E-04 -1.49E-04 3_25653435
rs137726841 8.01E-05 -2.06E-04 3_25434706
rs43709927 7.45E-05 -6.09E-05 3_25361462
rs132978669 7.44E-05 -4.05E-04 3_25683554
rs134610317 6.80E-05 -6.01E-05 3_25586625
rs136526185 6.77E-05 -1.45E-03 3_25971232
rs132872603 6.60E-05 -3.28E-04 3_25760484
rs133573633 6.22E-05 -2.19E-04 3_25750133
rs110447077 5.05E-05 -6.27E-05 3_25239334
rs109380793 5.01E-05 -7.29E-05 3_25125560
rs133670803 4.94E-05 -5.21E-05 3_25187122
rs109125464 4.70E-05 -1.88E-04 3_25654265
rs133271406 4.51E-05 -9.20E-05 3_25311952
rs137417605 4.30E-05 -5.14E-05 3_25332450
rs134495781 4.23E-05 -1.58E-04 3_25013585
rs136479075 4.18E-05 -1.39E-04 3_25720847
rs109941469 4.17E-05 -6.65E-05 3_25107210
rs109791937 4.17E-05 -1.37E-05 3_25451628
rs136322611 4.04E-05 -8.51E-05 3_25185439
rs109561781 3.97E-05 -4.94E-05 3_25593196
Nellore steers
BTA3 at 26 Mb BTA12 at 13 Mb
SNP Name Marker Effect C16:0 Marker Effect 18:1 cis-9 Position
(Chr_Bp) SNP Name
Marker Effect C16:0 Marker Effect 18:1 cis-9 Position (Chr_bp)
2.3.6 Polyunsaturated fatty acids
Nine genomic regions (1 Mb window) explained > 1% of genotypic variation for group of polyunsaturated fatty acids, which relates C18:2 9 cis12 n-6, C18:2 trans-11 cis-15, C18:3 n-3, C18:3 n-6, C20:3 n-6, C20:5 n-3, and C22:5 n-3 (Table 3). These overlapped with QTL reported for marbling score, body weight in Angus cattle (MCCLURE et al., 2010), intramuscular fat, saturated fatty acid content, stearic acid in Fleckvieh bulls (BARTON et al., 2010) and RFI in half-sib families from Angus and Charolais (SHERMAN et al., 2009). Figure 2 shows in more detail the Manhattan plot of the proportion of genetic variance
explained by window across the 29 autosomes for the important fatty acid to human health:
-linolenic acid (C18:3 n-3), -linolenic acid (C18:3 n-6) and total of n-3 (n-3).
BTA3 at 72 Mb, BTA 8 at 68 Mb, and BTA26 at 20 Mb were associated with C18:2 trans-11 cis-15 fatty acid. On BTA3 at 72 Mb QTL region, two PCG related to lipid metabolism were observed: aquaporin 7 (AQP7) and lysil oxidase-like2 (LOXL2). AQP7 is involved with the PPAR signaling pathway (Huang Da, Sherman e Lempicki, 2009), while
LOXL2 is associated with lean body mass in mouse (BAKER et al., 2012). On BTA 8 at 68
Mb and BTA26 at 20 Mb no PCG was associated with this trait.
BTA10 at 49 Mb region was associated with C20:5 n-3 fatty acid, which harbors the
RAR-related orphan receptor A (RORA) gene that is related to steroid hormone receptor
activity. When combined with a steroid hormone, it produces the signal within the cell to initiate a change in cell activity or function (GO:0003707).
BTA3 at 27 Mb and BTA10 at 29 Mb QTL regions explained more than 1% of genetic variance for C22:3 n-3. The first region (BTA3 at 27 Mb) harbors two PCG: SPAG17 and
WDR3. These genes are involved with nucleus membrane (cellular components), the lipid
bilayers that surround the nucleus and that form the nuclear envelope excluding the intermembrane space (GO:0031965). In the second region no PCG involved with this trait was identified. In other regions associated with C18:3 n-3 (BTA7 at 34 Mb), C18:3 n-6 (BTA17 at 24 Mb), and C20:3 n-6 (BTA27 at 26 Mb) no annotated genes were found (HU et al., 2013).