Long-Term Predictors of Social and Leisure
Activity 10 Years after Stroke
Anna Norlander1*, Emma Carlstedt1, Ann-Cathrin Jönsson1, Eva M. Lexell1,2, Agneta Ståhl3, Arne Lindgren2,4, Susanne Iwarsson1
1Department of Health Sciences, Lund University, Lund, Sweden,2Department of Neurology and Rehabilitation Medicine, Skåne University Hospital, Lund-Malmö, Sweden,3Department of Technology and Society, Lund University, Lund, Sweden,4Department of Clinical Sciences, Neurology, Lund University, Lund, Sweden
Abstract
Background
Restrictions in social and leisure activity can have negative consequences for the health and well-being of stroke survivors. To support the growing number of people who are ageing with stroke, knowledge is needed about factors that influence such activity in a long-term perspective.
Aim
To identify long-term predictors of the frequency of social and leisure activities 10 years after stroke.
Method
145 stroke survivors in Sweden were followed-up at16 months and 10 years after a first-ever stroke. Data representing body functions, activities & participation, environmental factors and personal factors at 16 months after stroke, were used in multiple linear regres-sion analyses to identify predictors of the activity frequency after 10 years, as assessed by the‘Community, social and civic life’sub-domain of the Frenchay Activities Index (FAI-CSC).
Results
At the 10-year follow-up the frequency of social and leisure activities varied considerably among the participants, with FAI-CSC scores spanning the entire score range 0–9 (mean/ median 4.9/5.0). Several factors at 16 months post stroke were independently related to the long-term activity frequency. The final regression model included four significant explana-tory variables. Driving a car (B = 0.999), ability to walk a few hundred meters (B = 1.698) and extent of social network (B = 1.235) had a positive effect on activity frequency, whereas an age75 years had a negative effect (B = -1.657). This model explained 36.9% of the
variance in the FAI-CSC (p<0.001).
a11111
OPEN ACCESS
Citation:Norlander A, Carlstedt E, Jönsson A-C, Lexell EM, Ståhl A, Lindgren A, et al. (2016) Long-Term Predictors of Social and Leisure Activity 10 Years after Stroke. PLoS ONE 11(2): e0149395. doi:10.1371/journal.pone.0149395
Editor:Takeru Abe, Yokohama City University, JAPAN
Received:July 2, 2015
Accepted:February 1, 2016
Published:February 22, 2016
Copyright:© 2016 Norlander et al. This is an open access article distributed under the terms of the
Creative Commons Attribution License, which permits unrestricted use, distribution, and reproduction in any medium, provided the original author and source are credited.
Data Availability Statement:All relevant data are within the paper.
Conclusion
Stroke survivors who drive a car, have the ability to walk a few hundred meters and have a wide social network at 16 months after a first-ever stroke are more likely to have a high fre-quency of social and leisure activities after 10 years, indicating that supporting outdoor mobility and social anchorage of stroke survivors during rehabilitation is important to coun-teract long-term inactivity.
Introduction
Stroke is one of the primary causes of complex disability in Sweden and globally [1] and is
related to extensive long-term costs for healthcare, rehabilitation and productivity loss [2]. In
Europe and the U.S. stroke survivors represent 1.5–2.8% of the population [3,4] and the
preva-lence is expected to increase [5]. Even though survival rates have improved substantially many
stroke survivors experience long-term physical and cognitive disabilities, which often lead to
restrictions in activity and social participation [6,7]. As an effect of the ageing population,
improved survival after stroke and a higher incidence of stroke among young people, more
peo-ple are living and ageing with the consequences of a stroke for a significant part of their lives [8].
In Sweden as well as internationally, specialized stroke care and rehabilitation is mainly con-centrated to the first months following the stroke. Most research is also limited to the early post-stroke stages up to the first years of recovery and little is known about the long-term life situation of stroke survivors. As of yet, the few existing follow-up studies that extend beyond
five years have mainly focused on survival and disability rates [9,10]. However, there is an
increasing awareness about the need for long-term sustainable stroke services, and long-term studies focusing on participation have been listed among the top ten priorities for stroke
research [11]. Two recent 10-year follow-up studies have presented results from stroke
survi-vors, highlighting the need for strategies to reduce the risk of long-term activity limitations
[12] as well as the importance of having meaningful activities (such as hobbies and social
activ-ities) for subjective well-being 10 years after stroke [13]. Taking into consideration that
engage-ment in social and leisure activities is related not only to subjective well-being but also to
improved health, functional recovery and survival after stroke [14–16], research on how to
pro-mote such activities in a long-term perspective has not gained sufficient attention.
The initial challenges faced by stroke survivors regarding community reintegration and the process of coping with role changes in family, work and social contexts have been well
described [17,18]. A range of factors have been found related to engagement in social and
lei-sure activities during the first months and years after a stroke. Factors negatively related to
engagement in such activities include depression [19], age [20–22], motor and cognitive
impairments [21], emotion regulation difficulties [23], living with a partner [20],
communica-tion difficulties [6,20] and urinary incontinence [24]. Whereas walking ability [21] and
exer-cise [25] have been related to higher activity levels. Additional factors described by stroke
survivors as facilitators for engagement in valued activities include access to health services and
rehabilitation [26], having a meaningful social position or occupation [18,27,28] and having
social supportive networks [18,28]. Transportation difficulties [29] and driving cessation [30]
are commonly described barriers. However, it is not known what impact these factors have in a longer perspective. Such knowledge could be used to identify those at increased risk for long-term activity limitations and participation restrictions at an early stage, and guide individual rehabilitation interventions and community support that are sustainable over time.
Welfare (FORTE). The funders had no role in study design, data collection and analysis, decision to publish, or preparation of the manuscript.
Assessment of engagement in social and leisure activities is challenging since it can be defined in different ways. The present study is based on the widespread and internationally accepted definitions put forth in the International Classification of Functioning Disability and
Health (ICF) [31]. In the ICF, activity is defined as the execution of a task or action by and
indi-vidual. Social and leisure activities are part of the overarching concept‘community, social and
civic life’, defined as:“actions and tasks required to engage in organized social life outside the
family,in community,social and civic areas of life”. Execution of such activities implies partici-pation in specific contexts. However, the broader subjective experience of participartici-pation, in the ICF defined as involvement in a life situation, was not targeted in this study.
Using these definitions, by means of a 10-year follow-up of Swedish stroke survivors we recently demonstrated that though activity levels generally were high among the participants,
there was considerable variation in the frequency of social and leisure activities [32]. A first
step in understanding what caused this variation and how to support such activity over time is to identify factors that predict the frequency of social and leisure activities in a long-term per-spective. Hence, the aim of this study was to identify long-term predictors of the frequency of social and leisure activities 10 years after a first-ever stroke.
Methods
Participants
This study was based on a sample of 416 patients with first-ever stroke consecutively enrolled in the Lund Stroke Register during a one year period starting March 1, 2001. The Lund Stroke Register is a population-based stroke register that covers the catchment area of Skåne Univer-sity Hospital in Lund, Sweden, including eight municipalities with a total of 234,505 inhabi-tants (as of December 31, 2001). The efficient case ascertainment methods used to detect patients (including prospective screening methods, regular inquiries to primary care, hospital
registers, death and autopsy registers) have been described in previous publications [33,34].
Stroke was defined according to the established WHO criteria [35]. All eligible patients with an
established first-ever stroke during the defined period were included in the study.
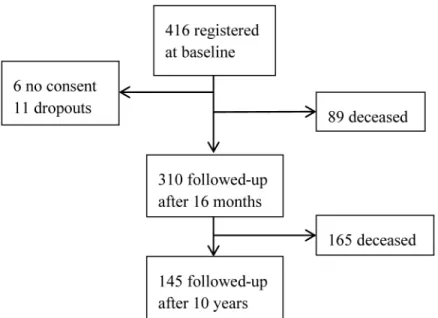
The survivors were followed-up 16 months (SD 0.12) and 10 years (SD 0.17) after the stroke. The 16-month follow-up included 310 participants (89 participants were deceased, 6 declined inclusion at baseline and 11 had dropped out for different personal reasons such as severe ill-ness or the death of a spouse). Beyond this point there were no additional dropouts, and all
remaining survivors (n = 145) participated in the 10-year follow-up (Fig 1). Out of the 145
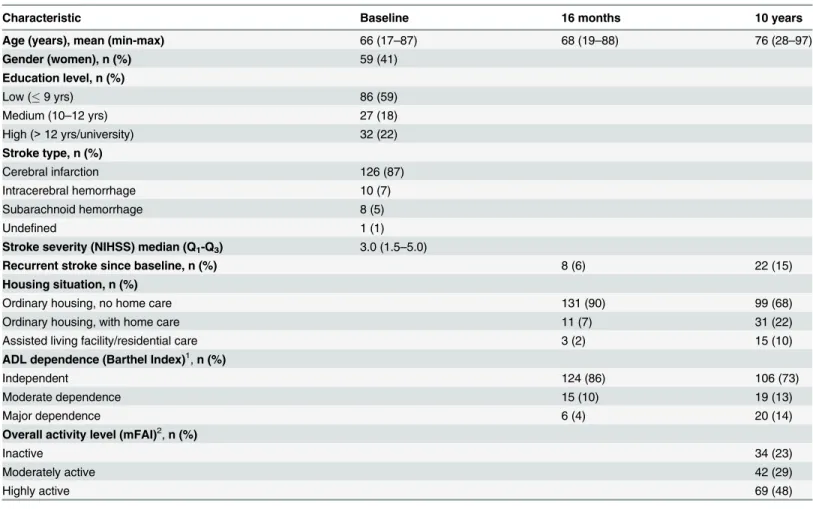
10-year survivors, 59 were women, and the mean age at stroke onset was 66 years. The majority lived in ordinary housing without home care at both follow-ups. Participant characteristics
over the study period are presented inTable 1.
Procedure
At the 16-month as well as the 10-year follow-up the majority of the participants were fol-lowed-up at the outpatient clinic of the Department of Neurology and Rehabilitation Medicine, Skåne University Hospital, Lund. The remaining follow-ups were performed at other care facil-ities, at home visits, or by telephone, and in some cases in cooperation with primary care pro-fessionals in the district where the participant lived at the time of the follow-up. All
well. For further details on procedures and assessment methods we refer to our previous
publi-cations [34,39].
Instruments and study-specific questions. The data used for the present study included a
subset of the extensive data collected at the 16-month and the 10-year follow-ups. At the 16-month follow-up, different aspects of stroke outcome were obtained using well-established assessment instruments as well as study-specific questions. Assessment instruments included
the Barthel Index (BI) [40], Mini Mental State Examination (MMSE) [41], Geriatric
Depres-sion Scale (GDS-20) [42] and the Medical Outcomes Study 36-Item Short-Form Health Survey
(SF-36) [43]. The study-specific questions covered lifestyle related risk factors, social network
resources [44], satisfaction with stroke services and rehabilitation, stroke related functional
dis-abilities, pain, housing situation, activities of daily living (ADL), indoor and outdoor mobility and general health. A majority of these questions were based on the items of the Swedish Stroke
Register 2-year follow-up survey [45].
At the 10-year follow-up, information about activity frequency was obtained by means of a
Swedish extended version of the Frenchay Activities Index (FAI) [37]. FAI assessments are
based on self-reported frequency of performing different activities over a period of time. The
instrument has demonstrated adequate validity and reliability in populations with stroke [46,
47] and is commonly used in stroke research to assess social activity [7,14,20]. However, by
means of ICF-linking we recently demonstrated [32] that only a sub-domain of the FAI is
related to the ICF chapter‘Community, social and civic life’whereas the remaining items
mainly represent domestic activities and mobility. Hence, for the present study only the‘
Com-munity, social and civic life’sub-domain of the FAI, hereinafter referred to as FAI-CSC, was
used.
Dependent variable. The FAI-CSC, representing the frequency of social and leisure
activi-ties 10 years after stroke, consisted of three items;“Social outings”(frequency of taking part in
social activities out of home, such as going to the theater, dinner with friends or visiting
fam-ily),“Pursuing active interest in hobby”(activities of interest in or out of the home, such as
knitting, caring for houseplants or sports) and“Outings/car rides”(coach or rail trips or car
rides to some place for pleasure). Even though an extended version of the FAI was used in the Fig 1. Participant flow chart from inclusion to the 10-year follow-up.
data collection, the three items of the FAI-CSC were identical to those of the original FAI [47]. For the first two items, frequency of performance during the last three months was assessed
whereas the last item referred to the previous six months. Each item was scored from 0–3,
giv-ing a maximum total score of 9 for the FAI-CSC. A higher FAI-CSC score reflected a higher overall frequency of social and leisure activities.
Independent variables. Since engagement in social and leisure activities is a complex
pro-cess likely influenced by many different factors over time, it was relevant to include a broad range of independent variables representing different aspects of functioning, disability and health, described in the ICF in terms of four components; Body functions, Activities and
partic-ipation, Personal factors and Environmental factors [31]. A total of 22 independent variables
were selected from the comprehensive assessments performed at the 16-month follow-up. The selection was guided by previous research findings reviewed by the first two authors, followed by repeated discussions in the interdisciplinary team of co-authors. The variables were divided into four groups, representing Body functions (8 variables), Activities and participation (6
vari-ables), Personal factors (2 variables) and Environmental factors (6 variables) (Table 2). Before
further analysis, the GDS-20 and the MMSE were dichotomized according to established cut-Table 1. Participant demographics, living situation and functional status at baseline, 16 months and 10 years after stroke (N = 145).
Characteristic Baseline 16 months 10 years
Age (years), mean (min-max) 66 (17–87) 68 (19–88) 76 (28–97)
Gender (women), n (%) 59 (41)
Education level, n (%)
Low (9 yrs) 86 (59)
Medium (10–12 yrs) 27 (18)
High (>12 yrs/university) 32 (22)
Stroke type, n (%)
Cerebral infarction 126 (87)
Intracerebral hemorrhage 10 (7)
Subarachnoid hemorrhage 8 (5)
Undefined 1 (1)
Stroke severity (NIHSS) median (Q1-Q3) 3.0 (1.5–5.0)
Recurrent stroke since baseline, n (%) 8 (6) 22 (15)
Housing situation, n (%)
Ordinary housing, no home care 131 (90) 99 (68)
Ordinary housing, with home care 11 (7) 31 (22)
Assisted living facility/residential care 3 (2) 15 (10)
ADL dependence (Barthel Index)1,n (%)
Independent 124 (86) 106 (73)
Moderate dependence 15 (10) 19 (13)
Major dependence 6 (4) 20 (14)
Overall activity level (mFAI)2,n (%)
Inactive 34 (23)
Moderately active 42 (29)
Highly active 69 (48)
NHISS: The National Institutes of Health Stroke Scale, score range 0–42 [36]. mFAI: Swedish modified and extended Frenchay Activities Index [37].
1Independence = 95
–100, moderate dependence = 60–90, major dependence = 0–55 [38].
2Inactive = 0
–16; Moderately active = 17–32; Highly active = 33–48.
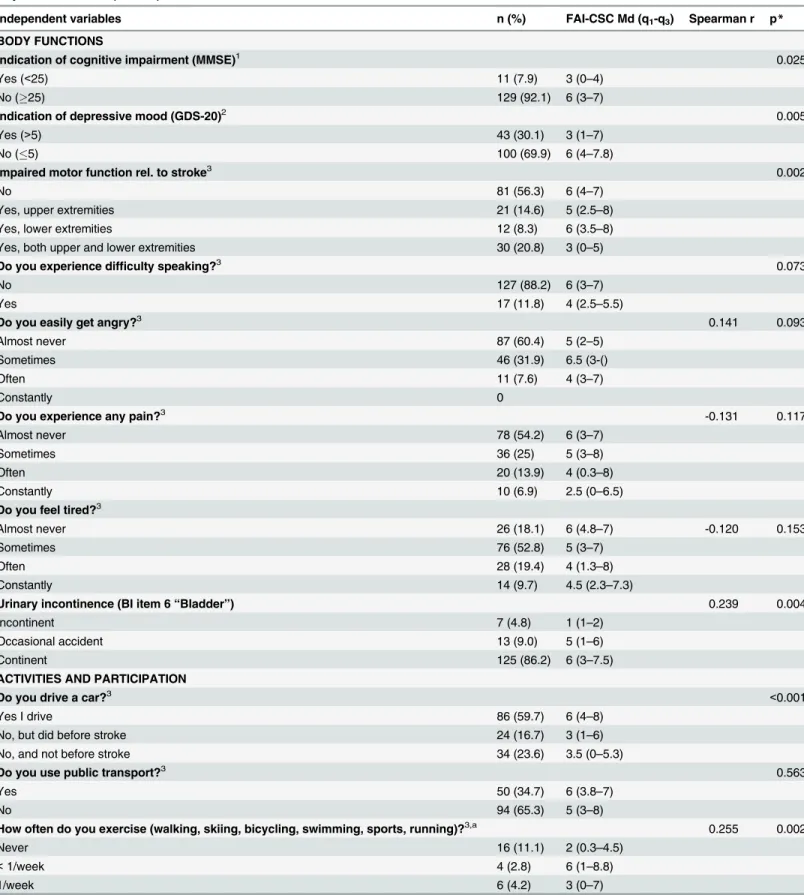
Table 2. Independent variables assessed at 16 months post stroke and their correlation with the frequency of social and leisure activity (FAI-CSC) 10 years after stroke (N = 145).
Independent variables n (%) FAI-CSC Md (q1-q3) Spearman r p*
BODY FUNCTIONS
Indication of cognitive impairment (MMSE)1 0.025
Yes (<25) 11 (7.9) 3 (0–4)
No (25) 129 (92.1) 6 (3–7)
Indication of depressive mood (GDS-20)2 0.005
Yes (>5) 43 (30.1) 3 (1–7)
No (5) 100 (69.9) 6 (4–7.8)
Impaired motor function rel. to stroke3 0.002
No 81 (56.3) 6 (4–7)
Yes, upper extremities 21 (14.6) 5 (2.5–8)
Yes, lower extremities 12 (8.3) 6 (3.5–8)
Yes, both upper and lower extremities 30 (20.8) 3 (0–5)
Do you experience difficulty speaking?3 0.073
No 127 (88.2) 6 (3–7)
Yes 17 (11.8) 4 (2.5–5.5)
Do you easily get angry?3 0.141 0.093
Almost never 87 (60.4) 5 (2–5)
Sometimes 46 (31.9) 6.5 (3-()
Often 11 (7.6) 4 (3–7)
Constantly 0
Do you experience any pain?3 -0.131 0.117
Almost never 78 (54.2) 6 (3–7)
Sometimes 36 (25) 5 (3–8)
Often 20 (13.9) 4 (0.3–8)
Constantly 10 (6.9) 2.5 (0–6.5)
Do you feel tired?3
Almost never 26 (18.1) 6 (4.8–7) -0.120 0.153
Sometimes 76 (52.8) 5 (3–7)
Often 28 (19.4) 4 (1.3–8)
Constantly 14 (9.7) 4.5 (2.3–7.3)
Urinary incontinence (BI item 6“Bladder”) 0.239 0.004
Incontinent 7 (4.8) 1 (1–2)
Occasional accident 13 (9.0) 5 (1–6)
Continent 125 (86.2) 6 (3–7.5)
ACTIVITIES AND PARTICIPATION
Do you drive a car?3 <0.001
Yes I drive 86 (59.7) 6 (4–8)
No, but did before stroke 24 (16.7) 3 (1–6)
No, and not before stroke 34 (23.6) 3.5 (0–5.3)
Do you use public transport?3 0.563
Yes 50 (34.7) 6 (3.8–7)
No 94 (65.3) 5 (3–8)
How often do you exercise (walking, skiing, bicycling, swimming, sports, running)?3,a 0.255 0.002
Never 16 (11.1) 2 (0.3–4.5)
<1/week 4 (2.8) 6 (1–8.8)
1/week 6 (4.2) 3 (0–7)
Table 2. (Continued)
Independent variables n (%) FAI-CSC Md (q1-q3) Spearman r p*
2–3/week 31 (21.5) 6 (3–7)
Almost every day 87 (60.4) 6 (4–8)
How mobile are you?3 -0.267 0.001
Independent indoors and outdoorsc 132 (91.7) 6 (3
–7)
Independent indoors but not outdoorsc 5 (3.5) 3 (0
–4.5)
Dependent both indoors and outdoors 7 (4.9) 1 (0–3)
Are you able to carry out your pre-stroke interests?3 -0.327 <0.001
Yes, as before 74 (51.4) 6 (4–8)
Yes, but not quite as before 49 (34) 5 (2–7,5)
No, hardly or never 21 (14.6) 3 (0.5–4.5)
Does your health condition limit your ability to walk a few hundred meters? (SF36-3h)3 0.436 <0.001
Yes, very limited 12 (8.3) 1 (0.3–4.5)
Yes, slightly limited 25 (17.4) 3 (0–5)
No, not at all limited 107 (74.3) 6 (4–8)
PERSONAL FACTORS
Age <0.001
<75 yrs 107 (73.8) 6 (4–8)
75 yrs 38 (26.2) 2 (0–4.3)
Gender 0.052
Men 86 (59.3) 6 (3–8)
Women 59 (40.7) 4 (1–7)
ENVIRONMENTAL FACTORS
Living situation 0.160
Living alone 36 (24.8) 4 (1.3–6.8)
Living with partner or other person(s) 109 (75.2) 6 (3–7)
Main occupation 0.186
Work/study fulltime or part time 27 (18.6) 6 (4–7)
Do not work/study 118 (81.4) 5 (2–7)
Is there any particular person that you feel you can truly get support from?3 0.924
Yes 134 (93.1) 5 (3–7)
No 10 (6.9) 4.5 (3–8.3)
Do you receive any rehabilitation/training at present?3 0.236
Yes 27 (18.8) 4 (3–6)
Yes, but not enough 4 (2.8) 3 (0–6)
No, but I would need it 20 (13.9) 4 (3–7.5)
No, I do not need it 93 (64.6) 6 (3–7.5)
Social anchorage outside the household (contact frequency)3,b 0.252 0.002
Daily 47 (32.4) 6 (4–8)
Every week 92 (63.4) 5 (2.3–7)
Every month 3 (2.1) 0 (0–0)
Every quarter of a year 1 (0.7) 4 (4–4)
Never 1 (0.7) 0 (0–0)
Social anchorage outside the household (extent of social network, 0–5 sources)3,b 0.369 <0.001
5 different sources of contact 48 (33.3) 6.5 (4.3–8)
4 different sources of contact 44 (30.6) 6 (3–8)
3 different sources of contact 39 (27.1) 3 (1–6)
2 different sources of contact 8 (5.6) 4.5 (1–6.8)
off levels for depressive mood [42] and cognitive impairment [48]. Four other variables (impaired motor function; age; main occupation; particular person for support) that had numerous or overlapping response categories were dichotomized or recoded to improve interpretability. The recoding was based on the type of response categories and the distribution of data.
Statistical analyses. The independent variables listed inTable 2were first tested
individu-ally for their association with the FAI-CSC, using the Spearman rho correlation analysis for ordinal data and the Kruskal-Wallis test for nominal data. The variables that reached the
pre-defined statistical significance level of p0.25 qualified for further investigation using multiple
linear regression analyses. In order to fit reasonable regression models all independent vari-ables were dichotomized. Dichotomizations were determined for each variable based on its response categories and the distribution of data. The dichotomized variables were then catego-rized in accordance with the four ICF-components (Body functions, Activities and participa-tion, Personal factors and Environmental factors) and one regression model created for each component, all with the FAI-CSC as the dependent variable. The regression models were
reduced manually using a stepwise backward method, until only significant (p<0.05) variables
remained. Finally, the independent variables that were identified as statistically significant pre-dictors in each of the four separate regression models were included in a combined model,
using the same stepwise backward method as before (p<0.05). This final model was also
con-trolled for potential confounders in terms of stroke severity, stroke type, cardiac disease, recur-rent stroke and pre-stroke education level. Residuals of the final regression model were tested
for normality using the Shapiro-Wilks test. Participants with missing data (seeTable 2) were
excluded but remained in all analyses where data was available. All analyses were undertaken using the IBM SPSS 22 software.
Ethics. The Lund Stroke Register has been approved by the Ethics Committee of Lund
University or the Regional Ethical Review Board in Lund several times related to different stud-ies. The 10-year follow-up was approved in May 2011 (No. 2011/278). Written informed con-sent was obtained from each participant or next of kin.
Table 2. (Continued)
Independent variables n (%) FAI-CSC Md (q1-q3) Spearman r p*
1 different sources of contact 4 (2.8) 1.5 (0–3.8)
None 1 (0.7) 0 (0–0)
FAI-CSC: The‘Community, social and civic life’sub-domain of the Frenchay Activities Index (score range 0–9) [32]. MMSE: Mini Mental State Examination [41]. GDS-20: Geriatric Depression Scale [42]. SF36: Medical Outcomes Study 36-Item Short-Form Health Survey [43]. BI: Barthel ADL Index [40].
Unless otherwise indicated, the questions are based on the Swedish Stroke Register (Riksstroke) 2-year follow-up survey [45].
aPart of a protocol inspired by Lindström et al 2001 [49]. bQuestion based on Hanson & Östergren 1987 [44]. cWith or without mobility devices.
15 missing. 22 missing.
31 missing (due to language dif
ficulties, severe aphasia, health problems or unwillingness to do the test).
*For dichotomized or nominal variables the p-value refers to the Kruskal Wallis test for difference between groups, and for ordinal variables the p-value refers to the Spearman test for correlation.
Results
The variation in FAI-CSC scores for the total sample spanned the entire score range (0–9),
with a mean score of 4.86 (SD 2.83). With the exception of two variables (use of public trans-port; having a particular person for support), the correlation analyses showed that most of the selected variables from the 16-month follow-up were related to the FAI-CSC score 10 years
after stroke (Table 2). The variables that qualified for inclusion in the multiple regression
anal-yses consisted of eight variables related to body functions, five related to activities and
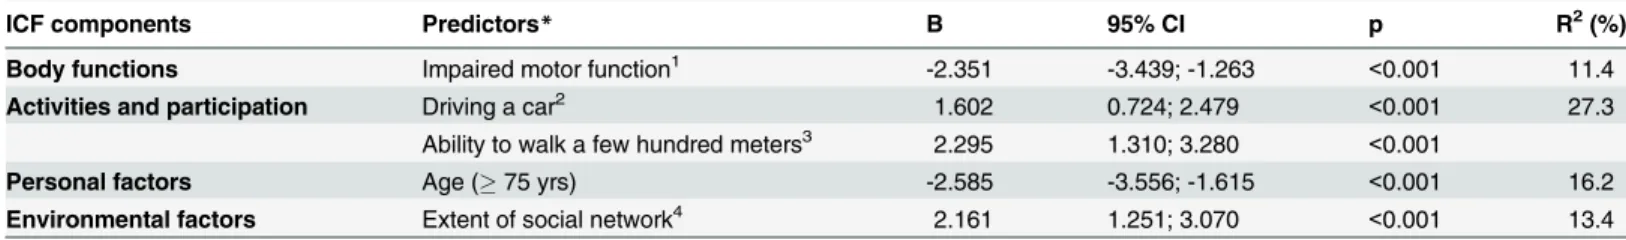
partici-pation, two to personal factors, and five to environmental factors (Table 3). Among the eight
independent variables of the body functions model, impaired motor function in both upper and lower extremities significantly predicted a lower frequency of social and leisure activities after 10 years. In the activities and participation model, driving a car and having the ability to walk a few hundred meters predicted a more positive 10-year outcome. Age was the single sig-nificant predictor in the personal factors model, where an age of 75 years or above was related to a lower frequency of social and leisure activities. In the model for environmental factors, having a wide social network predicted a more favorable 10-year outcome. The significant
pre-dictors identified in these four separate regression models are presented inTable 4. The
activi-ties and participation model showed the highest explanatory power (R2= 27.3%).
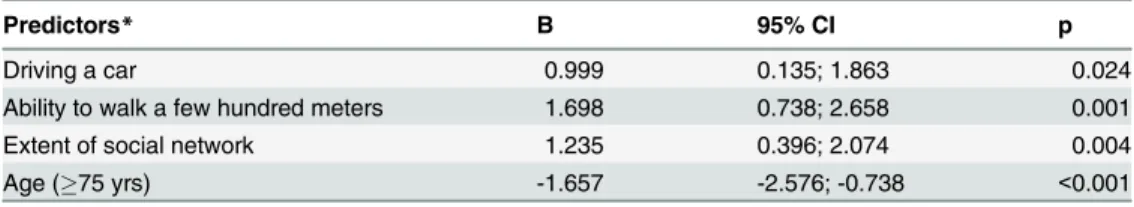
When the significant variables from all four models were combined into a final multiple
lin-ear regression model, four variables remained significant (Table 5). Driving a car (B = 0.999,
p = 0.024), ability to walk a few hundred meters (B = 1.698, p = 0.001) and extent of social net-work (B = 1.235, p = 0.004) had a positive effect on the outcome, whereas age had a negative
effect (B = -1.657, p =<0.001). The explanatory power (R2) of the final model was 36.9%.
When tested for potential confounders (stroke severity, stroke type, cardiac disease, recurrent stroke, education level) no significant change was detected in the coefficients of the final model. Residuals in the final regression model were normally distributed (Shapiro-Wilks test p = 0.484).
Discussion
The results of this follow-up study demonstrate that a wide range of factors assessed during the second year after a first-ever stroke is related to the frequency of social and leisure activities 10 years after the stroke. Some key factors, including car-driving, walking ability, social network and age, seem to be especially indicative of the long-term activity frequency.
Two out of the four final predictors identified in this study (i.e.‘Ability to walk a few
hun-dred meters’and‘Driving a car’) represent out-of-home mobility. These results could be
explained by the fact that the FAI-CSC mostly consists of out-of-home activities that may require some transportation. Walking distance has previously been described as central for
activity engagement both within home and in the community [50]. Similarly, several studies
have shown that loss of driver’s license after stroke has profound implications including
restricted community participation and social isolation [30,51]. However, our results also
sug-gest that the initial difficulties related to getting around after the stroke have been insufficiently compensated for over time. To avoid long-term inactivity, community accessibility is an important issue to address, especially considering that 26% of all stroke survivors in Sweden, and 40% of those over the age of 75, report dependence on others in outdoor mobility one year
after stroke [52]. White and co-workers [53] highlighted the importance of providing driving
assessments and information about the process of returning to driving or alternatives such as public transport prior to hospital discharge and at follow-ups. Following discharge,
commu-nity-based interventions should adress stroke survivors’ability to get around outside home
Table 3. The dichotomized independent variables included in the multiple regression analyses.
BODY FUNCTIONS ACTIVITIES AND PARTICIPATION PERSONAL
FACTORS
ENVIRONMENTAL FACTORS
Indication of cognitive impairment (MMSE) Driving a car Age Living situation
0) No (25) 0) No 0)<75 years 0) Living alone
1) Yes (<25) 1) Yes 1)75 years 1) Living with partner or other
person(s) Indication of depressive mood (GDS-20) Exercise frequency Gender Main occupation
0) No (5) 0)1/week 0) Women 0) Do not work/study
1) Yes (>5) 1)>1/week 1) Men 1) Work/study fulltime or part time
Impaired motor function Mobility Rehabilitation/training
0) No impairment, or only upper or lower
extremity 0) Independent indoors and outdoors 0) Unmet perceived need
1) Impaired function in both upper and lower
extremities 1) Dependent outdoors or both indoors/outdoors 1) Perceived need met
Speaking difficulties Ability to carry out pre-stroke interests Social contact frequency
0) No 0) No, hardly or never 0) Less than daily
1) Yes 1) Yes, as before or almost as before 1) Daily
Anger Ability to walk a few hundred meters Extent of social network
0) No 0) Very or slightly limited 0) 0–3 sources of contact
1) Yes 1) Not at all limited 1) 4–5 sources of contact
Anger
0) Almost never or sometimes 1) Often or constantly Pain
0) Almost never or sometimes 1) Often or constantly Tiredness
0) Almost never or sometimes 1) Often or constantly Urinary incontinence
0) Continent or occasional accident 1) Incontinent
MMSE: Mini Mental State Examination [41]. GDS-20: Geriatric Depression Scale [42].
doi:10.1371/journal.pone.0149395.t003
Table 4. ICF-component specific predictors of social and leisure activity frequency 10 years after stroke (N = 145).
ICF components Predictors* B 95% CI p R2(%)
Body functions Impaired motor function1 -2.351 -3.439; -1.263 <0.001 11.4
Activities and participation Driving a car2 1.602 0.724; 2.479 <0.001 27.3
Ability to walk a few hundred meters3 2.295 1.310; 3.280 <0.001
Personal factors Age (75 yrs) -2.585 -3.556; -1.615 <0.001 16.2
Environmental factors Extent of social network4 2.161 1.251; 3.070 <0.001 13.4
*Independent predictors identified by multiple regression analyses for each ICF-component.
10 = No impairments/impaired function in either upper or lower extremity, 1 = Impaired function in both upper and lower extremities. 20 = Does not drive (includes both those who drove before stroke and those who did not), 1 = Drives.
30 = Slightly or very limited, 1 = Not at all limited. 41 = 0
We also found that an age of 75 years or older at the 16 months follow-up predicted a lower frequency of social and leisure activities 10 years after the stroke. This is not surprising
consid-ering that engagement in leisure activities generally decreases with age [54]. Ageing with a
dis-ability may also lead to accelerated physical and cognitive impairments [55] and restrictions in
community participation [56]. In addition, high age is a risk factor for more severe strokes
[57]. However, even after controlling our final model for stroke severity the independent effect
of age on the long term activity level remained. Accordingly, our results indicate that stroke survivors over the age of 75 are a risk group for social and leisure inactivity that deserves special attention in stroke management and rehabilitation.
Another factor found to influence the 10-year activity frequency was the social network that the participants reported having at the 16-month follow-up. Having supportive social networks
has previously been linked to improved physical [58] and psychological [59] recovery after
stroke, and has been described as an important factor for community reintegration and
partici-pation [18]. Difficulties to maintain and acquire new social relationships after stroke have also
been described [18]. Out of the three variables related to the social network included in our
analyses (representing the number and frequency of social contacts and whether the partici-pants perceived that they had a particular person for support), the number of contacts was the only significant predictor of the long-term activity frequency. A wide social network may have acted as a buffer against social isolation over time and provided support which was beneficial for the long-term recovery and social reintegration. It may also be a reflection of the social activity level the participants had before their stroke, which is supported by ageing research
demonstrating previous activity habits as a strong predictor of activity later in life [54].
Unfor-tunately, we did not have access to information about the participants’social and leisure
activ-ity before the stroke or at the 16-month follow-up, which may have provided additional insights.
Even though most current stroke rehabilitation interventions are aimed at restoring body functions, our results indicate that such functions are not the most important predictors for the long-term activity frequency. However, it should be kept in mind that the 10-year survivors in this study on average were relatively young and had less severe strokes. Whether body func-tions would turn out as significant predictors in samples with more severe disabilities remains to be investigated. It could also be that long-term stroke survivors have adapted to and com-pensated for their impairments over time. The ability of the person to accept and adapt to their stroke-related problems have been found as central factors to engagement in social activities
[18] but research exploring the influence of such processes in a long-term perspective is
needed.
Table 5. Independent predictors of social and leisure activity frequency 10 years after stroke (N = 145).
Predictors* B 95% CI p
Driving a car 0.999 0.135; 1.863 0.024
Ability to walk a few hundred meters 1.698 0.738; 2.658 0.001
Extent of social network 1.235 0.396; 2.074 0.004
Age (75 yrs) -1.657 -2.576; -0.738 <0.001
*Based on the combined regression model including all four ICF-components. Explanatory power (R2) = 36.9%.
Methodological considerations
The population-based sample with low loss to follow-up and no dropouts from the 16-month to the 10-year follow-up is a noteworthy strength of the present study. The strong retention of participants was likely thanks to the great efforts put into localizing and contacting the
survi-vors, as well as the participants’previous contacts with the researcher who performed all
fol-low-ups. To avoid exclusion of survivors with cognitive or communicative difficulties, proxy respondents were used which may have influenced the results. Previous studies have demon-strated adequate agreement between patients and proxy respondents in assessment of risk fac-tors as well as activity measures after stroke and support the use of proxies to reduce sample
selection bias [60,61]. When needed, the presence of spouses or caregivers who knew the
par-ticipants well was considered to strengthen the validity of the results by helping the parpar-ticipants to provide more accurate descriptions of their current situations.
Furthermore, the study was based on comprehensive data about the life-situation 10 years after a first-ever stroke previously not described. The 10-year perspective enabled identification of factors that can be used to predict long-term outcomes at an early stage. After 16 months most of the participants had returned to their own home and the initial functional recovery plateaued, making this a relevant time for assessment of the predictors. Still, it may be objected that the extensive time period between the two follow-ups challenges interpretation of the results. During a 10-year period the consequences of stroke are hard to distinguish from those of ageing or from other disruptive life events (e.g., loss of a spouse, relocation, etc.). Also, devel-opments in healthcare and rehabilitation and changes in society may affect the long-term out-come. Therefore, the predictors should not be interpreted in terms of direct causality but they pinpoint areas that deserve further investigation. Generalizability of the findings to people hav-ing a stroke today may be limited due to changes in stroke care or other factors related to this specific sample and assessment period. Hence, more long-term studies in different regions and countries are needed to confirm our results.
Since the purpose of this study specifically concerned social and leisure activities we chose
to only use a sub-domain of the FAI, identified in a previous study using ICF-linking [32].
Rec-ognizing that this is not an established approach, we argue that it improved the validity com-pared to using the total FAI score which includes many other types of activities. We suggest that researchers actively reflect on the content of routinely used instruments such as the FAI. A limitation is that assessments based on the FAI only provide information about the frequency of performing activities. Future studies should also include aspects such as the perceived mean-ing and value of activities since this likely contributes to why people prioritize certain activities over others. It should also be noticed that the three items of the FAI-CSC only target some aspects of social and leisure activities, and for a more complete picture of engagement in other areas of community, social and civic life, complementing assessments could be considered.
Turning to the statistical analyses, since engagement in social and leisure activities is a com-plex and dynamic process it was considered important to cover a wide range of potential
pre-dictors that represented all four ICF-components [31]. The selection of independent variables
was based on previous quantitative and qualitative research reviewed in the Introduction sec-tion and on the experiences of the co-authors representing several different disciplines. The four ICF component-specific regression models served to reduce the number of variables included in the final model while allowing for variables from all four components to be repre-sented based on systematic analyses.
aimed to improve interpretability and create statistically sound regression models. For the MMSE and the GDS-20 established cut-off levels were used to create the dichotomized vari-ables. Using the continuous data could have yielded different results, but the results would also have been more difficult to translate to a clinical setting. The same considerations were made regarding the dichotomization of the age variable. Based on the distribution of data, a cut-off at 75 years most clearly demonstrated the age-related differences in activity level. Furthermore, dichotomizing all independent variables facilitates interpretation of the relative weight of each predictor.
Conclusions
The results indicate that out-of-home mobility and social network resources are likely impor-tant factors for the long-term frequency of social and leisure activities after a stroke. Conse-quently, these aspects deserve further attention in research and interventions aimed at
improving the health and well-being of stroke survivors in a long-term perspective. Also, stroke survivors over the age of 75 years should receive special attention due to the higher prevalence of inactivity in this group. Research that further explores the long-term processes related to social and leisure activity after stroke is needed to further explain the findings of this study.
Acknowledgments
We would like to thank the participants that willingly participated in the follow-up. Thanks are also extended to LicSc V. Horstmann for valuable statistical advice.
Author Contributions
Analyzed the data: AN EC. Contributed reagents/materials/analysis tools: AJ AL. Wrote the paper: AN EC. Data collection/patient assessments: AJ. PI for Lund Stroke Register: AL. Con-tributed to the design of the study: AN EC AJ EML AS AL SI. Critically revised and approved the work throughout the process: AN EC AJ EML AS AL SI.
References
1. Adamson J, Beswick A, Ebrahim S. Is stroke the most common cause of disability? J Stroke Cerebro-vasc Dis. 2004; 13(4):171–7. PMID:17903971
2. Persson J, Ferraz-Nunes J, Karlberg I. Economic burden of stroke in a large county in Sweden. BMC Health Serv Res. 2012; 12:341. doi:10.1186/1472-6963-12-341PMID:23013284
3. Zhang Y, Chapman AM, Plested M, Jackson D, Purroy F. The Incidence, Prevalence, and Mortality of Stroke in France, Germany, Italy, Spain, the UK, and the US: A Literature Review. Stroke Res Treat. 2012; 2012:436125. doi:10.1155/2012/436125PMID:22550614
4. Go AS, Mozaffarian D, Roger VL, Benjamin EJ, Berry JD, Blaha MJ, et al. Heart disease and stroke sta-tistics—2014 update: a report from the American Heart Association. Circulation. 2014; 129(3):e28–
e292. doi:10.1161/01.cir.0000441139.02102.80PMID:24352519
5. Ovbiagele B, Goldstein LB, Higashida RT, Howard VJ, Johnston SC, Khavjou OA, et al. Forecasting the future of stroke in the United States: a policy statement from the American Heart Association and American Stroke Association. Stroke. 2013; 44(8):2361–75. doi:10.1161/STR.0b013e31829734f2 PMID:23697546
6. Skolarus LE, Burke JF, Brown DL, Freedman VA. Understanding stroke survivorship: expanding the concept of poststroke disability. Stroke. 2014; 45(1):224–30. doi:10.1161/STROKEAHA.113.002874 PMID:24281223
7. Jansen HE, Schepers VP, Visser-Meily JM, Post MW. Social activity one and three years post-stroke. J Rehabil Med. 2012; 44(1):47–50. doi:10.2340/16501977-0908PMID:22124636
8. Rosengren A, Giang KW, Lappas G, Jern C, Toren K, Bjorck L. Twenty-four-year trends in the inci-dence of ischemic stroke in sweden from 1987 to 2010. Stroke. 2013; 44(9):2388–93. doi:10.1161/
9. Hardie K, Hankey GJ, Jamrozik K, Broadhurst RJ, Anderson C. Ten-year risk of first recurrent stroke and disability after first-ever stroke in the Perth Community Stroke Study. Stroke. 2004; 35(3):731–5.
PMID:14764929
10. Kiyohara Y, Kubo M, Kato I, Tanizaki Y, Tanaka K, Okubo K, et al. Ten-year prognosis of stroke and risk factors for death in a Japanese community: the Hisayama study. Stroke. 2003; 34(10):2343–7. PMID:14500930
11. Wolfe C, Rudd A, Mckevitt C, Heuschmann P, Kalra L. Top ten priorities for stroke services research: a summary of the analysis of research for the national stroke strategy. Kings College London: University of London, 2007.
12. Wolfe C, Crichton S, Heuschmann P, McKevitt C, Toschke A. Estimates of Outcomes Up to Ten Years after Stroke: Analysis from the Prospective South London Stroke Register. PLoS Med. 2011; 8(5). 13. Brunborg B, Ytrehus S. Sense of well-being 10 years after stroke. J Clin Nurs. 2014; 23(7–8):1055–63.
doi:10.1111/jocn.12324PMID:24004444
14. Boosman H, Schepers VP, Post MW, Visser-Meily JM. Social activity contributes independently to life satisfaction three years post stroke. Clin Rehabil. 2011; 25(5):460–7. doi:10.1177/0269215510388314 PMID:21059668
15. Sveen U, Thommessen B, Bautz-Holter E, Wyller TB, Laake K. Well-being and instrumental activities of daily living after stroke. Clin Rehabil. 2004; 18(3):267–74. PMID:15137558
16. Venna V, McCullough L. Role of social factors on cell death, cerebral plasticity and recovery after stroke. Metab Brain Dis. 2015; 30(2):497–506. doi:10.1007/s11011-014-9544-1PMID:24748365 17. Kuluski K, Dow C, Locock L, Lyons RF, Lasserson D. Life interrupted and life regained? Coping with
stroke at a young age. Int J Qual Stud Health Well-being. 2014; 9:22252. doi:10.3402/qhw.v9.22252 PMID:24461569
18. Woodman P, Riazi A, Pereira C, Jones F. Social participation post stroke: a meta-ethnographic review of the experiences and views of community-dwelling stroke survivors. Disabil Rehabil. 2014; 36 (24):2031–43. doi:10.3109/09638288.2014.887796PMID:24597937
19. Desrosiers J, Noreau L, Rochette A, Bourbonnais D, Bravo G, Bourget A. Predictors of long-term partic-ipation after stroke. Disabil Rehabil. 2006; 28(4):221–30. PMID:16467057
20. Schepers VP, Visser-Meily AM, Ketelaar M, Lindeman E. Prediction of Social Activity 1 Year Post-stroke. Arch Phys Med Rehabil. 2005; 86(7):1472–6. PMID:16003683
21. Desrosiers J, Demers L, Robichaud L, Vincent C, Belleville S, Ska B. Short-term changes in and predic-tors of participation of older adults after stroke following acute care or rehabilitation. Neurorehabil Neu-ral Repair. 2008; 22(3):288–97. PMID:17916657
22. Gadidi V, Katz-Leurer M, Carmeli E, Bornstein NM. Long-term outcome poststroke: predictors of activity limitation and participation restriction. Arch Phys Med Rehabil. 2011; 92(11):1802–8. doi:10.1016/j. apmr.2011.06.014PMID:22032214
23. Cooper CL, Phillips LH, Johnston M, Whyte M, MacLeod MJ. The role of emotion regulation on social participation following stroke. Br J Clin Psychol. 2014.
24. Edwards DF, Hahn M, Dromerick A. Post stroke urinary loss, incontinence and life satisfaction: when does post-stroke urinary loss become incontinence? Neurourol Urodyn. 2006; 25(1):39–45. PMID: 16299814
25. Obembe AO, Eng JJ. Rehabilitation Interventions for Improving Social Participation After Stroke: A Sys-tematic Review and Meta-analysis. Neurorehabil Neural Repair. 2015.
26. Anderson S, Whitfield K. An ecological approach to activity after stroke: it takes a community. Top Stroke Rehabil. 2011; 18(5):509–24. doi:10.1310/tsr1805-509PMID:22082701
27. Anderson S, Whitfield K. Social identity and stroke: 'they don't make me feel like, there's something wrong with me'. Scand J Caring Sci. 2013; 27(4):820–30. doi:10.1111/j.1471-6712.2012.01086.x PMID:23121474
28. Walsh ME, Galvin R, Loughnane C, Macey C, Horgan NF. Factors associated with community reinte-gration in the first year after stroke: a qualitative meta-synthesis. Disabil Rehabil. 2015; 37(18):1599–
608. doi:10.3109/09638288.2014.974834PMID:25382215
29. Walsh M, Galvin R, Loughnane C, Macey C, Horgan F. Facilitators and barriers of getting back to active living post-stroke: Results of a national survey. Ir J Med Sci. 2014; 183(7):303.
30. Liddle J, Turpin M, McKenna K, Kubus T, Lambley S, McCaffrey K. The experiences and needs of peo-ple who cease driving after stroke. Brain Impair. 2009; 10(3):271–81.
32. Norlander A JA, Ståhl A, Lindgren A, Iwarsson S. Activity among long-term stroke survivors. A study
based on an ICF-oriented analysis of two established ADL and social activity instruments. Disabil Rehabil. 2015 (In press).
33. Hallström B, Jönsson AC, Nerbrand C, Petersen B, Norrving B, Lindgren A. Lund Stroke Register: hos-pitalization pattern and yield of different screening methods for first-ever stroke. Acta Neurol Scand. 2007; 115(1):49–54. PMID:17156265
34. Jönsson AC, Lindgren I, Hallström B, Norrving B, Lindgren A. Determinants of quality of life in stroke survivors and their informal caregivers. Stroke. 2005; 36(4):803–8. PMID:15761203
35. Hatano S. Experience from a multicentre stroke register: a preliminary report. Bull World Health Organ. 1976; 54(5):541–53. PMID:1088404
36. Brott T, Adams HP Jr., Olinger CP, Marler JR, Barsan WG, Biller J, et al. Measurements of acute cere-bral infarction: a clinical examination scale. Stroke. 1989; 20(7):864–70. PMID:2749846
37. Wendel KA, Ståhl A, Iwarsson S. Inter-rater agreement of a modified and extended Swedish version of
the Frenchay Activities Index (FAI). Eur J Ageing. 2013; 10(3):247–55.
38. Muir KW, Lees KR, Ford I, Davis S. Magnesium for acute stroke (Intravenous Magnesium Efficacy in Stroke trial): randomised controlled trial. Lancet. 2004; 363(9407):439–45. PMID:14962524
39. Jönsson AC, Delavaran H, Iwarsson S, Ståhl A, Norrving B, Lindgren A. Functional Status and
Patient-Reported Outcome 10 Years After Stroke: The Lund Stroke Register. Stroke. 2014; 45:1784–90. doi: 10.1161/STROKEAHA.114.005164PMID:24803595
40. Mahoney F, Barthel D. Functional evaluation: The Barthel Index. Md State Med J. 1965; 14:61–5. 41. Folstein MF, Folstein SE, McHugh PR. "Mini-mental state". A practical method for grading the cognitive
state of patients for the clinician. J Psychiatr Res. 1975; 12(3):189–98. PMID:1202204
42. Gottfries GG, Noltorp S, Norgaard N. Experience with a Swedish version of the Geriatric Depression Scale in primary care centres. Int J Geriatr Psychiatry. 1997; 12(10):1029–34. PMID:9395935 43. Sullivan M, Karlsson J, Ware JE Jr. The Swedish SF-36 Health Survey—I. Evaluation of data quality,
scaling assumptions, reliability and construct validity across general populations in Sweden. Soc Sci Med. 1995; 41(10):1349–58. PMID:8560302
44. Hanson BS, Östergren PO. Different social network and social support characteristics, nervous prob-lems and insomnia: Theoretical and methodological aspects on some results from the population study 'men born in 1914', Malmö, Sweden. Soc Sci Med. 1987; 25(7):849–59. PMID:3686113
45. Follow-up 2 years after stroke: Swedish Stroke Register 'Riksstroke';. Available:http://www.riksstroke. org/sve/riksstroke-%20registreringsplattform/formular/. Accessed 6 May 2015.
46. Piercy M, Carter J, Mant J, Wade DT. Inter-rater reliability of the Frenchay Activities Index in patients with stroke and their carers. Clin Rehabil. 2000; 14(4):433–40. PMID:10945428
47. Wade DT, Legh-Smith J, Langton Hewer R. Social activities after stroke: measurement and natural his-tory using the Frenchay Activities Index. Int Rehabil Med. 1985; 7(4):176–81. PMID:4093249 48. Iverson GL. Interpretation of Mini-Mental State Examination scores in community-dwelling elderly and
geriatric neuropsychiatry patients. Int J Geriatr Psychiatry. 1998; 13(10):661–6. PMID:9818300 49. Lindstrom M, Hanson BS, Ostergren PO. Socioeconomic differences in leisure-time physical activity:
the role of social participation and social capital in shaping health related behaviour. Soc Sci Med. 2001; 52(3):441–51. PMID:11330778
50. Combs SA, Van Puymbroeck M, Altenburger PA, Miller KK, Dierks TA, Schmid AA. Is walking faster or walking farther more important to persons with chronic stroke? Disabil Rehabil. 2013; 35(10):860–7. doi:10.3109/09638288.2012.717575PMID:23035811
51. Marottoli RA, Mendes de Leon CF, Glass TA, Williams CS, Cooney LM Jr., Berkman LF. Conse-quences of driving cessation: Decreased out-of-home activity levels. J Gerontol B Psychol Sci Soc Sci. 2000; 55B(6):334–40.
52. Swedish Stroke Register (Riksstroke). Ettår efter stroke. 1-årsuppföljning 2013—Livssituation,
tillgodo-sedda behov och resultat av vårdens och omsorgens insatser för de som insjuknat under 2012; 2013
(rev. nov 2014). Available: http://www.riksstroke.org/wp-content/uploads/2014/06/Ett-%C3%A5r-efter-stroke-2013.-Reviderad-November-2014.pdf. Accessed 1 July 2015.
53. White JH, Miller B, Magin P, Attia J, Sturm J, Pollack M. Access and participation in the community: a prospective qualitative study of driving post-stroke. Disabil Rehabil. 2012; 34(10):831–8. doi:10.3109/ 09638288.2011.623754PMID:22035162
54. Agahi N, Ahacic K, Parker MG. Continuity of leisure participation from middle age to old age. J Gerontol B Psychol Sci Soc Sci. 2006; 61(6):S340–6. PMID:17114314
56. Molton IR, Jensen MP. Aging and disability: biopsychosocial perspectives. Phys Med Rehabil Clin N Am. 2010; 21(2):253–65. doi:10.1016/j.pmr.2009.12.012PMID:20494275
57. Sohrabji F, Bake S, Lewis DK. Age-related changes in brain support cells: Implications for stroke sever-ity. Neurochem Int. 2013; 63(4):291–301. doi:10.1016/j.neuint.2013.06.013PMID:23811611 58. Colantonio A, Kasl SV, Ostfeld AM, Berkman LF. Psychosocial predictors of stroke outcomes in an
elderly population. J Gerontol. 1993; 48(5):261–8.
59. Knapp PH, Hewison J. The protective effects of social support against mood disorder after stroke. Psy-chol Health Med. 1998; 3(3):275–83.
60. Capelle LG, Vlak MH, Algra A, Rinkel GJ. Comparison of patient and proxy responses on risk factors for stroke. Acta Neurol Scand. 2011; 123(3):160–6. doi:10.1111/j.1600-0404.2010.01389.xPMID: 20545632