HESSD
7, 135–177, 2010Soil erosion areas in the Blue Nile-Eastern
Sudan
M. El Haj El Tahir et al.
Title Page
Abstract Introduction
Conclusions References
Tables Figures
◭ ◮
◭ ◮
Back Close
Full Screen / Esc
Printer-friendly Version
Interactive Discussion Hydrol. Earth Syst. Sci. Discuss., 7, 135–177, 2010
www.hydrol-earth-syst-sci-discuss.net/7/135/2010/ © Author(s) 2010. This work is distributed under the Creative Commons Attribution 3.0 License.
Hydrology and Earth System Sciences Discussions
This discussion paper is/has been under review for the journal Hydrology and Earth System Sciences (HESS). Please refer to the corresponding final paper in HESS if available.
Identification and mapping of soil erosion
areas in the Blue Nile-Eastern Sudan
using multispectral ASTER and MODIS
satellite data and the SRTM elevation
model
M. El Haj El Tahir, A. K ¨a ¨ab, and C.-Y. Xu
Department of Geosciences, University of Oslo, P.O. Box 1047 Blindern, 0316 Oslo, Norway Received: 2 December 2009 – Accepted: 11 December 2009 – Published: 12 January 2010 Correspondence to: M. El Haj El Tahir ([email protected])
HESSD
7, 135–177, 2010Soil erosion areas in the Blue Nile-Eastern
Sudan
M. El Haj El Tahir et al.
Title Page
Abstract Introduction
Conclusions References
Tables Figures
◭ ◮
◭ ◮
Back Close
Full Screen / Esc
Printer-friendly Version
Interactive Discussion
Abstract
This paper is part of a set of studies to evaluate the spatial and temporal variability of soil water in terms of natural as well as land-use changes as fundamental factors for vegetation regeneration in arid ecosystems in the Blue Nile-Sudan. The specific aim is to indicate the spatial distribution of soil erosion caused by the rains of 2006. The
5
current study is conducted to determine whether automatic classification of multispec-tral Advanced Space borne Thermal Emission and Reflection Radiometer (ASTER) imagery could accurately discriminate erosion gullies. Shuttle Radar Topography Mis-sion (SRTM) is used to orthoproject ASTER data. A maximum likelihood classifier is trained with four classes, Gullies, Flat Land, Mountains and Water and applied to
10
images from March and December 2006. Validation is done with field data from De-cember and January 2006/2007, and using drainage network analysis of SRTM digital elevation model. The results allow the identification of erosion gullies and subsequent estimation of eroded area. Consequently the results were up-scaled using Moderate Resolution Imaging Spectroradiometer (MODIS) images of the same dates. Because
15
the selected study site is representative of the wider Blue Nile province, it is expected that the approach presented could be applied to larger areas.
1 Introduction
This paper is the second (the first is Xu et al., 2009) in a set of studies to evaluate the spatial and temporal variability of soil water in terms of natural factors as well as
land-20
use changes as fundamental factors for vegetation regeneration in arid ecosystems in the Blue Nile-Eastern Sudan. This study is concerned with evaluating the spatial dis-tribution of soil erosion as one of the implications of climate and land-use changes in the study region. Such an evaluation of soil degradation is regarded as an important initial inventory in order to further assess its soil water content status (Gomer and Vogt,
25
HESSD
7, 135–177, 2010Soil erosion areas in the Blue Nile-Eastern
Sudan
M. El Haj El Tahir et al.
Title Page
Abstract Introduction
Conclusions References
Tables Figures
◭ ◮
◭ ◮
Back Close
Full Screen / Esc
Printer-friendly Version
Interactive Discussion crust disturbance, and global climatic changes that increase ambient temperature and
reduce or increase precipitation. Reduction of precipitation causes reduction of plant growth and consequently leads to increases in erosion rates. Similarly, increasing pre-cipitation can also be a climate change result, and can enhance erosion as well (Craw-ford and Gosz, 1982; Evenari et al., 1982; Schlesinger et al., 1996). Or it could happen
5
as a natural process. It is important to differentiate between natural and anthropogenic causes of erosion because we have little control over the former process. Only once natural and anthropogenic sources of erosion have been differentiated will it be possi-ble to develop adequate erosion control policies against anthropogenic erosion. The most important factors controlling erosion are rainfall regime, vegetation cover, terrain
10
slope and soil type (Linsley et al., 1982). Fluctuating rainfall amounts and intensities have significant impacts on soil erosion rates. Where rainfall amounts increase, ero-sion and runoffincrease at an even greater rate. Decreasing annual rainfall triggers system feedbacks related to the decreased biomass production that lead to greater susceptibility of the soil to erode (Nearing et al., 2004). Because of the important role
15
of direct rain drop impact, vegetation provides significant protection against erosion by absorbing the energy of the falling drops and generally reducing the drop sizes, which reach the ground. Vegetation may also provide mechanical protection to the soil against gully erosion via the root system. In addition, an adequate vegetation cover generally improves infiltration through the addition of organic matter to the soil. Higher
20
infiltration capacity means less overland flow and consequently less erosion potential. Rates of erosion are greater on steep slopes than on flat slopes. The steeper the slope the more effective splash slope erosion is in moving soil down slope. Overland flow velocities are also greater on steep slopes, and mass movements are more likely to occur in steep terrain. Length of slope is also important. The shorter the slope length,
25
HESSD
7, 135–177, 2010Soil erosion areas in the Blue Nile-Eastern
Sudan
M. El Haj El Tahir et al.
Title Page
Abstract Introduction
Conclusions References
Tables Figures
◭ ◮
◭ ◮
Back Close
Full Screen / Esc
Printer-friendly Version
Interactive Discussion lumbering may also increase the erosion hazard. Proper soil conservation practices
may greatly reduce erosion losses.
Arid and semi-arid regions are particularly susceptible to soil erosion due to their low plant cover (Bull, 1981). In time, such soil erosion also results in the loss of soil nutri-ents, particularly carbon and nitrogen (West, 1991; Mokwunye, 1996), due to the
re-5
strictions of feedbacks in carbon and nitrogen cycles between plants, atmosphere and soil (Schlesinger et al., 1990). Considerable literature (Thornes, 1990; Ayoub, 1998; Nakileza et al., 1999; Symeonakis and Drake, 2004) point to the widespread natural resource degradation especially in sub-Saharan Africa, including Sudan. The area of the Upper Blue Nile in Eastern Sudan was considered prone to degradation by
(Syme-10
onakis and Drake, 2004). The reasons for this degradation among others are the rapid human population growth placing pressure on land resources through intensive cultiva-tion, and encroachment on marginal lands. Drought, natural or human-induced reduc-tion in vegetareduc-tion cover, poor agricultural practices leading to soil aggregate breakdown and soil organic matter losses, poor irrigation practices leading to salinization, all lead
15
to an increase in soil erosion rates and, ultimately, desertification. Erosion, therefore, seems to be the single most important indicator of the desertification process.
The objectives of this study are (1) to identify the erosion areas using multispectral satellite images from the Advanced Spaceborne Thermal Emission and Reflection Ra-diometer ASTER sensor together with field work data and (2) to upscale and map the
20
spatial distribution of soil erosion area changes using Moderate Resolution Imaging Spectroradiometer MODIS.
To achieve these objectives, a qualitative erosion identification and mapping ap-proach is developed in the study based on adaptations to the regional characteristics of the study area and the availability of data.
HESSD
7, 135–177, 2010Soil erosion areas in the Blue Nile-Eastern
Sudan
M. El Haj El Tahir et al.
Title Page
Abstract Introduction
Conclusions References
Tables Figures
◭ ◮
◭ ◮
Back Close
Full Screen / Esc
Printer-friendly Version
Interactive Discussion
2 Study area and data
2.1 Description of study area
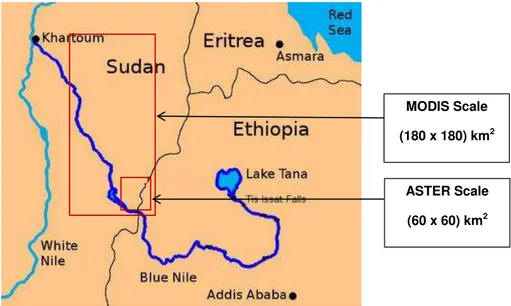
The study area lies between latitudes 10◦ and 14◦N and longitudes 33◦ and 34◦E (Fig. 1). It portrays different land use types including agriculture, forests and range areas. Agriculture forms are small holdings, mechanized and river bank farming. The
5
area is bounded by Sennar town in the north and Ed Damazin town in the south and traversed by the Blue Nile. It exhibits high land cover variability. It includes for example the Ar Roseris power dam and its lake. There are a number of forests for example the Okalma forest reserve which is bound by Jabal Okalma (Jabal is the local Arabic word for mountain) on the west and Jabal Zign (400 m a.s.l.) on the south east corner. Both
10
mountains constitute a source of sheet floods towards the Okalma forest reserve. The forest reserve is a natural forest composed of a mixture of trees, mainly Acacia seyal and Balanites aegyptiaca plus other species. There is large variation of age groups from young new regeneration to large groups of forest stands following abandonment of agricultural cropping. The forest is related to the surrounding societies providing
15
diversified benefits from the trees and the land. Regeneration and forest development factors are evident. Other areas are abandoned fallow land. To the south-east there is the seasonal Khor Dunya (a gully is locally known as Khor, the Arabic word for seasonal water course) running from south west to north east until it joins the Blue Nile at a point 35 km north of Ed Damazin town. Khor Dunya represents a catchment
20
area with the Ingessana Hills south of the catchment area acting as the source of
theKhor. Bordering Ed Damazin from south and west is Khor Dunya forest reserve,
a natural forest composed of a variety of tree species, and traversed by Khor Dunya seasonal water. ThisKhoris characterised by the presence of degraded areas, natural regeneration, human activities such as agriculture, pastoralism and small settlements,
25
HESSD
7, 135–177, 2010Soil erosion areas in the Blue Nile-Eastern
Sudan
M. El Haj El Tahir et al.
Title Page
Abstract Introduction
Conclusions References
Tables Figures
◭ ◮
◭ ◮
Back Close
Full Screen / Esc
Printer-friendly Version
Interactive Discussion Observed data indicate that the mean annual precipitation in 2006 was 900 mm, of
which around 90% is collected during the rainy season (April–October). For erosion we are interested in the inter-annual and not the annual total of rainfall. The maximum two or three rainy days in 2006 are of interest because it is the maximum rainfall that causes erosion. The maximum rainfall occurred on 8 and 10 May with precipitation
5
levels as high as 109.2 mm and 200.6 mm, respectively. The mean annual temperature is 28.8◦C. The lowest daily mean temperature is 13◦C and is measured in December. The highest mean daily temperature is 43.8◦C and is measured in May. The runoff coefficient is 20–30% (Ahmed et al., 2006). The year 2006 was an exceptionally wet year. The normal mean annual rainfall is 500 mm (Abdulkarim, 2006).
10
Economic impacts of gully erosion in the study region
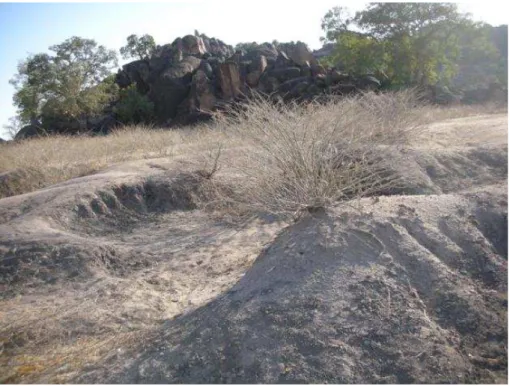
Although erosion in the centre of the gully is visually apparent (Fig. 2), its effects are not always detectable in terms of changes in soil quality (Ward et al., 2001). This indicates how geomorphologically-apparent desertification (Nir and Klein, 1974; Rozin and Schick, 1996) and changes in soil nutrient content are not necessarily congruent.
15
Nonetheless, a decline in soil nutrients was recorded in some of the most important soil variables, and thus is likely to significantly impact plant growth. Although the major erosion is usually in the centre of the gully in a strip that is only 5–30 m wide, most plant biomass and species diversity is as well concentrated there (Ward and Olsvig-Whittaker, 1993). Moreover, the concentration of the water current in the central erosion
20
gully necessarily reduces the water flow to the adjoining sides of the valley during floods. As a consequence of this reduction in water availability, leaching of salts is reduced (Shalhevet and Bernstein, 1968; Dan et al., 1973; Dan and Yaalon, 1982; Dan and Koyumdjisky, 1987) and soil salinity increases on the sides of the valley. Thus, even in the soil that remains un-eroded, soil quality declines over time.
HESSD
7, 135–177, 2010Soil erosion areas in the Blue Nile-Eastern
Sudan
M. El Haj El Tahir et al.
Title Page
Abstract Introduction
Conclusions References
Tables Figures
◭ ◮
◭ ◮
Back Close
Full Screen / Esc
Printer-friendly Version
Interactive Discussion
2.2 Data selection and processing
Nowadays there is a vast reservoir of remote sensing data, some freely available and easily downloadable from the internet. Remote sensing data are described in terms of spatial resolution, temporal resolution, timing, section of the electromagnetic spec-trum, stereo, interferometric or ranging capability, and usability (K ¨a ¨ab et al., 2005c).
5
Two types of satellite images are used in this study: Advanced Spaceborne Ther-mal Emission and Reflection Radiometer (ASTER) and Moderate Resolution Imaging Spectroradiometer (MODIS). In addition, a digital elevation model (DEM) provided by Shuttle Radar Topography Mission (SRTM) was used. Table 1 summarises the data characteristics. The softwares used are PCI Geomatica version 10.1 and ArcGIS
ver-10
sion 9.3.
2.2.1 ASTER Data
ASTER is a medium-resolution multispectral satellite sensor on the National Aeronau-tics and Space Administration (NASA) Terra spacecraft, incorporating also an along-track stereo sensor. The latter has stereo angle of about 28◦ directed backwards.
15
ASTER has 3 NADIR cameras with bands 1–3 in the visible and near infrared (VNIR), bands 4–9 in the short-wave infrared (SWIR), bands 10–14 in the thermal infrared (TIR). It also has a back-looking stereo camera (band 3B). The five ASTER thermal in-frared bands (TIR), i.e. B10–B14, are not used in this study. The nadir channel 3N and the back-looking channel 3B are used to generate photogrammetric DEMs. The time
20
difference between the nadir and the back-looking acquisition is about 1 min (Toutin, 2001c). Moreover, the reasonable image swath of 60 km allows gully identification over wide regions. The raw data is retrieved in HDF (hierarchical data format) formats. It contains image data, ancillary data (date, time, orbits, positions, angles, sensor and satellite settings, etc.), and meta-data. Terra is preferred to Aqua because it registers
25
HESSD
7, 135–177, 2010Soil erosion areas in the Blue Nile-Eastern
Sudan
M. El Haj El Tahir et al.
Title Page
Abstract Introduction
Conclusions References
Tables Figures
◭ ◮
◭ ◮
Back Close
Full Screen / Esc
Printer-friendly Version
Interactive Discussion one hand marks the end of the dry season. The rainy season usually begins in early
April. December on the other hand is characterised by high soil moisture conditions since it is just towards the very end of the rainy season. It is also characterised by vigorous seasonal and permanent vegetation growth. The scenes were selected for dates with no cloud cover.
5
2.2.2 MODIS Data
At a continental or global scale, coarse spatial resolution data such as from MODIS are preferable because they cover much larger spatial scales simultaneously. A com-bination of multi-sensor data with various image characteristics is usually beneficial to the research (Lefsky and Cohen, 2003). MODIS Terra 13Q data version v005, level
10
2B (available from http://lpdaac.usgs.gov/faq ecsftp.asp), is used. Two MODIS images dating to 22 March 2006 and 19 December 2006 are used. The first image is a 16-days average of daily images between the period 14 to 30 March 2006 and the second is a 16-days average of daily images between the periods 2 to 18 December 2006. MODIS products of versions 4 or higher have been validated and approved for
scien-15
tific research. Each image has 11 data layers originally. Of these 11 layers, only 6 data layers are used. The layers used are: 1, 2, 5, 6, 7, and 8 which correspond to Normalised Difference Vegetation index (NDVI), Enhanced vegetation index (EVI), red reflectance, Near infra red (NIR) reflectance, blue reflectance and medium infra red (MIR) reflectance, respectively.
20
MODIS vegetation indices (VIs) are found to be sensitive to seasonal vegetation vari-ations, land cover varivari-ations, and biophysical parameter variations. Both the NDVI and EVI demonstrate a good dynamic range and sensitivity for monitoring and assessing spatial and temporal variations in vegetation amount and condition (Huete et al., 2002). Whereas the NDVI is chlorophyll sensitive, the EVI is more responsive to canopy
25
HESSD
7, 135–177, 2010Soil erosion areas in the Blue Nile-Eastern
Sudan
M. El Haj El Tahir et al.
Title Page
Abstract Introduction
Conclusions References
Tables Figures
◭ ◮
◭ ◮
Back Close
Full Screen / Esc
Printer-friendly Version
Interactive Discussion global vegetation studies and improve upon the detection of vegetation changes.
NDVI=(ρNIR−ρred) (ρNIR−ρred)
Where:ρNIR andρred are the surface bidirectional reflectance factors for their respec-tive MODIS bands. NDVI is successful as a vegetation measure in that it is sufficiently stable to permit meaningful comparisons of seasonal and inter-annual changes in
veg-5
etation growth and activity. The strength of the NDVI is in its rationing concept, which reduces many forms of multiplicative noise (illumination differences, cloud shadows, atmospheric attenuation, and certain topographic variations) present in multiple bands. The Enhanced Vegetation Index (EVI) is a slight derivation from NDVI as it includes one additional spectral band, but no other peripheral data. EVI is designed to improve
10
on NDVI by addressing the weaknesses in NDVI attributed to backscatter and satura-tion.
EVI= G(ρNIR−ρred)
({ρNIR+C1ρred} − {C2ρblue+L})
Where: G is a gain factor. L is the canopy background adjustment, and C1, C2 are the coefficients of the aerosol resistance term, which uses the blue band to correct for
15
aerosol influences in the red band.
2.2.3 SRTM Data
Shuttle Radar Topography Mission (SRTM) is a single-pass InSAR, it provides eleva-tion data on a near-global scale (between 60◦N and 54◦S), it is the most complete high-resolution digital topographic database of Earth, date February 2000, 90 m
res-20
olution and 10–20 m vertical accuracy. It has gaps in it that resulted from shadow, SRTM3 is freely available. Where available, the SRTM indeed represents a revolution-ary data set for all kinds of terrain studies, in particular also for high-mountain hazard assessments (K ¨a ¨ab et al., 2005c). However, due to radar shadow, foreshortening, lay-over and insufficient interferometric coherence, the SRTM DTM has significant voids
HESSD
7, 135–177, 2010Soil erosion areas in the Blue Nile-Eastern
Sudan
M. El Haj El Tahir et al.
Title Page
Abstract Introduction
Conclusions References
Tables Figures
◭ ◮
◭ ◮
Back Close
Full Screen / Esc
Printer-friendly Version
Interactive Discussion in high mountains. In such cases, the fusion between spaceborne photogrammetric
DTMs and the SRTM DTM is regarded as a promising approach.
3 Methodology
3.1 Method overview
Common erosion mapping techniques integrate products derived from satellite remote
5
sensing with additional data sources. These techniques include quantitative erosion models (e.g., Thornes, 1985; Zhang et al., 2002; Symeonakis and Drake, 2004) and qualitative methods (e.g., Liu et al., 2000, 2004; Vrieling et al., 2002, 2007). The draw-backs of quantitative erosion models include among others fixed and intensive data requirement (Vrieling, 2006). Therefore, a more general qualitative erosion mapping
10
approach is used here based on adaptations to the regional characteristics of the study area and the availability of data. This approach is derived from fusion between remote sensing data and geographical information systems (GIS). GIS has proved to be a par-ticularly useful tool where topographic information (e.g. DEMs and their derivatives) has to be combined with remotely sensed image data and in change detection applications,
15
in particular when multi-source data are used. The flow diagram in Fig. 3 summaries the method used in developing this qualitative erosion area model. Briefly speaking, the study area (Fig. 1) is divided into two scales. One is a 60×60 km scale (approx. 3600 km2) and studied using two different ASTER images from March and December 2006. The other is a 180×180 km regional scale (approx. 32 400 km2) and studied
20
using MODIS data. The ASTER images are first accurately orthorectified using SRTM DEM before being used for classification. The accuracy of SRTM DEM is first com-pared to two other DEMs, which are extracted from the ASTER scenes themselves. The purpose of the classification is to detect the changes in eroded areas between the two scenes. As such the erosion area between the period March and December
25
HESSD
7, 135–177, 2010Soil erosion areas in the Blue Nile-Eastern
Sudan
M. El Haj El Tahir et al.
Title Page
Abstract Introduction
Conclusions References
Tables Figures
◭ ◮
◭ ◮
Back Close
Full Screen / Esc
Printer-friendly Version
Interactive Discussion georeferenced MODIS senses from the same period i.e. March and December 2006
are classified. The change in eroded area on this larger scale is hence determined. In this model we generalised the results of studying smaller area of approx. 3600 km2 to larger area of approx. 32 400 km2. This is achieved by working out a fusion between remote sensing and GIS.
5
3.2 ASTER DEM generation and orthorectification
Accurate geometric rectification or image registration of remotely sensed data is a pre-requisite for combining different source data in a classification process (Jensen, 1996; Lu et al., 2004; Toutin, 2004; K ¨a ¨ab et al., 2005b; Lu and Weng, 2007). In particu-lar orthoprojection of high and medium resolution satellite and aerial image data is
10
a mandatory pre-processing step, necessary to prevent strong topographically induced distortions between the images in rugged or mountainous regions (K ¨a ¨ab, 2005a). Ac-cordingly, with an elevation range between approximately 10 m and 1500 m in the study area the ASTER scenes used had to be orthorectified. For this purpose, two DEMs are extracted from the two ASTER images in addition to the SRTM DEM. The three DEMs
15
are then compared (Figs. 4a–5) and the most accurate of the three is found to be SRTM DEM which is eventually used to orthorectify the ASTER images.
DEM generation from satellite imagery uses photogrammetric principles. (Toutin, 2001a, 2002b; Toutin and Cheng, 2001, 2002) outlined the main digital processing steps for DEM generation from ASTER within the PCI Geomatica software. The
prin-20
ciple of the binocular disparity (or parallax) is applied in satellite photogrammetry to compute the terrain elevation from the measured parallaxes between the two images (Toutin, 2001). Modern stereoscopy uses images to produce a three dimensional (3-D) visual model with characteristics analogous to that of actual features viewed using true binocular vision. Photogrammetric principles for space photos (collinearity and
copla-25
HESSD
7, 135–177, 2010Soil erosion areas in the Blue Nile-Eastern
Sudan
M. El Haj El Tahir et al.
Title Page
Abstract Introduction
Conclusions References
Tables Figures
◭ ◮
◭ ◮
Back Close
Full Screen / Esc
Printer-friendly Version
Interactive Discussion Sterophotogrammetry constructs a ray in space to a specific pixel. The intersection is
the real three dimensional measurement of the point in the ground. It is possible to measure both vertical and horizontal displacements. All unknown variables are solved for using a least-square bundle adjustment. From this, epipolar images are created from the 3N and 3B bands and height parallaxes matched using cross-correlation
tech-5
niques. The 3-D stereo model parameters are then applied to transform the raw DEM to cartographic ground coordinates. Stereophotogrammetry has the advantage that the correlation coefficients obtained during the parallax matching process give an idea of how accurate is the computed DEM (known in PCI Geomatica as the score channel). ASTER stereo has one minute difference between the two cameras the NADIR looking
10
and the back looking giving simultaneous along-track stereo-data acquisition a strong advantage in terms of radiometric variations. Larger time intervals are undesirable because there would be changes in the area where the image was acquired. Stereo photogrammetry is a well-developed practice with high correlation success rates.
The first three channels (NADIR) 123N and the back looking channel 3B of ASTER
15
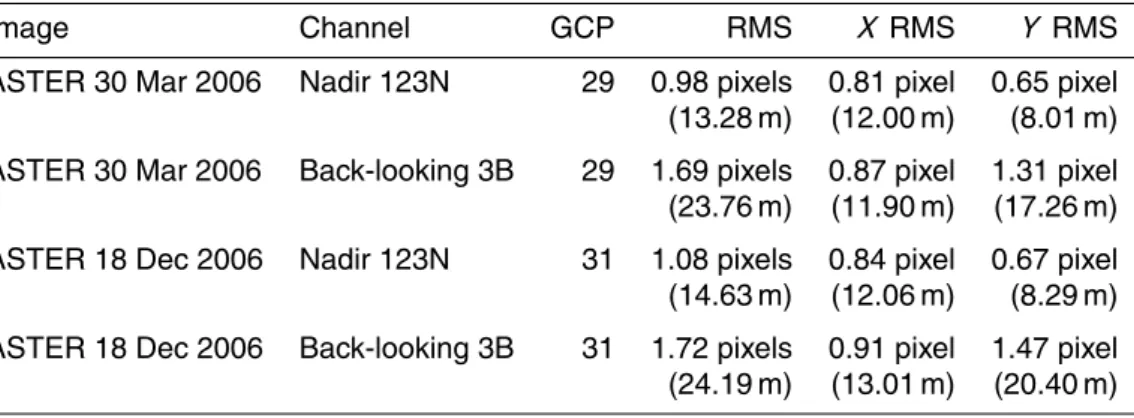
30 March 2006 are read as two different .pix files in PCI Geomatica’s orthoengine using Toutin’s low resolution model. The scenes are reprojected to UTM WGS1984 Zone 36N projection. The ground control points (GCPs) necessary for estimating the model parameters are collected from a hillshade image of SRTM generated in ArcGIS. In total 29 GCPs are collected. The Root Mean Square Error (RMS) is 0.98 pixels
20
(13.28 m). The two images 123N and 3B were tied together using 95 tie points. The maximum residual for tie points is 0.77 pixels (8.67 m). Using cubic transformation and SRTM DTM as the Dem source, a 60 m resolution DEM is extracted. The same pro-cedure is repeated using the second ASTER image of 18 December 2006. A second 60 m resolution DEM is extracted using 31 GCPs, and the Root Mean Square Error
25
(RMS) obtained is 1.08 pixels (14.63 m) (Table 2).
HESSD
7, 135–177, 2010Soil erosion areas in the Blue Nile-Eastern
Sudan
M. El Haj El Tahir et al.
Title Page
Abstract Introduction
Conclusions References
Tables Figures
◭ ◮
◭ ◮
Back Close
Full Screen / Esc
Printer-friendly Version
Interactive Discussion combination process between the two.
3.3 Comparison of the three DEMs
Because the two generated ASTER DTMs cannot be tested against existing reference DTM, they are tested through the overlay of orthoimages, generated from imagery from different sensor positions (multi-incidence angle images). The horizontal
projec-5
tion shifts between the orthoimages from different source imagery is visualized by the following:
– ratio images, (change detection techniques)
– image flickering (animation techniques)
Due to radar shadow, foreshortening, layover and insufficient interferometric
coher-10
ence, the SRTM DTM has significant voids in high mountains topography, but show considerably smaller gross errors compared to ASTER-derived DTMs (K ¨a ¨ab, 2005a).
Visual inspection and quantitative analysis show that severe vertical errors of the ASTER DTM of up to 500 m occur for sharp peaks having steep northern slopes. These errors are not surprising, considering that northern slopes are heavily distorted
15
(or even totally hidden) in the 27.6◦ back-looking band 3B, and lie in shadow at the same time. The two ASTER DTMs were generated from level 1A ASTER images for 6 March and 18 December 2006 and projected to WGS 1984 UTM Zone 36N. The accuracy obtained for the ASTER DTMs compared to the SRTM amounts to ±78 m RMS (for 6 March 2006) and±68 m RMS (18 December 2006). Maximum errors range
20
between−220 m and+500 m. The vertical differences between the 6 March and 18 December 2006-derived DTMs amount to ±33 m RMS (range: −380 m to +180 m). For a subsection with moderate high-mountain topography, an accuracy of±15 m RMS (for the 6 March DTM: ±19 m) and maximum errors of 100 m were found (for the 18 December DTM: 105 m). For the subset, the vertical differences between the 6 March
25
HESSD
7, 135–177, 2010Soil erosion areas in the Blue Nile-Eastern
Sudan
M. El Haj El Tahir et al.
Title Page
Abstract Introduction
Conclusions References
Tables Figures
◭ ◮
◭ ◮
Back Close
Full Screen / Esc
Printer-friendly Version
Interactive Discussion between −30 m and +50 m. These maximum errors occur at sharp ridges or deep
gullies. Generally speaking the accuracy of GCPs and the radiometric image contrast are among the main factors limiting the accuracy of the extracted DEM (Toutin, 2001b, 2002a; Toutin and Cheng, 2001). In this case the low accuracy of the ASTER DEM is attributed to the low optical contrast of the study area. When plotted, the score
5
channel showed that the highest values of over 90% around the lake (Fig. 6). When compared to the SRTM DEM, the ASTER DEM showed differences of up to 650–750 m (Figs. 4a–5). Compared to the SRTM DEM, the ASTER DEM overestimates elevation at higher latitudes while it underestimates elevation at low altitudes. Accordingly SRTM was used to orthoproject the two ASTER images.
10
The depicted test area represents rugged high-mountain conditions with elevations of up to 1500 m a.s.l., steep rock walls, deep shadows that are without contrast. There-fore, the test area is considered to represent a worst case for DTM generation from ASTER data.
3.4 ASTER classification
15
For the purpose of classification only orthoprojected ASTER VNIR channels (1, 2, and 3) and SWIR channels (4, 5, 6, 7, 8, and 9) are used. ASTER thermal channels (10–15) and back-looking channels (3B) were not used.
Slope and aspect are important geomorphic parameters. Slope measures the rate of change of elevation in the direction of the steepest descent (Gallant and Wilson,
20
2000). It is the means by which gravity induces flow of water and other materials, therefore it is of great importance in geomorphology. The aspect of a slope controls its solar irradiation, thus affecting a wide diversity of processes (Moore et al., 1991). Slope and aspect can be calculated from a digital elevation model using one of several GIS-based algorithms (e.g., Moore et al., 1991; Burrough and McDonnell, 1998).
Ar-25
HESSD
7, 135–177, 2010Soil erosion areas in the Blue Nile-Eastern
Sudan
M. El Haj El Tahir et al.
Title Page
Abstract Introduction
Conclusions References
Tables Figures
◭ ◮
◭ ◮
Back Close
Full Screen / Esc
Printer-friendly Version
Interactive Discussion orthprojected ASTER image layers.
Additionally, the river flow network was estimated using the hydrologic analysis pack-age in ArcGIS 9.2. When working with raster DEMs and computing slopes between grid cells, the ratio of the vertical and horizontal resolutions determines the minimum non-zero slope that can be resolved. In this study, the vertical resolution of the DEM is
5
1 m and a grid size is 15 m. Therefore the resolvable slope of 1/15=0.0667. This value means that slopes on hillsides can be computed with a relatively small error. However, slopes in channels are often much smaller than this value. As a consequence, these areas will appear horizontal in the DEM and require special techniques for flow routing in horizontal areas. The technique suggested below is thought to produce consistent
10
results in areas where the flow of water is governed by features that are smaller than the resolution or uncertainty of the DEM, in this case 15 m.
This technique of deriving flow direction from a digital elevation model (DEM) is pre-sented in Jenson and Domingue (1988) and is used in ArcGIS 9.2 Network Analyst function. The direction of flow is determined by finding the direction of steepest
de-15
scent, or maximum drop, from each cell. This is calculated as maximum drop=change inz−value/distance
The distance is calculated between cell centres. This approach is commonly referred to as an eight direction (D8) flow model since there are eight valid output directions relating to the eight adjacent cells into which flow could travel.
20
One challenge arises if all neighbours are higher than the processing cell. In such case the processing cell is called a sink and has an undefined flow direction because any water that flows into a sink cannot flow out. To obtain an accurate representation of flow direction across a surface, the sinks should be filled. The minimum elevation value surrounding the sink will identify the height necessary to fill the sink so the water
25
HESSD
7, 135–177, 2010Soil erosion areas in the Blue Nile-Eastern
Sudan
M. El Haj El Tahir et al.
Title Page
Abstract Introduction
Conclusions References
Tables Figures
◭ ◮
◭ ◮
Back Close
Full Screen / Esc
Printer-friendly Version
Interactive Discussion surface of the earth from others which are merely errors in the data or NoData values.
Using the depressionless DEM as an input to the flow direction process, the direction in which water would flow out of each cell is determined.
The flow accumulation, also known as contributing area determines the size of the region over which water from rainfall can be aggregated. As specific catchment area
5
and slope steepness increase, the amount of water contributed by upslope areas and the velocity of water flow increase, hence stream power and potential erosion increase (Moore et al., 1988). Therefore flow accumulation is very important in describing flow erosion. In flow accumulation, the initial stage is defining the stream network sys-tem. Thereafter an appropriate threshold value is determined for stream network
de-10
lineation. A stream network is created by applying a threshold value to select cells with a high accumulated flow. A break in slope can often be identified in a scatter plot of slope versus area as explained by Tarboton et al. (1991) to identify this threshold.
The final ASTER orthoimages used for classification consisted of 13 layers stacked together. These include: VNIR channels 1, 2, and 3, SWIR channels 4, 5, 6, 7, 8, and
15
9, SRTM DEM, slope, aspect, and river flow network.
For supervised classification, the image was trained into four land cover types: Gully, Mountain, Flat land, and Water. NoData were allowed as additional classification out-put. The most challenging task is to separate between Flat land and Gullies since these two classes are bound to overlap. Overlapping training area boundaries reduces
20
the reliability of the training sites. To achieve this goal, firstly the layer of river network is superimposed on top of the image to help guide to discriminate between gullies and flat lands. Secondly reliance is made of the author’s knowledge of the area and with the aid of a selection of digital photographs taken during an eight weeks field trip in 2006/2007. Thirdly care is taken when selecting the different bands both for display,
25
HESSD
7, 135–177, 2010Soil erosion areas in the Blue Nile-Eastern
Sudan
M. El Haj El Tahir et al.
Title Page
Abstract Introduction
Conclusions References
Tables Figures
◭ ◮
◭ ◮
Back Close
Full Screen / Esc
Printer-friendly Version
Interactive Discussion vegetation, and bare soils in arid regions. The VNIR channels are important for
dis-criminating vegetation and water, whereas SWIR are important for disdis-criminating bare soil. As many training areas as possible are trained because generally speaking, the more areas identified as training sites, the higher the accuracy of the classification.
Once the training areas are defined, then the signature separability values are
stud-5
ied. Signature separability is the statistical difference between pairs of spectral signa-tures. It is expressed in terms of Bhattacharrya Distance and Transformed Divergence. These are measures of the separability of a pair of probability distributions. Both Bhat-tacharrya Distance and Transformed Divergence are shown as real values between zero and two. Zero indicates complete overlap between the signatures of two classes,
10
two indicates a complete separation between the two classes. The higher the separa-bility (i.e. more than 1.5) value the more accurate is the classification accuracy.
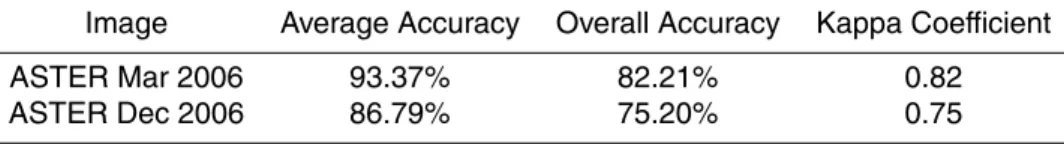
Eventually supervised classification is run several times and the accuracy reports from each run are compared. The accuracy report showed values for average and overall accuracies and kappa coefficient (Table 3). Between each run the classes are
15
refined, the numbers of training areas are varied, and different band combinations are tried, until better accuracies are achieved.
After running the first successful classification, the signature statistic report is stud-ied in order to understand which channels mostly contributed to gully identification. Lu and Weng (2007) advice that it is important to select only the variables that are most
20
useful for separating land-cover or vegetation classes, especially when hyperspectral or multisource data are employed. The results showed that aspect shows high stan-dard deviation values and hence it is the least significant in delineating gullies (Fig. 7). By contrast slope and river network had the least standard deviation and hence they are more important in identifying gullies. Short-wave infrared channels have less
stan-25
dard deviation than visible and near infra red bands. Slope contributed more to gully classification accuracy than the actual elevation.
HESSD
7, 135–177, 2010Soil erosion areas in the Blue Nile-Eastern
Sudan
M. El Haj El Tahir et al.
Title Page
Abstract Introduction
Conclusions References
Tables Figures
◭ ◮
◭ ◮
Back Close
Full Screen / Esc
Printer-friendly Version
Interactive Discussion Next, an accuracy assessment was designed and implemented. A random sample
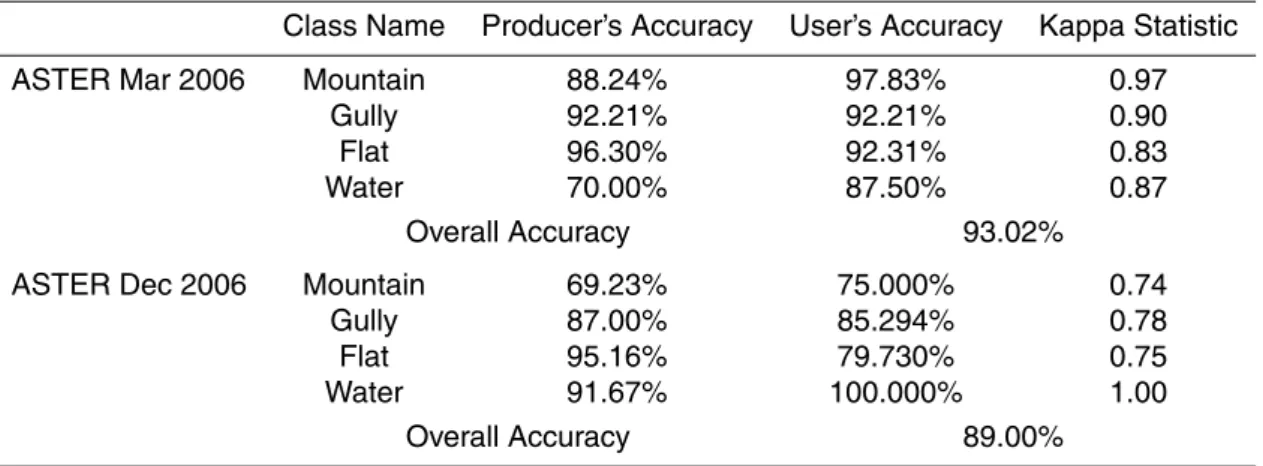
of 300 points was generated in PCI Geomatica and compared to the original ASTER image. ASTER image is used as a reference image due to lack of accurate and up-dated maps for the study area. Each of the 300 samples was checked and assigned to the different classes. Table 4 summarise the outcome of the accuracy assessment.
5
The two classified images of March and December 2006 are laid on top of each other and the area were they overlap is selected to study the bi-temporal change (Fig. 8).
3.5 MODIS classification
First MODIS products of 22 March 2006 are classified in order to generalise the results of the ASTER classification to larger area covering the whole of the Blue Nile province.
10
As mentioned earlier MODIS constituted of a 16-days average of daily images between the periods 14 to 30 March 2006 with 11 data layers originally, of which only 6 i.e. NDVI, EVI, red reflectance, NIR reflectance, blue reflectance and MIR reflectance data layers are used. MODIS is first re-projected to UTM WGS1984 Zone 36N. Thereafter, the same training areas from ASTER 30 March 2006 are used to run a supervised
15
maximum likelihood classifier. The four land cover types are Gully, Mountain, Flat land, and Water. The classification accuracies are shown in Table 5.
Accuracy assessment is run via generating random samples in PCI Geomatica and using the original 6 March ASTER as reference image. The results are shown in Ta-ble 6.
20
HESSD
7, 135–177, 2010Soil erosion areas in the Blue Nile-Eastern
Sudan
M. El Haj El Tahir et al.
Title Page
Abstract Introduction
Conclusions References
Tables Figures
◭ ◮
◭ ◮
Back Close
Full Screen / Esc
Printer-friendly Version
Interactive Discussion
4 Results and discussion
The two ASTER classified images from March and December 2006 are overlaid and their overlap area is extracted. For each image the area represented by each land cover type is calculated using the function Generate Area Report in PCI Geomatica. The results are shown in Table 7. The areas in the December image are subsequently
sub-5
tracted from their correspondent in the March image in order to calculate the changed area per each land cover type. i.e. the area of each land cover type is calculated for both dates and the difference between the two gives an estimate of the bi-temporal change. Ultimately a bi-temporal change map is produced (Fig. 8). Table 7 shows an increase by approx. 112 km2 in the area of gullies. This is because after the rainy
10
season, both rain and flood water dissects large areas creating either new gullies or increasing the width and/or depth of existing gullies. Naturally an increase in dissected land reduces the extent of flat land. That is why there is a decrease of flat land by 153 km2. The area covered with water has increased by 31.5 km2. That is due to the fact that in December there were still large areas that are covered with rain and flood
15
water from the rainy season time which have not receded, percolated or evaporated yet. That is particularly true for areas around Ar Roseris Dam Lake. The total area classified as mountains did not change. In fact this is regarded as an indication of the success of the classification because K ¨a ¨ab, (2005a) argues that an important indica-tion of either good georeferencing or subsequently good multitemporal analysis is the
20
fact that stable features like mountains remain stable.
The bi temporal change is viewed in connection with the classification accuracies of the two images and the pixel size of ASTER to see how significant these results are. The classified images of March and December have average classification accuracies of 93.37% and 86.79%, respectively. Therefore their statistical error is approximately
25
HESSD
7, 135–177, 2010Soil erosion areas in the Blue Nile-Eastern
Sudan
M. El Haj El Tahir et al.
Title Page
Abstract Introduction
Conclusions References
Tables Figures
◭ ◮
◭ ◮
Back Close
Full Screen / Esc
Printer-friendly Version
Interactive Discussion lead to overlooking of gullies that are too small or too big.
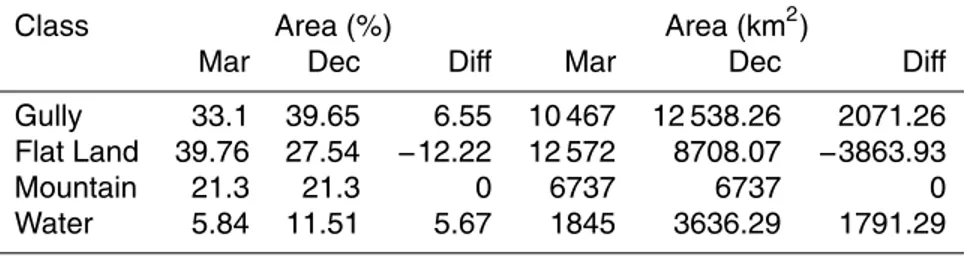
Similar to area estimations using ASTER, the changes in the different land cover ar-eas are estimated from the two classified MODIS products. Table 8 shows that gullies and water have increased by approx. 2071 and 1791 km2, respectively, flat land has decreased by 3864 km2while mountains remained unchanged. MODIS classification
5
accuracy around 80% in an area that is predominantly rural with few land cover/use classes is good. There is insufficient spectral distinctiveness due to the low spectral and spatial resolution of the MODIS data. The training classes were based on ASTER data that has higher spatial and spectral resolution causing some discrepancies be-tween the two data sets. MODIS products consisted of averaged products rather than
10
the actual spectral bands. Some artefacts interfered with the calculation of eroded area.
Hence the estimated area along the Blue Nile River, between Sennar and Ed Damazin, Eastern Sudan that was affected by soil erosion during the 2006 rainy sea-son was estimated to be 2071 km2or 6.5% of the total study area approximately. This
15
estimation should be viewed in light of the facts that: a) the year 2006 was exception-ally wet year compared to previous years, b) the Upper Blue Nile River is steeper and receives more rain than any other river in Sudan namely, the White Nile, River Atbara, Sobat, etc, c) there are no previous studies on areas affected by seasonal erosion on this particular region to compare these results with.
20
5 Conclusions
An understanding of soil erosion is mandatory for any consequent understanding of soil moisture regime in Blue Nile region, Eastern Sudan. On its own rights, soil ero-sion poses a serious environmental and socio-economic threat to the environment and mankind. Previous research in Sub-Sahara Africa has singled out the Upper Blue Nile
25
bene-HESSD
7, 135–177, 2010Soil erosion areas in the Blue Nile-Eastern
Sudan
M. El Haj El Tahir et al.
Title Page
Abstract Introduction
Conclusions References
Tables Figures
◭ ◮
◭ ◮
Back Close
Full Screen / Esc
Printer-friendly Version
Interactive Discussion fits from advances in GIS and remote sensing fusion techniques. The model is simple,
robust and straightforward. It makes use of the well tested methods of supervised classification using maximum likelihood (MLC). Generalisation of ASTER classification results using MODIS was useful for capturing a regional impression of the spatial distri-bution of erosion. Key to the model success is further development of proper validation
5
procedures. The model can be used to study longer-term changes in erosion by using a images from different years.
The size of this region makes the traditional mapping methods of aerial photogra-phy and field surveying of limited use. Moderate resolution multispectral data allows continental- to global-scale mapping of the Earth’s surface while retaining sufficient
10
resolution for geomorphic and ecological studies.
The methodology presented here is also transportable to other arid and semi-arid parts of Sudan where an understanding of soil erosion is desirable.
Acknowledgements. Our appreciation extends to the Norwegian Research Council (NFR) for
sponsoring the project number 171783 (FRIMUF), Department of Geosciences, University of
15
Oslo, Faculty of Engineering, University of Khartoum, The Forestry, Irrigation and Environment National Corporations of the Sudan.
References
Abdulkarim, A.: Rainfall Variability in the Blue Nile State, Reports of the National Meteorological Office, Khartoum, 2006.
20
Ahmed, A., Osman Ishraga, S., and Babiker, A.: Sediment and Aquatic Weeds Management Challenges in Gezira Irrigated Scheme. Proceedings, UNESCO’s International Sediment Initiative Conference (ISIC), Khartoum, Sudan, 2006.
Asner, G. P. and Heidebrecht, K. B.: Spectral unmixing of vegetation, soil and dry carbon cover in arid regions: comparing multispectral and hyperspectral observations, Int. J. Remote.
25
Sens., 23(19), 3939–3958, 2002.
HESSD
7, 135–177, 2010Soil erosion areas in the Blue Nile-Eastern
Sudan
M. El Haj El Tahir et al.
Title Page
Abstract Introduction
Conclusions References
Tables Figures
◭ ◮
◭ ◮
Back Close
Full Screen / Esc
Printer-friendly Version
Interactive Discussion
Bull, W. B.: Soils, geology, and hydrology of deserts, in: Water in Desert Ecosystems, edited by: Evans, D. D. and Thames, J. L., 42–58, Dowden, Hutchinson and Ross, Stroudsberg, PA, 280 pp., 1981.
Burrough, P. A. and Mcdonald, R. A.: Principles of Geographical Information Systems, Oxford University Press, New York, 333 pp., 1998.
5
Crawford, C. S. and Gosz, J. R.: Desert ecosystems: their resources in space and time, Envi-ron. Conserv., 9, 181–195, 1982.
Dan, J., Moshe, R., and Alperovitch, N.: The soils of Sede Zin, Israel J. Earth Sci., 22, 211–227, 1973.
Dan, J. and Yaalon, D. H.: Automorphic saline soils in Israel, in: Aridic Soils and Geomorphic
10
Processes, edited by: Yaalon, D. H., Cathena Supplement 1, Cathena Verlag, Braunschweig, Germany, 103–115, 1982.
Dan, J. and Koyumdjisky, H.: Distribution of salinity in the soils of Israel, Israel J. Earth Sci., 36, 213–223, 1987.
Evenari, M., Shanan, L., and Tadmor, N.: The Negev: The Challenge of a Desert, Harvard
15
University Press, Cambridge, Mass , 437 pp., 1982.
Fadul, H. M., Salih, A. A., Ali, A., and Inanga, S.: Use of remote sensing to map gully erosion along Atbara River, Sudan, JAG, 1(3/4), 1999.
Fadul, H. M.: Use of Remote Sensing in Monitoring Impacts of Bank and Back Gully Erosion in Sudan, Proceedings, UNESCO’s International Sediment Initiative Conference (ISIC),
Khar-20
toum, Sudan, 2006.
Gao, X., Huete, A., Ni, W., and Miura T.: Optical–biophysical relationships of vegetation spectra without background contamination, Remote Sens. Environ., 74, 609–620, 2000.
Gallant, J. C. and Wilson, J. P.: Primary topographic attributes, in: Terrain Analysis: Principals and Applications, edited by: Wilson, J. P. and Gallant, J. C., John Wiley and Sons, Inc., New
25
York, 51–85, 2000.
Gomer, D. and Vogt, T.: Physically based modelling of surface runoffand soil erosion under semi-arid Mediterranean conditions, the example of Oued Mina, Algeria, in: Soil Erosion: Application of Physically Based Models, edited by: Schmidt, J., Springer Verlag, Berlin, Heidelberg, New York, 58–78, 2000.
30
Gruber, S. and Peckham, S.: Land-surface parameters and objects in hydrology, Dev. Soil Sci., 33, 171–194, 2009.
HESSD
7, 135–177, 2010Soil erosion areas in the Blue Nile-Eastern
Sudan
M. El Haj El Tahir et al.
Title Page
Abstract Introduction
Conclusions References
Tables Figures
◭ ◮
◭ ◮
Back Close
Full Screen / Esc
Printer-friendly Version
Interactive Discussion
performance of the MODIS vegetation indices, Remote Sens. Environ., 83(1–2), 195–213, 2002.
Jensen, J. R.: Intloductory Digital Image Processing: A Remote Sensing Perspective, Prentice-Hall, Englewood Cliffs, NJ, 379 pp., 1996.
Jenson, S. K. and Domingue, J. O.: Extracting topographic structure from digital elevation data
5
for geographic information system analysis, Photogramm. Eng. Rem. S., 54(11), 1593–1600, 1988.
K ¨a ¨ab, A.: Combination of SRTM3 and repeat ASTER data for deriving alpine glacier flow ve-locities in the Bhutan Himalaya, Remote Sens. Environ., 94(4), 463–474, 2005a.
K ¨a ¨ab, A.: Remote Sensing of Mountain Glaciers and Permafrost Creep, Schriftenreihe
Physi-10
sche Geographie, vol. 48, Geographisches Institut der Universit ¨at Z ¨urich, Z ¨urich, Switzer-land, 266 pp., 2005b.
K ¨a ¨ab, A., Huggel, C., Fischer, L., Guex, S., Paul, F., Roer, I., Salzmann, N., Schlaefli, S., Schmutz, K., Schneider, D., Strozzi, T., and Weidmann, Y.: Remote sensing of glacier- and permafrost-related hazards in high mountains: an overview, Nat. Hazards Earth Syst. Sci.,
15
5, 527–554, 2005,
http://www.nat-hazards-earth-syst-sci.net/5/527/2005/.
Lefsky, M. A. and Cohen, W. B.: Selection of remotely sensed data, in: Methods and Appli-cations for Remote Sensing: Concepts and Case Studies, edited by: Wulder, M. A. and Franklin, S. A., Kluwer Academic Publishers, Dordrecht, 13–46, 2003.
20
Linsley Jr., R. K., Kohler, M. A., and Paulhus, J. L. H.: Hydrology for Engineers, 3rd edition, International Student Edition, McGraw-Hill Kogakusha, Ltd., New York, USA, 1982.
Liu, J. G., Hilton, F., Mason, P., and Lee, H.: A RS/GIS study of rapid erosion in SE Spain using ERS SAR multi-temporal interferometric coherence imagery, in: Remote Sensing for Agriculture, Ecosystems, and Hydrology II, edited by: Owe, M., Zilioli, E., and D’Urso, G.,
25
Proceedings of SPIE, vol. 4171, SPIE International, Barcelona, Spain, 367–375, 2000. Liu, J. G., Mason, P., Hilton, F., and Lee, H.: Detection of rapid erosion in SE Spain: A GIS
ap-proach based on ERS SAR coherence imagery, Photogramm. Eng. Rem. S., 70(10), 1179– 1185, 2004.
Lu, D., Mausel, P., Brondizio, E., and Moran, E.: Change detection techniques, Int. J. Remote
30
Sens., 25(12), 2365–2407, 2004.
HESSD
7, 135–177, 2010Soil erosion areas in the Blue Nile-Eastern
Sudan
M. El Haj El Tahir et al.
Title Page
Abstract Introduction
Conclusions References
Tables Figures
◭ ◮
◭ ◮
Back Close
Full Screen / Esc
Printer-friendly Version
Interactive Discussion
Mirghani, O.: Report on the Field Visit to Sennar and Blue Nile States, as part of the December 2006/January 2007 Field work report, Environment National corporation, Khartoum, Sudan, 2007.
Mokwunye, U.: Nutrient Depletion: Sub-Saharan Africa’s Greatest Threat to Economic Devel-opment, STAP Expert Workshop on Land Degradation, Dakar, Senegal, 95 pp., 1996.
5
Moore, I. D., O’Loughlin, E. M., and Burch, G. J.: A contour-based topographic model for hydrological and ecological applications, Earth Surf. Proc. Land Forms, 13(4), 305–320, 1988.
Moore, I. D., Grayson, R. B., and Ladson, A. R.: Digital terrain modelling: a review of hydrolog-ical, geomorphologhydrolog-ical, and biological applications, Hydrol. Process., 5, 3–30, 1991.
10
Nakileza, B., Nsubuga, E. N. B., Tenywa, M. M., and Lwakuba, A.: Rethinking Natural Resource Degradation in Semi-Arid Sub-Saharan Africa: A review of soil and water conservation re-search and practice in Uganda, with particular emphasis on the semi-arid areas, Overseas Development Institute (ODI) Report, University of Makerere press, Kampala, Uganda, 1999. Nearing, M. A., Pruski, F. F., and O’Neal, M. R.: Expected climate change impacts on soil
15
erosion rates, a review. J. Soil Water Conserv., 59(1), 43–50, 2004.
Nir, D. and Klein, M.: Gully erosion induced in land size in a semi-arid terrain (Nahal Shiqma, Israel), Z. Geomorphol., 21(Suppl.), 191–201, 1974.
Rozin, U. and Schick, A.: Land use change, conservation measures and stream channel re-sponse in the Mediterranean/semiarid transition zone: Nahal Hoga, southern coastal plain,
20
Israel, in: Erosion and Sediment Yield: Global and Regional Perspectives, vol. 236, IAHS Press, Centre for Ecology and Hydrology, Wallingford, OX 10 8 BB, UK, 427–443, 1996. Schlesinger, W., Reynolds, J. F., Cunningham, G. L., Huenneke, L. F., Jarrell, W. M., Virginia,
R. A., and Whitford, W. G.: Biological feedbacks in global desertification, Science, 247, 1043–1048, 1990.
25
Schlesinger, W., Raikes, J. A., Hartley, A. E., and Cross, A. F.: On the spatial pattern of soil nutrients in desert ecosystems, Ecology, 77, 364–374, 1996.
Shalhevet, J. and Bernstein, L.: Effects of vertically heterogeneous soil salinity on plant growth and water uptake, Soil Sci., 106, 85–93, 1968.
Symeonakis, E. and Drake, N.: Monitoring desertification and land degradation over
sub-30
Saharan Africa, Int. J. Remote Sens., 25(3), 573–592, 2004.
HESSD
7, 135–177, 2010Soil erosion areas in the Blue Nile-Eastern
Sudan
M. El Haj El Tahir et al.
Title Page
Abstract Introduction
Conclusions References
Tables Figures
◭ ◮
◭ ◮
Back Close
Full Screen / Esc
Printer-friendly Version
Interactive Discussion
Thornes, J. B.: The ecology of erosion, Geography, 70, 222–234, 1985.
Thornes, J. B.: The interaction of erosional and vegetation dynamics in land degradation: spa-tial outcomes, in: Vegetation and Erosion, edited by: Thornes, J. B., John Wiley, Chichester, 41–53, 1990.
Toutin, T.: DEM generation from new VIR Sensors: Ikonos, ASTER and Landsat 7.
Proceed-5
ings, IGARSS ’01, Sydney, Australia, 2001a.
Toutin, T.: Elevation modelling from satellite visible and infrared (VIR) data, Int. J. Remote Sens., 22(6), 1097–1125, 2001b.
Toutin, T. and Cheng, P.: DEM generation with ASTER stereo data, Earth Observation Maga-zine, 10(6), 10–13, 2001.
10
Toutin, T.: DEM from stereo Landsat 7 ETM data over high relief areas, Int. J. Remote Sens., 23(10), 2133–2139, 2002a.
Toutin, T.: Three-dimensional topographic mapping with ASTER stereo data in rugged topog-raphy, IEEE T. Geosci. Remote, 40(10), 2241–2247, 2002b.
Toutin, T. and Cheng, P.: Comparison of automated digital elevation model extraction results
15
using along-track ASTER and across-track SPOT stereo images, Opt. Eng., 41(9), 2102– 2106, 2002.
Toutin, T.: Geometric processing of remote sensing images: models, algorithms and methods, Int. J. Remote Sens., 25(10), 1893–1924, 2004.
Vrieling, A., Sterk, G., and Beaulieu, N.: Erosion risk mapping, a methodological case study in
20
the Colombian Eastern Plains, J. Soil Water Conserv., 57(3), 158–163, 2002.
Vrieling, A.: Satellite remote sensing for water erosion assessment: a review, Catena, 65, 2–18, 2006.
Vrieling, A., Rodrigues, S. C., Bartholomeus, H., and Sterk, G.: Automatic identification of erosion gullies with ASTER imagery in the Brazilian Cerrados, Int. J. Remote Sens., 28(12),
25
2723–2738, 2007.
Ward, D. and Olsvig-Whittaker, L.: Plant species diversity at the junction of two desert biogeo-graphic zones, Biodivers. Lett., 1, 172–185, 1993.
Ward, D., Feldman, K., and Avni, Y.: The effects of loess erosion on soil nutrients, plant diversity and plant quality in Negev desert wadis, J. Arid Environ., 48, 461–473, 2001.
30
HESSD
7, 135–177, 2010Soil erosion areas in the Blue Nile-Eastern
Sudan
M. El Haj El Tahir et al.
Title Page
Abstract Introduction
Conclusions References
Tables Figures
◭ ◮
◭ ◮
Back Close
Full Screen / Esc
Printer-friendly Version
Interactive Discussion
Xu, C.-Y., Zhang, Q., El Hag El Tahir, M., and Zhang, Z.: Statistical properties of the tem-perature, relative humidity, and solar radiation in the Blue Nile- Eastern Sudan region. Theor. Appl. Climatol., accepted, online available at: http://www.springerlink.com/content/ 47713r157550l230/ 2009.
Zhang, X., Drake, N., and Wainwright, J.: Scaling land surface parameters for global-scale soil
5
HESSD
7, 135–177, 2010Soil erosion areas in the Blue Nile-Eastern
Sudan
M. El Haj El Tahir et al.
Title Page
Abstract Introduction
Conclusions References
Tables Figures
◭ ◮
◭ ◮
Back Close
Full Screen / Esc
Printer-friendly Version
Interactive Discussion Table 1.Data description.
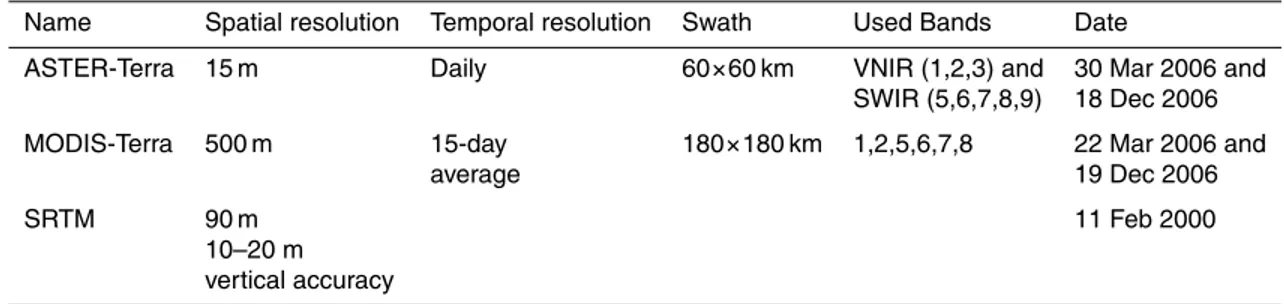
Name Spatial resolution Temporal resolution Swath Used Bands Date
ASTER-Terra 15 m Daily 60×60 km VNIR (1,2,3) and 30 Mar 2006 and SWIR (5,6,7,8,9) 18 Dec 2006
MODIS-Terra 500 m 15-day 180×180 km 1,2,5,6,7,8 22 Mar 2006 and
average 19 Dec 2006
SRTM 90 m 11 Feb 2000
HESSD
7, 135–177, 2010Soil erosion areas in the Blue Nile-Eastern
Sudan
M. El Haj El Tahir et al.
Title Page
Abstract Introduction
Conclusions References
Tables Figures
◭ ◮
◭ ◮
Back Close
Full Screen / Esc
Printer-friendly Version
Interactive Discussion Table 2.Table: 2 Root mean square error (RMS) for the (GCPs).
Image Channel GCP RMS X RMS Y RMS
HESSD
7, 135–177, 2010Soil erosion areas in the Blue Nile-Eastern
Sudan
M. El Haj El Tahir et al.
Title Page
Abstract Introduction
Conclusions References
Tables Figures
◭ ◮
◭ ◮
Back Close
Full Screen / Esc
Printer-friendly Version
Interactive Discussion Table 3.Classification report.
Image Average Accuracy Overall Accuracy Kappa Coefficient
ASTER Mar 2006 93.37% 82.21% 0.82
HESSD
7, 135–177, 2010Soil erosion areas in the Blue Nile-Eastern
Sudan
M. El Haj El Tahir et al.
Title Page
Abstract Introduction
Conclusions References
Tables Figures
◭ ◮
◭ ◮
Back Close
Full Screen / Esc
Printer-friendly Version
Interactive Discussion Table 4.Accuracy Statistics.
Class Name Producer’s Accuracy User’s Accuracy Kappa Statistic
ASTER Mar 2006 Mountain 88.24% 97.83% 0.97
Gully 92.21% 92.21% 0.90
Flat 96.30% 92.31% 0.83
Water 70.00% 87.50% 0.87
Overall Accuracy 93.02%
ASTER Dec 2006 Mountain 69.23% 75.000% 0.74
Gully 87.00% 85.294% 0.78
Flat 95.16% 79.730% 0.75
Water 91.67% 100.000% 1.00
HESSD
7, 135–177, 2010Soil erosion areas in the Blue Nile-Eastern
Sudan
M. El Haj El Tahir et al.
Title Page
Abstract Introduction
Conclusions References
Tables Figures
◭ ◮
◭ ◮
Back Close
Full Screen / Esc
Printer-friendly Version
Interactive Discussion Table 5.Classification report.
Image Average Accuracy Overall Accuracy Kappa Coefficient
MODIS Mar 2006 77.18% 61.85% 0.40
HESSD
7, 135–177, 2010Soil erosion areas in the Blue Nile-Eastern
Sudan
M. El Haj El Tahir et al.
Title Page
Abstract Introduction
Conclusions References
Tables Figures
◭ ◮
◭ ◮
Back Close
Full Screen / Esc
Printer-friendly Version
Interactive Discussion Table 6.Accuracy Statistics.
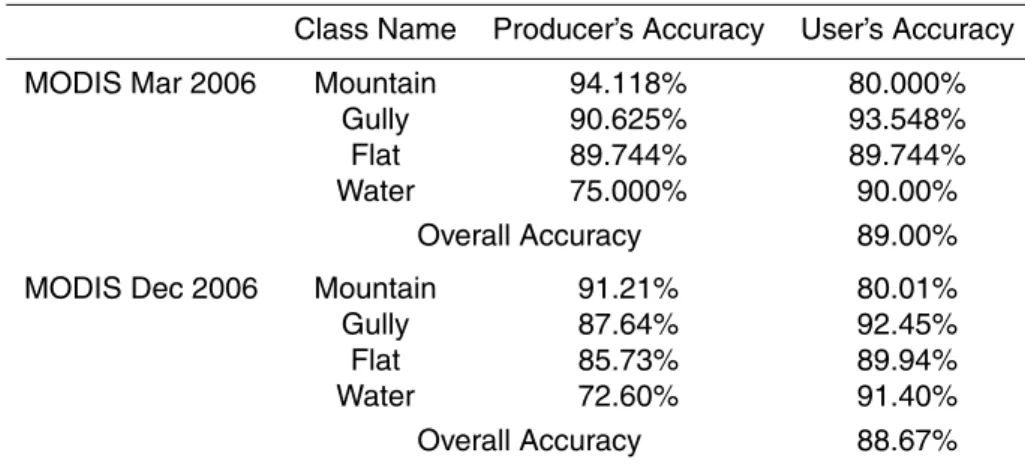
Class Name Producer’s Accuracy User’s Accuracy MODIS Mar 2006 Mountain 94.118% 80.000%
Gully 90.625% 93.548%
Flat 89.744% 89.744%
Water 75.000% 90.00%
Overall Accuracy 89.00%
MODIS Dec 2006 Mountain 91.21% 80.01%
Gully 87.64% 92.45%
Flat 85.73% 89.94%
Water 72.60% 91.40%
HESSD
7, 135–177, 2010Soil erosion areas in the Blue Nile-Eastern
Sudan
M. El Haj El Tahir et al.
Title Page
Abstract Introduction
Conclusions References
Tables Figures
◭ ◮
◭ ◮
Back Close
Full Screen / Esc
Printer-friendly Version
Interactive Discussion Table 7.Estimated bi-temporal change in ASTER (60×60 km) scale during 2006 rainy season.
Class Area (%) Area (km2)
Mar Dec Diff Mar Dec Diff
HESSD
7, 135–177, 2010Soil erosion areas in the Blue Nile-Eastern
Sudan
M. El Haj El Tahir et al.
Title Page
Abstract Introduction
Conclusions References
Tables Figures
◭ ◮
◭ ◮
Back Close
Full Screen / Esc
Printer-friendly Version
Interactive Discussion Table 8.Estimated bi-temporal change in the regional MODIS scale during 2006 rainy season.
Class Area (%) Area (km2)
Mar Dec Diff Mar Dec Diff
Gully 33.1 39.65 6.55 10 467 12 538.26 2071.26 Flat Land 39.76 27.54 −12.22 12 572 8708.07 −3863.93
Mountain 21.3 21.3 0 6737 6737 0
HESSD
7, 135–177, 2010Soil erosion areas in the Blue Nile-Eastern
Sudan
M. El Haj El Tahir et al.
Title Page
Abstract Introduction
Conclusions References
Tables Figures
◭ ◮
◭ ◮
Back Close
Full Screen / Esc
Printer-friendly Version
Interactive Discussion MODIS Scale
(180 x 180) km2
ASTER Scale
(60 x 60) km2
HESSD
7, 135–177, 2010Soil erosion areas in the Blue Nile-Eastern
Sudan
M. El Haj El Tahir et al.
Title Page
Abstract Introduction
Conclusions References
Tables Figures
◭ ◮
◭ ◮
Back Close
Full Screen / Esc
Printer-friendly Version
HESSD
7, 135–177, 2010Soil erosion areas in the Blue Nile-Eastern
Sudan
M. El Haj El Tahir et al.
Title Page
Abstract Introduction
Conclusions References
Tables Figures
◭ ◮
◭ ◮
Back Close
Full Screen / Esc
Printer-friendly Version
Interactive Discussion Fig. 3. Flow diagram summarising the methodology. On the left hand side are the steps
HESSD
7, 135–177, 2010Soil erosion areas in the Blue Nile-Eastern
Sudan
M. El Haj El Tahir et al.
Title Page
Abstract Introduction
Conclusions References
Tables Figures
◭ ◮
◭ ◮
Back Close
Full Screen / Esc
Printer-friendly Version
Interactive Discussion Fig. 4a. Elevation differences between SRTM DTM (solid line) and ASTER (18 December
HESSD
7, 135–177, 2010Soil erosion areas in the Blue Nile-Eastern
Sudan
M. El Haj El Tahir et al.
Title Page
Abstract Introduction
Conclusions References
Tables Figures
◭ ◮
◭ ◮
Back Close
Full Screen / Esc
Printer-friendly Version
Interactive Discussion
HESSD
7, 135–177, 2010Soil erosion areas in the Blue Nile-Eastern
Sudan
M. El Haj El Tahir et al.
Title Page
Abstract Introduction
Conclusions References
Tables Figures
◭ ◮
◭ ◮
Back Close
Full Screen / Esc
Printer-friendly Version
HESSD
7, 135–177, 2010Soil erosion areas in the Blue Nile-Eastern
Sudan
M. El Haj El Tahir et al.
Title Page
Abstract Introduction
Conclusions References
Tables Figures
◭ ◮
◭ ◮
Back Close
Full Screen / Esc
Printer-friendly Version
HESSD
7, 135–177, 2010Soil erosion areas in the Blue Nile-Eastern
Sudan
M. El Haj El Tahir et al.
Title Page Abstract Introduction Conclusions References Tables Figures ◭ ◮ ◭ ◮ Back Close
Full Screen / Esc
Printer-friendly Version
Interactive Discussion
Channel contribution to gully identification
0 20 40 60 80 100 120 140 N e tw o rk Sl o p e SW IR _ 9 VN IR _ 1 SW IR _ 8 SW IR _ 7 SW IR _ 5 SW IR _ 6 SW IR _ 4 VN IR _ 2 VN IR _ 3 El e v a ti o n A s p e c t S ta nd a rd D e v ia ti on
HESSD
7, 135–177, 2010Soil erosion areas in the Blue Nile-Eastern
Sudan
M. El Haj El Tahir et al.
Title Page
Abstract Introduction
Conclusions References
Tables Figures
◭ ◮
◭ ◮
Back Close
Full Screen / Esc
Printer-friendly Version
Interactive Discussion Fig. 8.Estimated bi-temporal changes in area of different land cover types between March and