THE EXTERNAL PAYMENTS’ BALANCE AND THE ROMANIAN
ECONOMIC GROWTH BETWEEN 1996 AND 2006
Turturean Ciprian-Ionel
„Alexandru Ioan Cuza” University of IAùI, Faculty of Economics and Business Administration, Carol I Boulevard, no. 22, Iaúi, postal code: 700506, [email protected], Telephone no.: 0740-177567
Jemna DănuĠ-Vasile
„Alexandru Ioan Cuza” University of IAùI, Faculty of Economics and Business Administration, Carol I Boulevard, no. 22, Iaúi, postal code: 700506, [email protected]
The economic development involves, for a short time, a deficit of external payments balance (EPB). Studying the evolution of the EPB sold provides useful information regarding the economic development’ degree (rate). An invariable deficit which has acceptable limits and correlated with an investment policy in production sectors could cause a long economic growth. Studying the relationship between the growth rate of GDP and the growth deficit of EPB for the 1996-2006 periods confirms this hypothesis.
Keywords: deficit of balance external payments, economic growth, transition, Romania
1. Introduction
External payments balance illustrates the summation of a country’s economic transactions fluxing in its reports with the foreign countries, completed in a certain time period, usually a year. At the end of a year, EPB can be found in one of the following situations:
a) Balance – the surpluses and the deficits compensate each other;
b) Surplus – the surpluses exceed the deficits;
c) Deficit – the deficits exceed the surpluses.
The EPB is with surplus or in balance when the exports and debits’ value is bigger or equal with the value of imports and/or credits. This specific situation characterizes the big oil exporters or developed countries that, in times of economic progress add a big surplus value to the raw material as a result of a high technological degree of the production process. An EPB with surplus or in balance can facilitate the economic growth of a country. The EPB’s surplus it is usually oriented through the development of the national activity sectors.
The EPB is with deficit when the exports and debits’ value is lower than the value of imports and/or credits. This specific situation characterizes the least developed, in course of development and in transition countries that don’t contrive to produce competitive goods for the international economic market. An EPB with deficit causes foreign borrowings, witch can be least favorable for the economic development process. The paper’s objective is to analyze the relationship between the economic growth and the EPB’s balance account in Romania, for the 1996-2006 period.
The working method is the time series’ econometric modeling. An econometric model will be created to explain the evolution of the Romanian EPB’s balance account, for the 1996-2006 period. Also, a model will be created to explain the dependence of the EPB’s balance account dynamics on the economic growth.
Statistical data
2. The analyze of Romanian EPB’s evolution, for the 1996-2006 period
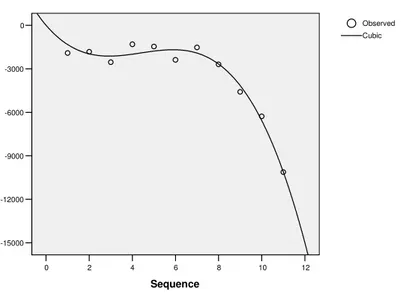
By analyzing Figure 1 it can be observed that the EPB’s deficit has an amplifying tendency, emphasized especially in the 2003-2006 period. The evolution of the Romanian EPB’s balance account is related to the shape of a hyperbole or a geom. Parabola arch, which leads us to try the trend modeling by a inverse, quadratic or cubic function.
The analysis of the possibilities leads to a cubic trend for the Romanian EPB’s balance account, as suggested in Figure 1. The disadvantage of this model is that it doesn’t allow the underlying of major evolution changes in the future, it only allows the extension of a descending trend.
Figure 1. The Romanian EPB’s balance account dynamics, in the 1996-2006 period
0
-3000
-6000
-9000
-12000
-15000
12 10 8 6 4 2 0
Sequence
Cubic Observed
Soldul BPE RO mil. EURO de pe 1.1.1999/ mil ECU pana pe 31.12.1998. Cont curent+cont de capital
3. Modeling the Romanian EPB’s dynamics with a cubic trend model
As shown in Figure 1, the evolution of the Romanian EPB’s balance account can be estimated with a cubic model.
Estimation and validation of the model’s parameters
The estimated cubic model is given by the following relation: Yt = a + b1 Xt + b2 Xt2+ b3 Xt3,where a, b1, b2, b3 are the parameters estimates of the regression model. Using the ordinary least squares
method and the SPSS software, the following results has been obtained:
Table 1. Correlation coefficients
Coefficients
-1740,672 226,097 -2,800 -7,699 ,000
445,573 61,326 6,369 7,266 ,000
-33,718 3,965 -4,668 -8,504 ,000
Case Sequence Case Sequence ** 2 Case Sequence ** 3
B Std. Error
Unstandardized Coefficients
Beta Standardized
Coefficients
The estimated model, without the constant, is: Yt = - 1740,527 t + 445,573 t2 – 33,718 t3. As shown in the
table above, models’ parameters are significant.
Correlation coefficients and model validation
The cubic model with no constant explains 98.6% (Adjusted R Square) of the variation of Romanian EPB’s balance account for the 1996-2006 period. The ANOVA test, presented in Table 2, shows that the correlation coefficient is statistically significant, and so is the estimated regression model.
Table 2. Regression model’s validation
ANOVAa
193600975,722 3 64533658,57 255,546 ,000
2020257,278 8 252532,160
195621233,000 11
Regression Residual Total
Sum of Squares df Mean Square F Sig.
The equation was estimated without the constant term. a.
Analyzing modeling errors
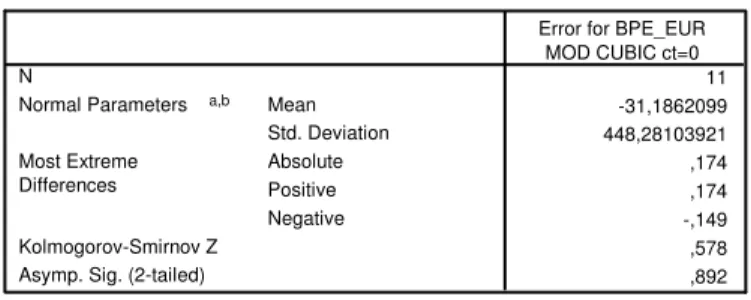
Table 3 shows the result of error distribution normality testing, as obtained in the trend modeling of the Romanian EPB’s balance account’s evolution by a cubic model. The results show that the model errors’ distribution doesn’t differ significantly from the normal distribution (sig. = 0,982).
Table 3. Model errors’ distribution normality testing
One-Sample Kolmogorov-Smirnov Test
11 -31,1862099 448,28103921 ,174 ,174 -,149 ,578 ,892 N
Mean Std. Deviation Normal Parameters a,b
Absolute Positive Negative Most Extreme
Differences
Kolmogorov-Smirnov Z Asymp. Sig. (2-tailed)
Error for BPE_EUR MOD CUBIC ct=0
Test distribution is Normal. a.
Calculated from data. b.
In Table 4 are presented the results of the errors’ independence testing, using Runs test. The test results show that the errors’ independence hypothesis is accomplished. The results presented in Table 5 illustrate that the model errors also discharge the homoskedasticity hypothesis (Spearman ranks’ correlation coefficient between the errors and the time variable was calculated and validated).
Table 4. Model errors’ autocorrelation testing
Runs Test
-15,70271 5 6 11 8 ,671 ,502 Test Valuea
Cases < Test Value Cases >= Test Value Total Cases Number of Runs Z
Asymp. Sig. (2-tailed)
Error for BPE_EUR from CURVEFIT, MOD_ 4 CUBIC NOC
Table 5. Model errors’ homoskedasticity testing
Correlations
1,000 -,436
. ,180
11 11
-,436 1,000
,180 .
11 11
Correlation Coefficient Sig. (2-tailed) N
Correlation Coefficient Sig. (2-tailed) N Ani
mod_er_mod_cub Spearman's rho
Ani
mod_er_ mod_cub
Te obtained results allow us to conclude that the estimated model fulfills all the hypothesis of a classical regression model. Therefore, the model estimated with a cubic function explains statistically significant the variation of the Romanian EPB’s balance account for the 1996-2006 period. Based on this model, prediction for the future periods can be made.
4. Modeling the relationship between the economic growth – EPB’s balance account
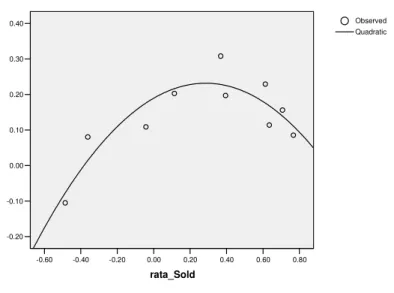
The relationship between the economic growth and the EPB’s balance account is presented in Figure 2. The model that explains the relationship between the two variables is a quadratic model and it has the parameter’s estimates presented in Table 6.
Figure 2. Economic growth rate and EPB’s balance account growth rate for the 1996-2006 period
0.40
0.30
0.20
0.10
0.00
-0.10
-0.20
0.80 0.60 0.40 0.20 0.00 -0.20 -0.40 -0.60
rata_Sold
Quadratic Observed
rata_PIB
Table 6. Regression coefficients
Coefficients
.296 .059 1.191 5.030 .002
-.520 .130 -.945 -3.994 .005
.189 .031 6.073 .001
rata_Sold rata_Sold ** 2 (Constant)
B Std. Error Unstandardized
Coefficients
Beta Standardized
Coefficients
t Sig.
The estimated model, as presented in the table above, is:
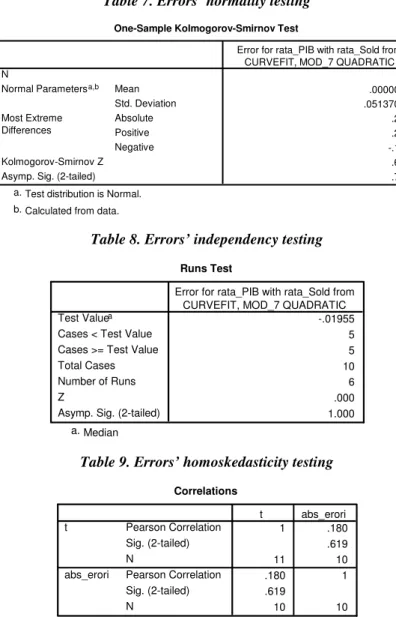
The tests made for the model errors shows that the model fulfills all the hypothesis from the econometric modeling (Tables 7-9).
Table 7. Errors’ normality testing
One-Sample Kolmogorov-Smirnov Test
10 .0000000 .05137099 .205 .205 -.151 .647 .797 N
Mean Std. Deviation Normal Parametersa,b
Absolute Positive Negative Most Extreme
Differences
Kolmogorov-Smirnov Z Asymp. Sig. (2-tailed)
Error for rata_PIB with rata_Sold from CURVEFIT, MOD_7 QUADRATIC
Test distribution is Normal. a.
Calculated from data. b.
Table 8. Errors’ independency testing
Runs Test
-.01955 5 5 10 6 .000 1.000 Test Valuea
Cases < Test Value Cases >= Test Value Total Cases Number of Runs Z
Asymp. Sig. (2-tailed)
Error for rata_PIB with rata_Sold from CURVEFIT, MOD_7 QUADRATIC
Median a.
Table 9. Errors’ homoskedasticity testing
Correlations
1 .180 .619
11 10
.180 1
.619
10 10
Pearson Correlation Sig. (2-tailed) N
Pearson Correlation Sig. (2-tailed) N
t
abs_erori
t abs_erori
The obtained model shows that an EPB’s balance account rate’s growth leads to economic growth up to a certain level, after which an economic regress is recorded. For Romania, the ongoing growth of the EPB’s deficit draws a fall into the economic growth, which can create, on long term, the appearance of major macroeconomic dysfunctions.
5. Conclusions
The estimated model for the EPB’s balance account’s dynamics can be used for predictions, with the reserve that, at a certain point, it is possible to appear political changes in Romania regarding the international economic transactions, which can cause ruptures in the EPB’s balance account’s evolution. These changes in the EPB’s balance account’s evolution can’t be predicted, it can only be investigated later, applying some specific tests.
based on the growth of the EPB’s deficit. This is the case for Romania. What makes the model specific for each economy is the way that the country comprehends to indebted it self.
1. If based on the growth of the country’s indebt degree occur a growth of the weight of the productive sectors in the country’s economy, these can generate a surplus value on economic level that will lead to economic growth. This strategy is a positive one and can be pointed up through ascending models: linear, exponential or growth models.
2. If based on the growth of the country’s indebt degree occur a growth of the population’s consumption, it will draw a national economy collapse in the near future. This strategy can be pointed up through quadratic models with a point of maximum, followed by a fall of the independent variable values. Unfortunately this is the Romania’s case, and from the analysis it is showed very clearly that the debts created by the Romanian government was directed to consumption and not to investment in the productive sectors.
References
1. Bera, A. K., Jarque C. M., Efficient tests for normality, homoscedasticity and serial independence
of regression residuals, Economics Letters 6 (3): 255–259, Elsevier Editors Home, 1980
2. Box G. E. P., G. M. Jenkins, The time series analysis:Forecasting and control, 1976, Holden Day,
San Francisco, 1976
3. Dickey, D.A., Fuller W.A., Distribution of the Estimators for Autoregressive Time Series with a
Unit Root, Journal of the American Statistical Association, 74, 427–431, 1979.
4. Hardwick Ph., Langmead J., Khan B., Introducere în economia politică modernă, Polirom, IAùI,
2002
5. Jaba E., Jemna D, Econometrie, Sedcom Libirs, Iaúi, 2007
6. Popescu Th., Serii de timp - AplicaĠii în analiza sistemelor, Tehnică, Bucureúti,2000
7. Pydyck R. S., Rubinffeld, Econometric Models and Econometric Forecasts, Mc. Graw-Hill Inc.,
New York, ,1991
8. Turturean C. I., Metode statistice de analiză a seriilor de timp, Sedcom Libris, Iaúi, 2006
9. ***, Raportul Annual al BNR, 2004
10. ***, Anuarul Statistic al României, Ed. Revista Română de Statistică, Bucureúti, 2006