Universidade Federal de Ouro Preto – UFOP Instituto de Ciências Exatas e Biológicas – ICEB
Departamento de Biodiversidade, Evolução e Meio Ambiente - DEBIO
__________________________________________________________________________
Dissertação de Mestrado
__________________________________________________________________________
UM EXEMPLO DE DESACELERAÇÃO DA SUCESSÃO NATURAL EM
FLORESTAS MONTANAS PÓS ABANDONO DE PLANTIO DECamellia sinensis (L.)
Kuntze (Theaceae): O PAPEL POTENCIAL DE PIONEIRAS NATIVAS NA INIBIÇÃO DA INVASÃO BIOLÓGICA.
Barbara Machado Caserio
Orientador: Prof. Dr. Sérvio Pontes Ribeiro/UFOP
2
BARBARA MACHADO CASERIO
UM EXEMPLO DE DESACELERAÇÃO DA SUCESSÃO NATURAL EM
FLORESTAS MONTANAS PÓS ABANDONO DE PLANTIO DE Camellia sinensis (L.)
Kuntze (Theaceae): O PAPEL POTENCIAL DE PIONEIRAS NATIVAS NA INIBIÇÃO DA INVASÃO BIOLÓGICA.
Dissertação de Mestrado apresentada ao Colegiado do Programa de Pós Graduação em Ecologia de Biomas Tropicais da Universidade Federal de Ouro Preto como parte dos requisitos para obtenção do título de Mestre em Ecologia de Biomas Tropicais
Orientador: Prof. Dr. Sérvio Pontes Ribeiro
3
Catalogação: www.sisbin.ufop.br
C338e Caserio, Barbara Machado.
Um exemplo de desaceleração da sucessão natural em florestas montanas pós abandono de plantio de Camellia sinensis (L.) Kuntze (Theaceae) [manuscrito]: o papel potencial de pioneiras nativas na inibição da invasão biológica / Barbara Machado Caserio. - 2015.
69f.: il.: color; grafs; tabs; mapas. Orientador: Prof. Dr. Sérvio Pontes Ribeiro.
Dissertação (Mestrado) - Universidade Federal de Ouro Preto. Instituto de Ciências Exatas e Biológicas. Departamento de Biodiversidade, Evolução e Meio Ambiente. Ecologia de Biomas Tropicais.
1. Sucessão ecologica. 2. Plantas - Competição. 3. Camellia sinensis. 4. Bioinvasão. I. Ribeiro, Sérvio Pontes. II. Universidade Federal de Ouro Preto. III. Titulo.
4
Agradecimentos
Agradeço, primeiramente, aos meus pais, por me apoiarem sempre durante toda essa jornada.
Ao professor Sérvio pela oportunidade, confiança, acolhimento, profissionalismo, competência, disposição, paciência e pela forma franca de orientação demonstrada durante a execução deste trabalho, com sugestões fundamentais para o seu desenvolvimento.
Ao Paulo, pela ajuda e paciência em todos os momentos.
Aos alunos, ex-alunos e funcionários do LEEIDSN pelos bons momentos de descontração, essenciais para o bom andamento de nossa equipe.
Aos amigos que foram encontrados durante esta caminhada (Jaque, Tássia, Grazi, Bruninha, Leo, Diego, Letizia, Roberth, Renata, Cinthia) e os antigos que sempre estiveram presentes.
Agradeço a todos que contribuíram para que este trabalho fosse realizado, tanto no campo, como no laboratório, e nas discussões sobre estudos.
Ao Herbário José Badini pela colaboração efetiva dada a esse trabalho.
Aos técnicos do DEBIO que ajudaram, sempre que possível, e ao setor de transporte da UFOP, que sempre atenderam as nossas demandas da melhor maneira possível.
5 Sumário
RESUMO... 9
ABSTRACT ... 11
CAPÍTULO 1 ... 13
1. REVISÃO TEÓRICA ... 13
1.1. Histórico do conceito de sucessão natural ... 13
1.2. Sucessão em Florestas Tropicais Montanas brasileiras ... 14
1.3. Monodominâncias ... 16
1.4. A Candeia (Eremanthus erythropappus) ... 18
1.5. Um histórico dos distúrbios em uma área de Floresta Montana do Parque Estadual do Itacolomi ... 19
2. OBJETIVOS ... 23
2.1. Objetivo geral ... 23
2.2. Objetivos específicos ... 23
3. REFERÊNCIAS BIBLIOGRÁFICAS ... 24
CAPÍTULO 2 ... 31
ABSTRACT ... 31
INTRODUCTION ... 32
METHODS ... 35
Study site ... 35
Tree census ... 36
Data analysis ... 37
RESULTS ... 38
Floristic composition and species diversity ... 38
Phytosociological parameters and community structure ... 43
β-diversity ... 53
Camellia sinensis census in monodominance area, disturbed forest and native forest ... 53
6
ACKNOWLEDGEMENTS ... 60
7 Lista de figuras
Capítulo 1
FIGURA 1: MAPAS DO USO E DE OCUPAÇÃO DA ÁREA DO PARQUE ESTADUAL DO ITACOLOMI DESDE 1966 (A); 1974 (B); 1986 (C) E
2000 (D). EM BRANCO A ÁREA DE CAMPO RUPESTRE, EM CINZA AS FLORESTAS ESTACIONAIS SEMIDECIDUAIS E EM PRETO AS
ÁREAS ANTROPIZADAS. (RETIRADAS DE FUJACO ET AL.(2010) E MODIFICADO POR CAMPOS (2012). ... 21
FIGURA 2: MAPA GEOMORFOLÓGICO DO PEIT (RETIRADAS DE FUJACO (2006)) ... 22
Capítulo 2 FIGURE 1: MONODOMINANCE AREA INDIVIDUALS DISTRIBUTION IN DIAMETER CLASSES (PBH ≥ 10CM) ... 49
FIGURE 2: MONODOMINANCE AREA ECOLOGICAL GROUP DISTRIBUTION IN DIAMETER CLASSES (PBH ≥ 10CM) ... 50
FIGURE 3: MONODOMINANCE AREA INDIVIDUALS DISTRIBUTION IN HEIGHT CLASSES (MIN: 1.5M; MAX:8.0M) ... 50
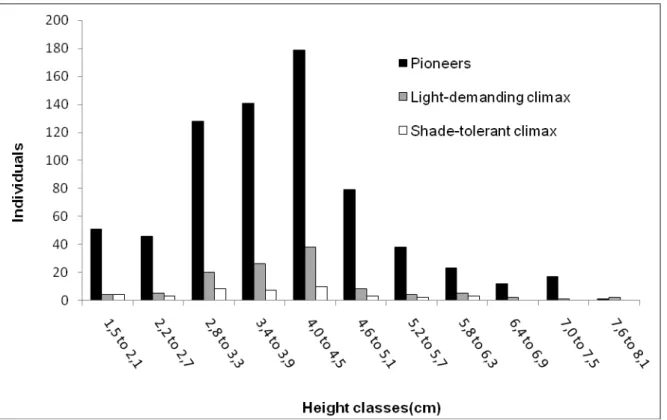
FIGURE 4: MONODOMINANCE AREA ECOLOGICAL GROUP DISTRIBUTION IN HEIGHT CLASSES (MIN: 1.5M; MAX:8.0M) ... 51
FIGURE 5: DISTURBED FOREST INDIVIDUALS DISTRIBUTION IN DIAMETER CLASSES (PBH ≥ 10CM) ... 51
FIGURE 6: DISTURBED FOREST ECOLOGICAL GROUP DISTRIBUTION IN DIAMETER CLASSES (PBH ≥ 10CM) ... 52
FIGURE 7: DISTURBED FOREST INDIVIDUALS DISTRIBUTION IN HEIGHT CLASSES (MIN: 2.0M; MAX:11.0M) ... 52
FIGURE 8: DISTURBED FOREST ECOLOGICAL GROUP DISTRIBUTION IN HEIGHT CLASSES (MIN: 2.0M; MAX:11.0M) ... 53
8 Lista de tabelas
Capítulo 2
TABLE 1: FLORISTIC LIST OF TREE SPECIES IDENTIFIED AT THE MONODOMINANCE, THE DISTURBED FOREST AND THE NATIVE FOREST,
ARRANGED ALPHABETICALLY BY BOTANICAL FAMILIES AND THEIR ECOLOGICAL GROUPS (EG) (P: PIONEER; CL:
LIGHT-DEMANDING CLIMAX E CS: SHADE-TOLERANT CLIMAX), IN ITACOLOMI STATE PARK. ... 40
TABLE 2: PHYTOSOCIOLOGICAL PARAMETERS IN THE MONODOMINANCE AREA ... 44
TABLE 3: PHYTOSOCIOLOGICAL PARAMETERS OF ECOLOGICAL GROUPS IN THE MONODOMINANCE AREA ... 45
TABLE 4: PHYTOSOCIOLOGICAL PARAMETERS AT THE DISTURBED FOREST AREA ... 47
TABLE 5: PHYTOSOCIOLOGICAL PARAMETERS OF ECOLOGICAL GROUPS AT THE DISTURBED FOREST AREA ... 48
9 RESUMO
O conhecimento da estrutura e dinâmica de populações florestais é decisivo para garantir o sucesso no manejo sustentável de florestas, além de contribuir para a compreensão de processos ecológicos e evolutivos. Este trabalho foi realizado no Parque Estadual do Itacolomi, Minas Gerais, onde o abandono do cultivo de chá (Camellia sinensis) levou ao estabelecimento de uma monodominância da espécie pioneira Eremanthus erythropappus. Testamos a hipótese de que a falta de manejo do chá levou a uma desaceleração no processo de sucessão natural, além de verificar se há um gradiente sucessional da substituição de espécies em direção à comunidade arbórea nativa. Três áreas foram amostradas: uma caracterizada por dominância de E. erythropappus, uma área adjacente de Floresta Montana com histórico de extrações de madeira e abertura de clareiras e um fragmento de Floresta Montana Nativa. Foram feitas dez parcelas de 20x20m em cada, exceto na área de mata nativa, e nelas foram identificados todos os indivíduos com CAP acima de 10cm, sendo que as frequências, densidades, dominâncias e valores de importância e cobertura foram determinados. Os resultados demonstraram que E. erythropappus é a espécie mais representativa na área dominada por candeias. Além disso, o número elevado de indivíduos de espécies pioneiras indicam que esta área se encontra ainda em um estágio inicial de sucessão. Por outro lado, a comparação da diversidade com a área de mata impactada e com a mata nativa mostra que há uma similaridade de 50% de espécies entre essas áreas, sugerindo que a sucessão natural está progredindo para a composição florística da mata nativa. O maior valor do IVI de E. erythropappus mortas na área de mata impactada e o valor decrescente no IVI de
E. erythropappus vivas indica que a permanência dessa espécie no sistema inibe o avanço da
10
nativa sugere que ele possa desacelerar a sucessão ou mesmo retroceder a estrutura florística por invasão de áreas intocadas. Por outro lado, a virtual ausência do chá junto com candeia demonstra que a capacidade inibitória desta espécie nativa, se por um lado desacelera a sucessão na floresta, por outro pode prevenir a invasão de exóticas. Esse estudo mostra que certas práticas agroflorestais mal manejadas nos trópicos podem causar a diminuição da diversidade.
11 ABSTRACT
The knowledge of structure and dynamics of forest populations is decisive to ensure success in sustainable forest management, and also collaborate with the understanding of ecological and evolutive processes. This study was held in Itacolomi State Park, Brazil, where the abandonment of the tea (Camellia sinensis) cultivation led to the establishment of an
Eremanthus erythropappus (Asteraceae) monodominance. We tested the hypothesis that large
monodominant populations of pioneer species may delay before facilitate natural succession, regardless native or invasive species. Hence, the absence of the tea menegement led to a delay in the natural succession process as well as the survival of E. erythroppapus large populations. Three areas were sampled: an area characterized by the dominance of E.
erythropappus, a Montane Forest with history of timber extraction and gaps formation, and a
control preserved forest. Ten plots of 20x20m were settled in each area, except on the preserved forest, and in them were identified all individuals above 10cm of breast height circumference, which were analyzed in terms of frequency, density, dominances and importance and coverage values. The results have shown that E. erythropappus is most representative species in the candeias dominance area, in which high mortality of this species suggest it may be a regressive population. Besides that, the high number of pioneer plants indicates that this area is in an early successional stage. On the other way, the diversity comparison with the disturbed area and with the native forest shows that there is a species similarity of 50% between these areas, suggesting that the natural succession is progressing towards the floristic composition of the native forest. The high IVI value of dead E.
erythropappus in the disturbed forest and the decreasing IVI value of living E. erythropappus
12
with an average height of 1m, indicating an invasion of C. sinensis in the native forest. The currently presence of tea at the disturbed forest and the native forest suggests that it can refrain the succession or even reverse the floristic structure through invasion of untouched areas. On the other hand, virtually absence of tea with E. erythropappus demonstrates that the inhibitory ability of this native species, if for one hand decelerates the forest succession, by the other can prevent the exotic invasion. This study shows that certain badly managed agroforestry practices in the tropics can lead to a decrease in diversity.
13
CAPÍTULO 1
1. REVISÃO TEÓRICA
1.1. Histórico do conceito de sucessão natural
A ocorrência de uma degradação ambiental causada por ação antrópica ou natural acarretará um processo de regeneração natural, no qual a cobertura vegetal da área será reestabelecida (Götsch 1995, Martins 1990). Este processo pressupõe a mudança da fisionomia e das populações num crescente em qualidade e quantidade de vida, e é chamado de sucessão natural (Götsch 1995), dado ao acréscimo, subtração e subsequente alternância de espécies que ocorre à medida que a comunidade vai progredindo em direção ao seu potencial máximo de uso dos recursos.
Henry Chandler Cowles, em 1899, foi o pioneiro no estudo da sucessão vegetal, sendo o primeiro a desenvolver um trabalho completo sobre séries sucessionais (Tansley 1935). Posteriormente a Cowles, o estudo da sucessão vegetal foi desenvolvido e consolidado principalmente por Clements (1916). De acordo com Clements o processo sucessional era ordenado e previsível, no qual a comunidade vegetal seria análoga a um organismo, que nasce, cresce, atinge a maturidade e morre. Segundo sua teoria, as mudanças na comunidade vegetal tendem a convergir em direção a um estado clímax direcionado unicamente pelo clima (Clements 1916).
14
como o substrato de origem e a posição topográfica poderiam determinar o desenvolvimento de vegetação, e não unicamente o clima, conforme defendido por Clements. Tansley (1935) sugeriu ainda que a sucessão é um processo contínuo, podendo ser interrompida por catástrofes não relacionadas ao processo sucessional.
A partir do final do século XX as explicações para a sucessão assumiram o paradigma de não-equilíbrio frente às condições do ambiente (Glenn-Lewin et al. 1992). Os estudos passaram a buscar uma interpretação evolucionária, considerando mecanismos de interação como competição e herbivoria. Também é importante ressaltar que este paradigma reconhece uma multiplicidade de mecanismo reguladores, tanto bióticos quanto abióticos (Connell & Slatyer 1977, Horn 1974, Picket 1976).
Nessa visão da dinâmica da vegetação subentende-se que os ecossistemas são sujeitos a distúrbios constantes que afetam na composição, estrutura e funções das comunidades, sendo que são concebidos como sistemas abertos e por isso sofrem influência de seu entorno.
1.2. Sucessão em Florestas Tropicais Montanas brasileiras
A sucessão secundária ocorre com a substituição da vegetação após uma perturbação na vegetação que existia anteriormente (Glenn-Lewin & Van derMaarel 1992). Considerando os mecanismos que determinam a sequência de espécies, em 1977 Connell & Slatyer apresentaram três modelos de sucessão: por facilitação, tolerância e inibição. Nas florestas montanas brasileiras, o modelo de regeneração observado tende a ser entendido como de facilitação (Tabarelli & Mantovani 1999).
15
favorável ao estabelecimento, crescimento ou desenvolvimento de outras espécies com características ecológicas diferentes das colonizadoras. Desta forma, o estabelecimento de espécies pioneiras é um pré-requisito para o estabelecimento de espécies de outros grupos (Connell & Slatyer 1977).
Segundo Tabarelli & Mantovani (1999), nas florestas montanas a riqueza e a diversidade de espécies são os primeiros componentes a retornarem a um estado próximo do inicial, depois a composição de guildas, seguida da composição florística e, por último, atributos de estrutura física (área basal e volume), exceto densidade de indivíduos. Além disso, no processo de regeneração tende-se a aumentar o percentual de espécies zoocóricas, de sub-bosque e de espécies tolerantes à sombra. Regenera-se, assim, dentro dos padrões observados para as florestas tropicais.
Famílias como Myrtaceae, Melastomataceae, Leguminosae, Rubiaceae e Lauraceae foram apontadas como de grande importância na estrutura e composição da Mata Atlântica Sub-Montana e Montana do sudeste do Brasil (Tabarelli & Mantovani 1999, Oliveira-Filho & Fontes 2000, Scudeller et al. 2001; Tabarelli & Perez 2002). A substituição das espécies se dá com o desaparecimento de espécies pioneiras, nos estágios iniciais, como as do gênero
Baccharis (Asteraceae), Dalbergia (Leguminosae) e Tibouchina (Melastomataceae), e o
aparecimento de espécies de famílias como Myrtaceae, compostas em sua maioria por espécies tolerantes a sombra, zoocóricas e espécies típicas de sub-bosque, nos estágios avançados.
16
Em fases iniciais de sucessão pode ocorrer a dominância de uma única espécie pioneira, que pode se estabelecer por períodos indeterminados, dependendo do distúrbio, da intensidade e do local (Tabarelli & Mantovani 1999). Quando tais populações se estabelecem, em especial em ecossistemas adaptados a solos edaficamente pobres, as mudanças das condições abióticas relacionadas ao acúmulo da biomassa vegetal poderão ser lentas, e toda a sucessão fica dependendo do longo ciclo de vida desta espécie, o que afeta inclusive a fauna associada e a estrutura geomorfológica do solo (Costa et al. 2010). Desta maneira, mesmo que a longo prazo haja um processo de sucessão por facilitação, por um certo período de tempo esta espécie altamente dominante caracterizará uma inibição sucessional (Connell & Slatyer 1977).
1.3. Monodominâncias
As florestas tropicais são conhecidas por possuírem uma alta variedade de espécies. Entretanto, florestas que apresentam o dossel dominado por uma única espécie arbórea podem ser encontradas (Richards 1996). Florestas monodominantes tropicais são vegetações raras onde uma única espécie ocupa mais de 60% do número de indivíduos ou da área basal total da floresta (Connell & Lowman 1989). Estudos realizados na África demonstraram que uma única espécie pode dominar mais do que 80% do dossel (Hart et al. 1989). A ocorrência de florestas monodominantes foi relatada em vários lugares do mundo (Higashikawa 2009).
17
1989), e uma dominância de cerca de 80 a 100% pode ser encontrada em alguns casos (Connell & Lowman 1989). A espécie dominante não é pioneira e as florestas estão sob as mesmas condições das florestas mistas. Atualmente existem muitas hipóteses que tentam explicar do ponto de vista ecológico ou evolucionário os mecanismos envolvidos nas monodominâncias clássicas. São eles: a ausência de distúrbios exógenos, a tolerância à sombra e sobrevivência das sementes sob dossel denso, baixa taxa de decomposição - o que leva a baixa disponibilidade de nutrientes, sementes grandes - que conseguem penetrar numa camada grossa de serrapilheira, associações ectomicorrízicas, o padrão de frutificação, o padrão de dispersão de sementes e a resistência à herbivoria (Peh 2009).
As monodominâncias não persistentes se estabelecem em áreas após distúrbios, sendo assim consideradas florestas sucessionais (Gerhardt & Todd 2009, Nappo et al. 2000, Tabarelli & Mantovani 1999). Segundo Peh (2009), essas espécies não conseguem crescer sob seu próprio dossel e dessa forma se mantêm por uma ou poucas gerações. Vários estudos sugerem que as monodominâncias podem ser um estágio no processo de sucessão natural (Read et al. 1995, Torti et al. 2001, Hart et al. 1989 e 1995).
18
adaptação dessas espécies ao hidroperíodo da região (Luttge 1997), e à ausência de herbivoria, no caso de T. aurea (Ribeiro & Brown, 1999, 2002 e 2006). Outros exemplos de monodominância em florestas brasileiras são atribuídos às espécies florestais Myracrodruon
urundeuva (Anacardiaceae) (Oliveira et. al 2014), Mimosa scabrella (Leguminosae) (Klein
1981), Tabebuia cassinoides (Armelin et. al 1996), Calophyllum brasiliense (Bendazoli et al
1996), e Araucaria angustifolia (Hueck 1972).
1.4. A Candeia (Eremanthus erythropappus)
A espécie Eremanthus erythropappus, conhecida popularmente como candeia, pertence à família Asteraceae e é uma espécie muito característica das florestas estacionais semideciduais do sudeste brasileiro e comum, também, em campos rupestres e florestas mesófilas, estabelecendo-se nestas últimas após perturbações (Oliveira Filho et al. 2004). É caracterizada pela alta resistência, durabilidade e poder energético de sua madeira. Possui um óleo essencial cujo princípio ativo, o α-bisabolol, exibe propriedades antiflogísticas, antibacterianas, antimicóticas e dermatológicas (Pedralli 1997).
19
Os candeais se comportam similarmente a matas com espécies arbóreas típicas de estágios sucessionais iniciais (CETEC 1996, Santana 2010, Silva 2001, Werneck et al. 2000). Isso indica que, após uma perturbação, a predominância de candeias pode ser considerada um estágio inicial de uma sucessão secundária (Hart et al. 1989).
Esta situação pode ser aplicada, por um lado, no modelo de facilitação, que diz que as fases iniciais da sucessão natural podem ser dominadas por uma única espécie pioneira, que pode se estabelecer por períodos indeterminados, mas ao longo de sua existência alterar o solo e outros elementos do habitat, facilitando a entrada de novas espécies (Connell & Slatyer 1977). Este modelo aplica-se quando se olha para o candeal e para fauna típica de ambientes florestais, que certamente são atraídas pela presença das condições microclimáticas criadas pela população de candeia. Por outro lado, a predominância competitiva de um candeal pode também configurar uma inibição relativa no que tange a outras espécies arbóreas. Por décadas, embora modifique e crie condições edáficas para uma floresta mais diversa, a candeia de fato exibirá uma ação inibitória para outras espécies de árvores, como descrito em Campos (2012).
1.5. Um histórico dos distúrbios em uma área de Floresta Montana do Parque
Estadual do Itacolomi
20
climática de Köppen (Álvares et al. 2013). As temperaturas médias anuais oscilam entre 17,4 e 19,8°C (Lourenço 2015).
Em termos geológicos, a região pertence à porção sudeste do Quadrilátero Ferrífero. De acordo com Ferreira & Magalhães (1977 apud Kamino et al. 2008), os solos na Cadeia do Espinhaço são rasos, pobres e pedregosos com baixa capacidade de retenção de água. Localmente, a geomorfologia do Parque consiste na presença de quartzito ferruginoso, depósitos de elúvios-coluviais (canga), quartzitos e metaconglomerados, associação de xisto e quartzito ferruginoso (Fujaco 2007).
Devido à elevada heterogeneidade ambiental, a cobertura vegetal apresenta ampla diversificação fisionômica, sendo que as principais formações fitofisionômicas encontradas no Parque são as campestres, como os Campos Rupestres, e as florestais, com Floresta Estacional Semidecidual Montana (Veloso et al. 1991).
21
Figura 1: Mapas do uso e de ocupação da área do Parque Estadual do Itacolomi desde 1966 (A); 1974 (B); 1986 (C) e 2000 (D). Em branco a área de campo rupestre, em cinza as Florestas Estacionais Semideciduais e em preto as áreas antropizadas. (Retiradas de Fujaco et al.(2010) e modificado por Campos (2012).
As plantações de chá foram abandonadas, sem a aplicação de nenhuma técnica de manejo, e a regeneração aconteceu naturalmente com a substituição dos indivíduos de C.
sinensis pelos de E. erythropappus, caracterizando o estabelecimento de uma
monodominância de candeia. Além disso, em áreas da floresta adjacente às plantações de chá ocorreram aberturas de clareiras com a extração pontual de madeira para a alimentação dos fornos.
22
por Fujaco (2007), ambas as áreas se encontram na unidade geomorfológica 1 (UM_1) apresentado uma litologia em sua maioria de filitos e xistos, e em menor escala de quartzitos ferrugionosos e cangas (Figura 2).
23 2. OBJETIVOS
2.1. Objetivo geral
O presente trabalho teve como objetivo comparar a composição florística e a estrutura da comunidade arbórea de uma área onde houve o abandono da monocultura de chá (C.
sinensis), com posterior estabelecimento de uma população dominante de candeia (E.
erythropappus), e a área adjacente de floresta manejada, de forma a inferir processos
sucessionais e dinâmicas de substituição de espécies.
2.2. Objetivos específicos
Verificar a composição florística e os parâmetros fitossociológicos e estruturais em
ambas as áreas sucessionais estudadas no PEIT.
Verificar se há invasão de chá (C. sinensis) na área de mata nativa adjacente à área de
estudo.
Testar a hipóteses de que espécies pioneiras capazes de formar densas populações
24 3. REFERÊNCIAS BIBLIOGRÁFICAS
ALVARES, C.A.; STAPE, J.L.; SENTELHAS, P.C.; GONÇALVES, J.L.M.; SPAROVEK, G. 2013. Ko¨ppen‟s climate classification map for Brazil. Meteorologische Zeitschrift , v. 22, n. 6, p. 711-728.
ANTUNES, F.Z. 1986. Caracterização climática do Estado de Minas Gerais. Informe
Agropecuário, v.12, n.138, p.9-13.
ARMELIN, M. J. C.; PINHEIRO, L. A. V.; PAULO, R. A.; MARCHESINI, M.; VIANA, V. M. 1996. Levantamento, localização, dimensionamento e caracterização das florestas de Tabebuia cassinoides (Lam) DC. em São Sebastião. In: FOREST, 4., 1996, Belo Horizonte.
Biosfera, 1996. p. 122-123.
BENDAZOLI, A.; D‟ERCOLE, R. L.; LAM, M. 1996. Descrição da dinâmica da vegetação de restinga no estado de São Paulo. In: FOREST, 4., 1996, Belo Horizonte. Biosfera, 1996. p. 208-209.
CAMPOS, N. R. 2012. Aptidão reprodutiva e estrutura de um candeial com elevada
mortalidade. 90f. Dissertação (Mestrado em Ecologia de Biomas Tropicais) - Universidade
Federal de Ouro Preto, Ouro Preto.
CARVALHO, P. E. R. 1994. Espécies florestais brasileiras: recomendações silviculturais, potencialidade e uso da madeira. Brasília: EMBRAPA-CNPF, 640 pp.
CETEC-1996. Ecofisiologia da „candeia‟. Belo Horizonte: SAT/CETEC, 104 pp. (Relatório técnico).
25
CONNELL, J.H. & SLATYER, R.O. 1977. Mechanisms of succession in natural communities and their role in community stability and organization. American Naturalist
111:1119-1144.
CONNELL, J.H. & LOWMAN, M.D. 1989. Low-diversity tropical rain forests: some possible mechanisms for their existence. American Naturalist, 134, 88–119.
COSTA, C. B., RIBEIRO, S. P., CASTRO, AMORIM, P.T. 2010. Ants as Bioindicators of Natural
Succession in Savanna and Riparian Vegetation Impacted by Dredging in the Jequitinhonha River
Basin, Brazil. Restoration Ecology. , 63: 148 - 157.
FERREIRA, M.B. & MAGALHÃES, G.M. 1977. Contribuição para o conhecimento da vegetação da Serra do Espinhaço em Minas Gerais (Serra do Grão Mogol e da Ibitipoca). IN:
Congresso Nacional de Botânica, 26, Rio de Janeiro, 1975. Anais ... Rio de Janeiro. p.
189-202.
FUJACO, M.A.G.; LEITE, M.G.P.; RIBEIRO, S.P. AND ORNELAS, A.R. 2006. Controle geomorfológico e antrópico na distribuição de cadeias (Eremanthus sp.) no Parque Estadual do Itacolomi, Minas Gerais. In: VI Simpósio Nacional de Geomorfologia, Goiânia.
FUJACO, M. A. G. 2007. Influência dos Diferentes tipos de Substrato e Geomorfologia na Distribuição Espacial e Estrutura Arquitetônica do gênero Eremanthus sp., no Parque
Estadual do Itacolomi, Ouro Preto/MG. Dissertação de mestrado apresentado no Programa de
Pós-Graduação em Evolução Crustal e Recursos Naturais. Universidade Federal de Ouro Preto. 113 pp.
26
GERHARDT, K. & TODD, C. 2009. Natural regeneration and population dynamics of the tree Afzelia quanzensis in woodlands in Southern Africa. African Journal of Ecology 47: 583 -591.
GLEASON, H. A. 1926. The individualistic concept of the plant association. Bulletin Torrey
Botanical Club 53:7-26.
GÖTSCH, E. Break-through in agriculture. Rio de Janeiro: AS-PTA. 1995. 22p.
GLENN-LEWIN, D.C. & MAAREL, E. van der. 1992. Pattern and process of vegetation dynamics. In: Glenn-Lewin, D.C.; Peet, R.K. & Veblen, T.T. (Eds). Plant Succession: theory
and prediction. Chapman & Hall. pp.11-59.
GLENN-LEWIN, D.C., PEET, R.K. & VEBLEN, T.T. 1992. Plant succession: theory and
prediction. Chapman & Hall, London.
HART, T.B. 1985. The ecology of a single-species-dominant forest and of a mixed forest in
Zaire, Africa. Ph.D. Thesis, Michigan State University, USA.
HART, T.B., HART, J.A. & MURPHY, P.G. 1989. Monodominant and species-rich forests in the humid tropics: causes for their co-occurrence. American Naturalist, 133, 613–633.
HIGASHIKAWA, E. M. 2009. Fitossociologia de um fragmento florestal com
monodominância de Euterpe edulis Mart. 36 p. Dissertação (Mestrado em Engenharia
Florestal)-Universidade Federal de Lavras, Lavras.
HORN, H.S. 1974. The ecology of secondary succession. Annual Review Ecology and
Systematics 5:25-37.
HUECK, K. 1972. A região das matas de araucária do sul do Brasil. As florestas da América
do Sul: ecologia, composição e importância econômica. São Paulo: UnB/Polígono. Cap. 22,
27
KAMINO, L. H. Y.; OLIVEIRA-FILHO, A. T.; STEHMANN, J. R. 2008. Relações florísticas entre as fitofisionomias florestais da Cadeia do Espinhaço, Brasil. Revista
Megadiversidade, vol. 4, n. 1-2. Dezembro.
KLEIN, R. M. 1981. Aspectos fitossociológicos da bracatinga (Mimosa scabrella). In: Seminário sobre atividades e perspectivas florestais, Curitiba. 1981, Anais... Curitiba: p. 145-148
LIMA, G. P. de. 2009. Avaliação do regime hídrico, geológico e geomorfológico das florestas paludosas do Parque Estadual do Itacolomi: Influência dos fatores abióticos sobre a
composição florística e fitossociológica. 68p. Dissertação (Mestrado em Evolução Crustal e
Recursos Naturais) - Universidade Federal de Ouro Preto, Ouro Preto, 2009.
LOURENÇO, G.M., CAMPOS, R.B.F. & RIBEIRO, S.P. 2015. Spatial distribution of insect guilds in a tropical montane rainforest: effects of canopy structure and numerically dominant ants. Arthropod-Plant Interactions.
LÜTTGE, U. 1997. Physiological ecology of tropical plants. Springer, New York.
MARIMON, B. S.; FELFILI, J. M.; HARIDASAN, M. 2001. Studies in monodominant forests in eastern Mato Grosso Brazil: I. A forest of Brosimum rubescens Taub. Edinburgh
Journal of Botany, 58(1):123-137.
MARTINS, F. R. 1990. Esboço histórico da fitossociologia florestal no Brasil. In: Congresso
Brasileiro de Botânica, 36. Brasília. Anais... Brasília, 1990. p. 33-58.
NAPPO, M. E., FONTES, M. A. L. & OLIVEIRA FILHO, A. T. 2000. Regeneração natural em sub-bosque de povoamentos homogêneos de Mimosa scabrella Bentham, implantados em áreas mineradas, em Poços de Caldas, Minas Gerais. Árvore 24: 297-307.
28
OLIVEIRA, F.P.; SOUZA, A.L.; FILHO, E. I.F. 2014. "Caracterização da monodominância de aroeira (Myracrodruon urundeuva Fr. All.) no município de Turumitinga – MG". Ciência
Florestal, num. Abril-Junho, pp. 299-311.
OLIVEIRA-FILHO A.T. & FONTES, M.A.L. 2000. Patterns of floristic differentiation among Atlantic Forests in Southeastern Brazil and the influence of climate. Biotropica
32:793-810.
OLIVEIRA-FILHO, A.T., CARVALHO, D.A., FONTES, M.A.L., VAN DEN BERG, E., CURI, N. & CARVALHO, W.A.C. 2004. Variações estruturais do compartimento arbóreo de uma floresta semidecídua alto-montana na chapada das Perdizes, Carrancas, MG. Revista
Brasileira de Botânica 27:291-309.
PEDRALLI, G. 1997. Estrutura diamétrica, vertical e análise do crescimento da „candeia‟
(Vanillosmopsis erythropappa Sch. Bip) na Estação Ecológica do Tripuí, Ouro Preto – MG.
Revista Árvore 21: 301-306.
PEH, K.S. 2009. The relationship between species diversity and ecosystem function
in low- and high-diversity tropical African forests. Ph.D. thesis, University of Leeds, Leeds.
PICKETT, S.T.A. 1976. Succession: an evolutionary interpretation. American Naturalist
110:107-119.
READ, J., HALLAM, P. & CHERRIER, J.-F. 1995. The anomaly of monodominant tropical rainforests: some preliminary observations in the Nothofagus-dominated rainforests of New Caledonia. Journal of Tropical Ecology 11: 359–389.
RIBEIRO, S. P. & BROWN, V. K. 1999. Insect Herbivory In Tree Crowns Of Tabebuia
Aurea And T. Ochracea (Bignoniaceae): Contrasting The Brazilian Cerrado With The
29
RIBEIRO, S. P. & BROWN, V. K. 2002. Tree species monodominance or species-rich savannas: the influence of abiotic factors in designing plant communities of the Brazilian cerrado and the Pantanal matogrossense - a review. Ecotropica 8: 31-45.
RIBEIRO, S. P. & BROWN, V. K. 2006. Prevalence of monodominant vigorous tree populations in the tropics: herbivory pressure on Tabebuia species in very different habitats.
Journal of Ecology 94: 932–941.
RICHARDS, P.W. 1996. The Tropical Rain Forest, 2nd edn, Cambridge University Press, Cambridge.
SANTANA, G. da C. 2010. Estrutura de uma floresta ombrofila densa montana com monodomiancia de dossel por Eremanthus erythropappus (DC.) MacLeish (candeia) Serra da
Mantiqueira, em Itamonte, Minas Gerais. Dissertação (mestrado) – Universidade Federal de
Lavras. 58 pp.
SCHORN, L. A.; GALVÃO, F. 2006. Dinâmica da regeneração natural em três estágios sucessionais de uma Floresta Ombrófila Densa em Blumenau, SC. Revista Floresta, Curitiba, 36: 59-74.
SCREMIN-DIAS, E., LORENZ-LEMKE, A. P. & OLIVEIRA, A. K. M. 2011. The floristic heterogeneity of the Pantanal and the occurrence of species with different adaptive strategies to water stress. Brazilian Journal of Biology 71: 275-282.
SCUDELLER, V.V., MARTINS, F.R. & SHEPHERD, G.J. 2001. Distribution and abundance of arboreal species in the atlantic ombrophilous dense forest in Southeastern Brazil. Plant Ecol. 152:185-199.
30
SILVA, E. F. 2001. Caracterização edáfica e fitossociológica em áreas de ocorrência natural
de candeia (Vanillosmopsis erythropappa Sch. Bip.). 118 p. Dissertação (Mestrado em
Engenharia Florestal) - Universidade Federal de Viçosa, Viçosa MG, 2001.
TABARELLI, M. 1997. A regeneração da floresta Atlântica montana. Tese de Doutorado, Instituto de Biociências,Universidade de São Paulo, São Paulo.
TABARELLI, M. & MANTOVANI, W. 1999. A regeneração de uma floresta tropical montana após corte e queima (São Paulo – Brasil). Revista Brasileira de Biologia 59: 239-250.
TABARELLI, M.; PERES, C. A. 2002. Abiotic and vertebrate seed dispersal in Brazilian Atlantic Forest: implications for forest regeneration. Biological Conservation, v.106, n.2, p.165-176.
TANSLEY, A. G. 1935. The use and abuse of vegetational concepts and terms. Ecology 16: 284-307.
TORTI, S.D., COLEY, P.D. & KURSAR, T.A. 2001. Causes and consequences of monodominance in tropical lowland forests. The American Naturalist 157: 141–153.
VELOSO, H.P., RANGEL-FILHO, A.L.R. & LIMA, J.C.A. 1991. Classificação da
vegetação brasileira, adaptada a um sistema universal. Rio de Janeiro: IBGE. 124 pp.
31
CAPÍTULO 2
AN EXEMPLE OF NATURAL SUCCESSION DECELERATION IN MONTANE
FORESTS AFTER THE CULTURE ABANDONMENT OF Camellia sinensis (L.)
Kuntze (Theaceae): THE ROLE OF PIONEER NATIVE SPECIES IN BIOLOGIC INVASION INHIBITION
ABSTRACT
This study was held in Itacolomi State Park, Brazil, where the abandonment of tea
(Camelia sinensis) cultivation led to the establishment of an Eremanthus erythropappus
32
current presence of tea at both disturbed and native forests suggests that it can refrain the succession or even reverse the floristic structure through invasion of untouched areas. On the other hand, virtual absence of tea with E. erythropappus demonstrates that the inhibitory ability of this native species, if for one hand decelerates the forest succession, on the other can prevent the exotic invasion. This study shows that certain badly managed agroforestry practices in the tropics can lead to a decrease in diversity.
Key-words: natural succession by inhibition, Eremanthus erythropappus, Camellia sinensis, montane forests, forest invaders, tree competition, abandoned plantations.
INTRODUCTION
Disturbances caused by human activities occurs since antiquity, with deforestation and livestock as the main consequences. With the increasing of the demand for fertile, flat and arable land, natural vegetation has been reduced, drastically pressing natural resources (Souza 2004). The forest fragmentation process has been getting more attention lately due to high deforestation rates and their effects in tropical regions (Viana et al. 1997). The degradation caused by both human and natural actions will result in a natural succession process, in which the vegetation will be re-established (Götsch 1995, Martins 1990).
33
The facilitation model occurs when one or more species occupy the disturbed area, and alter the environment making it more suitable for the establishment, growth or development of other species with different ecological characteristics, considering that the establishment of pioneer species is a prerequisite for the establishment of species from other ecological groups (Connell & Slatyer 1977). Nevertheless, in early stages of forest succession, the dominance by a single pioneer tree species may occur, which can be established for indefinite periods thus causing inhibition before starting environmental changes that will facilitate the establishment of other tree species (Tabarelli & Mantovani 1999).
Monodominant forests occur when one species occupies more than 60% of the total amount of individuals or the basal area of the forest (Connell & Lowman 1989), and are classified into two types: persistent and non-persistent (Peh 2009). The classical monodominant forests have 60% or more of their canopy formed by a single species, and the dominant species is not pioneer (Hart 1985, Connell & Lowman 1989, Hart et al. 1989). Non-persistent monodominances settle in areas after disturbances, and are therefore considered successional forests (Gerhardt & Todd 2009, Nappo et al. 2000, Tabarelli & Mantovani 1999). According to Peh (2009), these species cannot grow under its own canopy and remain for one or few generations. Several studies suggest that tropical monodominances may be an early stage in the natural succession process (Read et al. 1995, Torti et al. 2001, Hart 1989, 1995).
In Brazil, monodominances of many species can be found (Villela & Proctor 1999; Marimon et al. 2001; Ribeiro & Brown 1999, 2002 and 2006, Scremin-Dias et al. 2011; Oliveira et. al 2014, Klein 1981, Armelin et. al 1996, Bendazoli et al 1996, Hueck 1972). In montane forests or transitions to high altitude grasslands, monodominant formations of
Eremanthus erythropappus (DC.) MacLeish (Asteraceae) were registered by Silva (2001),
34
Eremanthus erythropappus, known as “candeia” (Pio-Correa 1984), is considered a
pioneer species because it has a high demand of light during its development (CETEC 1996, Carvalho 1994, Campos 2012). It‟s an usual plant species in semideciduous forests in southeastern Brazil, and is also common in campos rupestres (rocky outcrops or high altitude grasslands) and rainforests (Oliveira Filho et al. 2004). A “candeal” is a pioneer formation of
an E. erythropappus dominant population that settled after the forest disturbances.
Eremanthus erythropappus numbers decrease gradually as the forest becomes more
structured, showing that the predominance of this species can be considered an early stage of a secondary succession (Hart et al. 1989, Pedralli 1997, Schorn & Galvão 2006, Silva 2001, Campos 2012).
The Itacolomi State Park in southeastern Brazil has a well-known historic of anthropic impacts since the sixteenth century. About 50 years ago, the abandonment of the black tea
(Camellia sinensis (L.) Kuntze (Theaceae) cultivation led to the establishment of an E.
erythropappus monodominance (Fujaco 2007). In this study we tested the hypothesis that
pioneer species able to form dense populations can cause inhibition of natural succession before starting facilitate modifications. This hypothesis will test two predictions: (1) The failure to eliminate tea plants after the end of the farm led to a refrained natural succession process in degraded areas due to the invasion of this species; (2) Eremanthus erythropappus
35 METHODS
Study site
Itacolomi State Park has about 7543 hectares and is located in the southern portion of the Espinhaço mountain range, between the cities of Ouro Preto and Mariana, with altitudes ranging between 900 and 1772m. The climate is classified by Koppen as Cwb, humid subtropical with dry winters and temperate summers (Álvares et al. 2013). Temperatures range from 17.4 to 19.8°C (Lourenço 2015). The area is formed by phyllites, schist, quartzite and ferrugineous rocky (Fujaco 2007). Due to the high environmental heterogeneity, the vegetation has a very diversified physiognomy, and the main phytophysionomic formations found in the Park are the campestral, with campos rupestres, and forest, with montane forests (Veloso et al. 1991).
The Park area has a long history of occupation, referring to the colonial period and gold exploration, followed by the creation of large farms and the black tea cultures until the fifties. After the end of the tea export, the tea culture areas were abandoned (Fujaco et al.
2010). In 1967 the protected area was established. Where black tea culture existed, regeneration happened naturally with settlement of E. erythropappus monodominances. This well-known land use is a unique example of the way vegetation changed during the creation of the park (Fujaco et al. 2010, Lourenço et al. 2015).
36
20°25'42"S; 43°30'20"W. As classified by Fujaco (2007), both areas have a phyllites and schist lithology.
Tree census
For the tree census of the area dominated by E. erythropappus and for the disturbed area ten 20x20m plots were allocated in each area, making a total sample area of 0.8ha. None of the selected plots were located adjacent to each other, leaving a gap of at least 20m between them. Within each plot all the arboreal individuals, alive or dead, with perimeter at breast height (PBH) ≥ 10 cm were labeled. Individuals with bifurcated trunks which were at or below PBH and with at least one ramification ≥10cm in PBH were measured separately. The individuals were labeled in loco with numbered plates, and had their number, plot number, botanical identification when known, PBH and full estimated height registered, and plant material samples were collected. The areas were visited once a month, from September/2013 to March/2015.
In the work done by Lima (2009) in the native forest, twenty-one plots were allocated, making a total sample area of 0.63 ha. Within each plot all the arboreal individuals, alive or dead, with perimeter at breast height (PBH) ≥ 15 cm were labeled. The number of individuals and species were recorded, and the total height of each individual estimated with the help of a graduated stick.
It was possible to identify dead E. erythropappus by the peculiar wood odor of the species, caused by secondary metabolites. Some vegetative characteristics of the trunk such as thick bark, with many cracks and white or gray sapwood were also used to recognize dead E.
37
All the collected specimens were identified by comparison with the herbarium specimens of the Herbarium "Professor José Badini" (OUPR) of the Universidade Federal de Ouro Preto and consultations of current literature. They were herborized and incorporated at OUPR. The species were classified in families recognized by the Angiosperm Phylogeny Group III system (APG III 2009). The specific epithets and citations of the authors of the species were standardized on the basis of the Lista de Espécies da Flora do Brasil (2015) (List of Species of the Brazilian Flora) and on the website The Plant List (2015).
All species were classified into ecological groups, and the classification was based in the light requirements, referring to work done in forests with similar vegetation. These studies used the Swayne & Whitmore (1988) classification, cited by Botelho et al. (1995). The groups defined were: pioneers (P), light-demanding climax (CL) and shade-tolerant climax (CS) species.
To verify the presence of C. sinensis in the studied areas we used the Point-Centred Quarter Method (PCQM) of Cottam & Curtis (1956). Three transects were established 100m away from each other. In each transect there was a point every 10m, totaling 10 points for
transect. For each point, the distance and height of the four individuals of C. sinensis nearest to the point in each quarter was registered. The inclusive criteria was a minimum height of 50cm.
For β-diversity comparisons we used phytosociological data obtained by Lima (2008) of an area of native forest adjacent to the study area.
Data analysis
38
phytosociological parameters (Mueller-Dombois & Ellenberg 1974) commonly used in forest surveys, including: relative frequency (FR), relative density (RD), relative dominance (DoR), importance index value (IVI) and coverage value index (CVI) calculated using Fitopac 2.1 (Shepherd 2010). The density of individuals with PBH > 10 cm and PBH > 15 cm was computed and the ratio of these two was taken as a measure of the proportion of small and large-sized individuals (Grubb et al. 1963). The range of diameter and height classes was determined by Spiegel formula (Felfili & Resende 2003). The patterns of species population structure were established based on density of species in different PBH and height classes and interpreted as indication of variation in population dynamics.
To verify β-diversity, comparisons between the areas were made using the Sørensen
similarity index based on the presence or absence of species (Mueller-Dombois & Ellenberg 1974).
To check the variance of PBH and total height between the plant categories (alive E.
erythropappus, dead E. erythropappus, other species and ecological groups) a one-way
ANOVA was used in each variable, using the software Mini Tab (McCune & Mefford 1997). The density, frequency and medium height of C. sinensis in all areas were calculated in Excel using the formulae according to Brower and Zar (1984).
RESULTS
Floristic composition and species diversity
39
In the native forest there were sampled 2127 individuals belonging to 32 families, 54 genera and 84 species.
At the area with E. erythropappus dominance, we sampled 941 individuals belonging to 16 families, 26 genera and 39 species; 69 dead individuals were identified, of which 54 were E. erythropappus and 15 other species; 10 families were represented by one species and three species had just one individual. The main families sampled were Myrtaceae, Melastomataceae and Asteraceae. Families with larger numbers of individuals sampled were Asteraceae, Melastomataceae, Myrtaceae, and Primulaceae, representing 91% of all individuals. The five most abundant species, which accounted for 73% of the sampled individuals, were E. erythropappus (469), Trembleya parviflora (143), Myrsine coriacea (28),
Myrcia venulosa (25) and Myrcia rufipes (21).
Among the 39 identified species, 51% were classified as pioneers, comprising all of the 5 most abundant species (Table 1). The light-demanding climax (CL) were represented by 36% and the shade-tolerant (CS) climax by 13% of the total amount of species in the E.
erythropappus dominance area.
At the disturbed forest 830 individuals were sampled, belonging to 24 families, 36 genera and 52 species; 30 of the 62 dead individuals identified were E. erythropappus. In 17 families there were only one species, and 7 species presented only one individual. The most sampled families were Myrtaceae, Melastomataceae and Asteraceae. Melastomataceae, Myrtaceae, Asteraceae, Primulaceae and Rubiaceae were the families with most individuals (83% of the total amount). The five most abundant species were Trembleya parviflora (63),
Myrsine umbellata (62), Psychotria vellosiana (37), Vernonanthura discolor (37) and
40
32% of the species were considered pioneers, comprising three of the most abundant species (T. parviflora, V. discolor and B. intermixta). (Table 1). The light-demanding climax species were represented by 45% and the shade-tolerant climax by 23%.
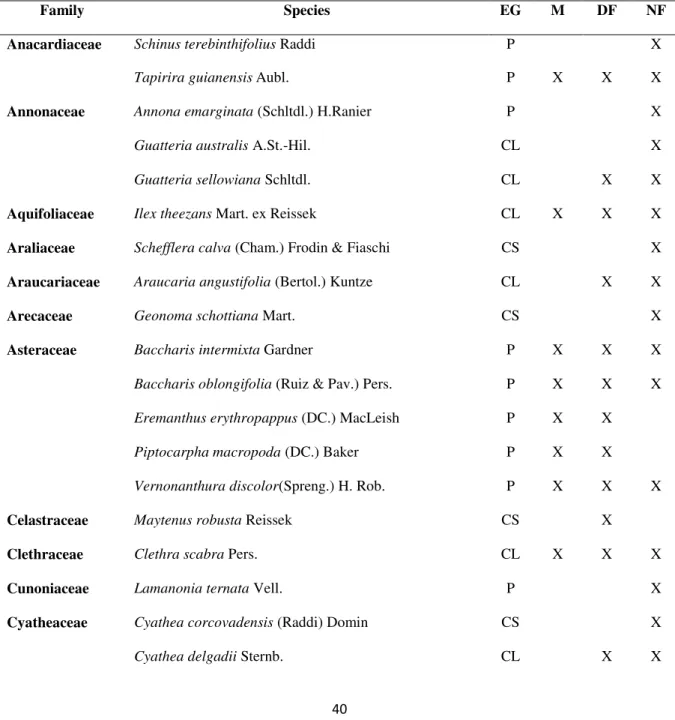
Table 1: Floristic list of tree species identified at the monodominance, the disturbed forest and the native forest, arranged alphabetically by botanical families and their ecological groups (EG) (P: pioneer; CL: light-demanding climax e CS: shade-tolerant climax), in Itacolomi State Park.
Family Species EG M DF NF
Anacardiaceae Schinus terebinthifolius Raddi P X
Tapirira guianensisAubl. P X X X
Annonaceae Annona emarginata (Schltdl.) H.Ranier P X
Guatteria australis A.St.-Hil. CL X
Guatteria sellowiana Schltdl. CL X X
Aquifoliaceae Ilex theezans Mart. ex Reissek CL X X X
Araliaceae Schefflera calva (Cham.) Frodin & Fiaschi CS X
Araucariaceae Araucaria angustifolia (Bertol.) Kuntze CL X X
Arecaceae Geonoma schottiana Mart. CS X
Asteraceae Baccharis intermixta Gardner P X X X
Baccharis oblongifolia (Ruiz & Pav.) Pers. P X X X Eremanthus erythropappus (DC.) MacLeish P X X
Piptocarpha macropoda (DC.) Baker P X X
Vernonanthura discolor(Spreng.) H. Rob. P X X X
Celastraceae Maytenus robusta Reissek CS X
Clethraceae Clethra scabra Pers. CL X X X
Cunoniaceae Lamanonia ternata Vell. P X
Cyatheaceae Cyathea corcovadensis (Raddi) Domin CS X
41
Cyathea phalerata Mart. CL X
Dicksoniaceae Dicksonia sellowiana Hook. CS X X
Euphorbiaceae Alchornea triplinervia (Spreng.) Müll. Arg. P X X X
Croton urucurana Baill. P X
Sapium glandulosum (L.) Morong P X X X
Tetrorchidium parvulum Müll. Arg. CL X
Hypericaceae Vismia brasiliensis Choisy* P X
Vismia guianensis (Aubl.) Pers. P X X
Lamiaceae Aegiphila integrifólia (Jacq.) B.D.Jacks. P X X
Aegiphila sellowiana Cham. P X
Lauraceae Nectandra nitidula Nees CL X
Nectandra oppositifolia Nees P X X
Ocotea diospyrifolia (Meisn.) Mez CL X
Ocotea lancifolia (Schott) Mez CL X
Ocotea sp. - X
Ocotea spixiana (Nees) Mez CL X X
Leguminosae Dalbergia frutescens (Vell.) Britton CL X X X
Inga sessilis (Vell.) Mart. CL X
Machaerium nyctitans (Vell.) Benth. CL X X X
Machaerium villosum Vogel P X
Senna macranthera (Collad.) H.S. Irwin & Barneby P X X
Malpighiaceae Byrsonima coccolobifolia Kunth CL X X
Melastomataceae Miconia chartacea Triana CL X X X
Miconia corallina Spring CS X X
Miconia discolor DC. CS X X X
Miconia sellowiana Naudin CL X
Miconia theaezans (Bonpl.) Cogn. P X X X
Miconia valtheri Naudin P X X
Tibouchina candolleana (Mart. ex DC.) Cogn. P X X X
42
Trembleya parviflora (D.Don) Cogn. P X X X
Meliaceae Cabralea canjerana (Vell.) Mart. CL X
Cedrela fissilis Vell. * CL X
Monimiaceae Mollinedia sp. - X
Moraceae Sorocea bonplandii (Baill.) W.C.Burger et al. CS X
Myrtaceae Marlierea cf. excoriata Mart. CS X
Marlierea obscura O. Berg CS X X X
Myrceugenia cf. alpigena (DC.) Landrum CL X
Myrceugenia miersiana (Gardner) D. Legrand & Kausel CL X
Myrceugenia sp. - X
Myrcia amazonica DC. CS X X X
Myrcia cf. crocea (Vell.) Kiaersk. CL X
Myrcia eriocalyx DC. CL X X
Myrcia laruotteana Cambess. P X
Myrcia obovata (O. Berg) Nied. CL X X X
Myrcia rufipes DC. CS X X
Myrcia splendens (Sw.) DC. CL X X X
Myrcia subverticularis (O. Berg) Kiaersk.* CL X
Myrcia vauthieriana O. Berg CL X
Myrcia venulosa DC. P X X X
Myrciaria floribunda (H. West ex Willd.) O. Berg. CS X X
Siphoneugena densiflora O. Berg CL X X
Siphoneugena crassifolia (DC.) Proença & Sobral CL X X Siphoneugena kiaerskoviana (Burret) Kausel CL X
Siphoneugena sp. - X
Nyctaginaceae Guapira hirsuta (Choisy) Lundell. CL X
Onagraceae Ludwigia anastomosans (DC.) H. Hara P X
Primulaceae Myrsine coriacea (Sw.) Roem. & Schult. P X X X
Myrsine gardneriana A. DC. CL X X X
43
Myrsine umbellata Mart. CL X X X
Proteaceae Roupala Montana Aubl. CS X
Rosaceae Prunus myrtifolia (L.) Urb. P X
Rubiaceae Amaioua guianensis Aubl. CS X X
Bathysa australis (A.St.-Hil.) Benth. & Hook.f. CL X X Cordiera elliptica (K. Schum.) Kuntze CL X X X
Guettarda sp. - X
Psychotria vellosiana Benth. CL X X X
Salicaceae Casearia sylvestris Sw.* CL X X
Sapindaceae Cupania vernalis Cambess. P X
Matayba marginata Radlk. CS X X
Matayba sp. - X
Solanaceae Solanum cladotrichum Vand. CL X X
Solanum swartzianum Roem. & Schult. P X
Symplocaceae Symplocos celastrinea Mart. ex Miq. CL X
Symplocos falcata Brand CL X
Vochysiaceae Vochysia tucanorum Mart. CL X X
Vochysia sp. - X
Winteraceae Drimys brasiliensis Miers CS X
* Species occurred in adjacent areas to the studied fragments and computed only for general characterization.
Phytosociological parameters and community structure
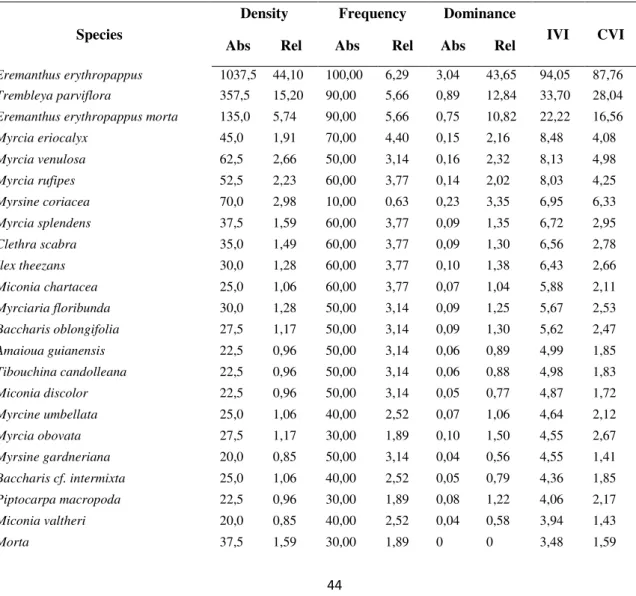
The total density in the monodominance was 2353 ind ha-1, and total basal area was 12.7 m3 ha-1. Shannon-Wiener Diversity Index (H') was 2.35 and Pielou`s Equitability Index (J‟) was 0.63.
Eremanthus erythropappus was the most representative species in the
44
eriocalyx (8%) and Myrcia venulosa (8%). The coverage value index followed the IVI just until M. eriocalyx (4,08%), which makes Asteraceae (E. erythropappus) the cover dominant at the family level.
According to the parameters used to estimate dominance in relation with the community, with a 43.6% DoR, a 94% IVI and a 87.7% CVI E. erythropappus was considered dominant in the study site. The higher frequency and density of pioneer species give this group more importance (IVI: 199% P, 59% CL and 41% CS) (Table 3). CS had 40 individuals and were in third place with the lowest values for all parameters (FrR: 32,1%; DeR: 4,6% and DoR: 4,5%).
Table 2: Phytosociological parameters in the monodominance area
Species
Density Frequency Dominance
IVI CVI
Abs Rel Abs Rel Abs Rel
Eremanthus erythropappus 1037,5 44,10 100,00 6,29 3,04 43,65 94,05 87,76
Trembleya parviflora 357,5 15,20 90,00 5,66 0,89 12,84 33,70 28,04
Eremanthus erythropappus morta 135,0 5,74 90,00 5,66 0,75 10,82 22,22 16,56
Myrcia eriocalyx 45,0 1,91 70,00 4,40 0,15 2,16 8,48 4,08
Myrcia venulosa 62,5 2,66 50,00 3,14 0,16 2,32 8,13 4,98
Myrcia rufipes 52,5 2,23 60,00 3,77 0,14 2,02 8,03 4,25
Myrsine coriacea 70,0 2,98 10,00 0,63 0,23 3,35 6,95 6,33
Myrcia splendens 37,5 1,59 60,00 3,77 0,09 1,35 6,72 2,95
Clethra scabra 35,0 1,49 60,00 3,77 0,09 1,30 6,56 2,78
Ilex theezans 30,0 1,28 60,00 3,77 0,10 1,38 6,43 2,66
Miconia chartacea 25,0 1,06 60,00 3,77 0,07 1,04 5,88 2,11
Myrciaria floribunda 30,0 1,28 50,00 3,14 0,09 1,25 5,67 2,53
Baccharis oblongifolia 27,5 1,17 50,00 3,14 0,09 1,30 5,62 2,47
Amaioua guianensis 22,5 0,96 50,00 3,14 0,06 0,89 4,99 1,85
Tibouchina candolleana 22,5 0,96 50,00 3,14 0,06 0,88 4,98 1,83
Miconia discolor 22,5 0,96 50,00 3,14 0,05 0,77 4,87 1,72
Myrcine umbellata 25,0 1,06 40,00 2,52 0,07 1,06 4,64 2,12
Myrcia obovata 27,5 1,17 30,00 1,89 0,10 1,50 4,55 2,67
Myrsine gardneriana 20,0 0,85 50,00 3,14 0,04 0,56 4,55 1,41
Baccharis cf. intermixta 25,0 1,06 40,00 2,52 0,05 0,79 4,36 1,85
Piptocarpa macropoda 22,5 0,96 30,00 1,89 0,08 1,22 4,06 2,17
Miconia valtheri 20,0 0,85 40,00 2,52 0,04 0,58 3,94 1,43
45
Tibouchina granulosa 20,0 0,85 30,00 1,89 0,05 0,72 3,45 1,57
Miconia theaezans 20,0 0,85 30,00 1,89 0,05 0,71 3,45 1,56
Marlierea obscura 15,0 0,64 30,00 1,89 0,05 0,79 3,31 1,43
Machaerium nyctitans 10,0 0,43 20,00 1,26 0,09 1,23 2,91 1,66
Alchornea triplinervia 10,0 0,43 30,00 1,89 0,03 0,46 2,77 0,89
Myrcia amazonica 10,0 0,43 30,00 1,89 0,02 0,34 2,65 0,76
Dalbergia frutescens 7,5 0,32 30,00 1,89 0,01 0,18 2,39 0,50
Vernonanthura discolor 15,0 0,64 20,00 1,26 0,03 0,43 2,33 1,07
Cordiera elliptica 10,0 0,43 20,00 1,26 0,02 0,35 2,03 0,77
Psychotria vellosiana 7,5 0,32 20,00 1,26 0,02 0,31 1,89 0,63
Vismia guianensis 7,5 0,32 20,00 1,26 0,02 0,23 1,81 0,55
Byrsonima coccolobifolia 5,0 0,21 20,00 1,26 0,01 0,19 1,66 0,40
Senna macranthera 5,0 0,21 20,00 1,26 0,01 0,17 1,64 0,38
Sapium glandulosum 7,5 0,32 10,00 0,63 0,03 0,43 1,37 0,75
Aegiphila integripholia 5,0 0,21 10,00 0,63 0,01 0,16 1,00 0,37
Nectandra oppositifolia 2,5 0,11 10,00 0,63 0,01 0,15 0,89 0,26
Casearia sylvestris 2,5 0,11 10,00 0,63 0,00 0,07 0,81 0,18
Tapirira guianensis 2,5 0,11 10,00 0,63 0,00 0,05 0,78 0,15
Table 3: Phytosociological parameters of ecological groups in the monodominance area
EG
Density Frequency Dominance
IVI CVI
Abs Rel Abs Rel Abs Rel
Pioneer 1792,5 82,22 100,00 35,71 5,04 81,25 199,19 163,48 Light-demanding climax 287,5 13,19 90,00 32,14 0,88 14,22 59,55 27,41 Shade-tolerant climax 100,0 4,59 90,00 32,14 0,28 4,53 41,26 9,12
12% of the individuals had a PBH between 10 and 15cm, where 43.7% were alive E.
erythropappus, and 56.3% were other species. That means a proportion of one small
individual to every eight large-sized individuals.
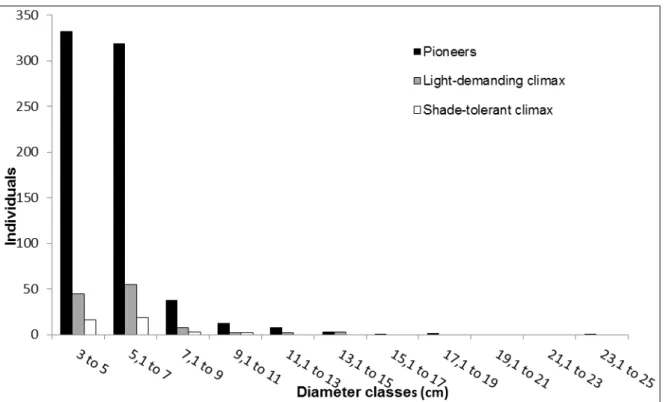
The overall diameter average was 5.9cm, and most individuals were in 3-5cm and 5-7cm diameter classes. The species distribution was irregular in the first couple of classes, since there was a difference between the second and the first class. All species presented a negative exponential pattern from the second class (Figure 1). The diameter distribution was different between dead E. erythropappus and the other groups (F2;925= 39.84; p< 0,05).
shade-46
tolerant climax were irregular in the first couple of classes, and then kept a negative exponential pattern (Figure 2). Variance analysis didn‟t showed difference between the ecological groups (F2;869 =0.59; p>0.05)
The overall average for the height was 3.8cm. The distribution of individuals in height showed discontinuation on all groups, mostly in major and minor classes of height (Figure 3). Most individuals were in the 4.0 to 4.5m class, very close to the overall average. Variance analysis showed no difference between the categories height (F2;798 =2.85; p>0.05).
Pioneers and CS also presented discontinuation in major and minor classes of height. On the other way, CL showed a normal pattern of distribution (Figure 4). The species distribution of ecological groups in height classes were not different between each other (F2;869 = 0.62; p> 0.05).
In the disturbed forest area, total density was 2075 individuals ha-1, total basal area was 13.1m² per hectare. Shannon-Wiener Diversity Index (H') was 3.62 and Pielou`s Equitability Index (J‟) was 0.90.
Trembleya parviflora was the most representative species in the phytosociological
parameters (FR: 3.86%; DoR: 8.80%; DR: 7.58%; IVI: 20%) (Table 4). It was followed by
Myrsina umbellata (17%), Psychotria vellosiana (16%), dead E. erythropappus (13%), and
Myrsine coriacea (11%). The coverage value index followed the IVI just until M. coriacea
(7.40%), which makes Primulaceae (M. umbellata and M. coriacea) the cover dominant at the family level.
47
also in third place with the lowest values for all parameters (FrR: 33,3%; DeR: 15,2% e DoR: 14,0%).
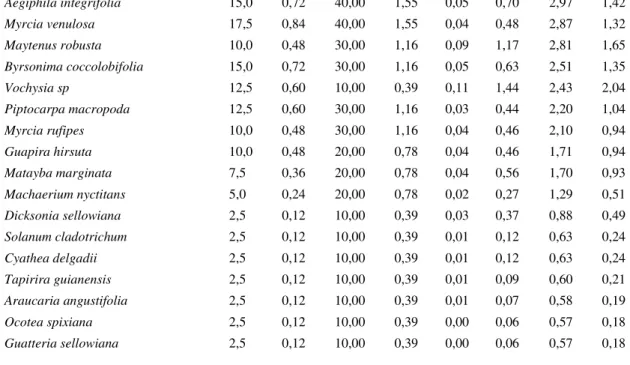
Table 4: Phytosociological parameters at the disturbed forest area
Species
Density Frequency Dominance
IVI CVI
Abs Rel Abs Rel Abs Rel
Trembleya parviflora 157,5 7,59 100,00 3,88 0,69 8,80 20,27 16,40
Myrcine umbellata 155,0 7,47 100,00 3,88 0,50 6,41 17,76 13,88
Psychotria vellosiana 92,5 4,46 90,00 3,49 0,64 8,24 16,19 12,70
Eremanthus erythropappus morta 75,0 3,61 90,00 3,49 0,48 6,08 13,18 9,69
Myrsine coriacea 80,0 3,86 100,00 3,88 0,28 3,55 11,29 7,41
Baccharis cf. intermixta 85,0 4,10 90,00 3,49 0,28 3,62 11,21 7,72
Vernonanthura discolor 92,5 4,46 70,00 2,71 0,27 3,51 10,68 7,97
Cordiera elliptica 72,5 3,49 80,00 3,10 0,26 3,34 9,93 6,83
Miconia sellowiana 57,5 2,77 80,00 3,10 0,29 3,69 9,56 6,46
Myrcia amazonica 57,5 2,77 70,00 2,71 0,22 2,81 8,29 5,58
Marlierea obscura 67,5 3,25 60,00 2,33 0,20 2,56 8,14 5,81
Myrciaria floribunda 62,5 3,01 70,00 2,71 0,15 1,87 7,60 4,88
Amaioua guianensis 57,5 2,77 80,00 3,10 0,13 1,65 7,52 4,42
Miconia valtheri 57,5 2,77 60,00 2,33 0,18 2,36 7,46 5,13
Miconia discolor 47,5 2,29 60,00 2,33 0,20 2,61 7,23 4,90
Eremanthus erythropappus 72,5 3,49 40,00 1,55 0,16 2,00 7,05 5,50
Miconia theaezans 37,5 1,81 60,00 2,33 0,21 2,66 6,79 4,47
Miconia chartacea 50,0 2,41 50,00 1,94 0,17 2,23 6,57 4,64
Morta 80,0 3,86 70,00 2,71 0 0 6,57 3,86
Clethra scabra 47,5 2,29 70,00 2,71 0,12 1,56 6,57 3,85
Ilex theezans 35,0 1,69 70,00 2,71 0,12 1,48 5,88 3,16
Siphoneugena widgreniana 42,5 2,05 60,00 2,33 0,12 1,50 5,87 3,55
Myrcia obovata 37,5 1,81 60,00 2,33 0,13 1,65 5,78 3,46
Myrcia splendens 47,5 2,29 50,00 1,94 0,12 1,54 5,77 3,83
Tibouchina candolleana 27,5 1,33 60,00 2,33 0,10 1,29 4,94 2,61
Myrcia eriocalyx 27,5 1,33 50,00 1,94 0,13 1,63 4,90 2,96
Tibouchina granulosa 32,5 1,57 50,00 1,94 0,10 1,26 4,77 2,83
Vochysia tucanorum 15,0 0,72 50,00 1,94 0,12 1,50 4,16 2,22
Sapium glandulosum 10,0 0,48 20,00 0,78 0,21 2,71 3,97 3,19
Miconia corallina 27,5 1,33 40,00 1,55 0,08 0,96 3,84 2,29
Dalbergia frutescens 22,5 1,08 40,00 1,55 0,09 1,12 3,75 2,20
Baccharis oblongifolia 22,5 1,08 40,00 1,55 0,06 0,81 3,44 1,89
Myrsine gardneriana 20,0 0,96 40,00 1,55 0,06 0,83 3,34 1,79
Vismia guianensis 17,5 0,84 40,00 1,55 0,07 0,85 3,25 1,70
Siphoneugena densiflora 20,0 0,96 20,00 0,78 0,12 1,51 3,24 2,47
Bathysa australis 17,5 0,84 20,00 0,78 0,12 1,52 3,13 2,36
48
Aegiphila integrifolia 15,0 0,72 40,00 1,55 0,05 0,70 2,97 1,42
Myrcia venulosa 17,5 0,84 40,00 1,55 0,04 0,48 2,87 1,32
Maytenus robusta 10,0 0,48 30,00 1,16 0,09 1,17 2,81 1,65
Byrsonima coccolobifolia 15,0 0,72 30,00 1,16 0,05 0,63 2,51 1,35
Vochysia sp 12,5 0,60 10,00 0,39 0,11 1,44 2,43 2,04
Piptocarpa macropoda 12,5 0,60 30,00 1,16 0,03 0,44 2,20 1,04
Myrcia rufipes 10,0 0,48 30,00 1,16 0,04 0,46 2,10 0,94
Guapira hirsuta 10,0 0,48 20,00 0,78 0,04 0,46 1,71 0,94
Matayba marginata 7,5 0,36 20,00 0,78 0,04 0,56 1,70 0,93
Machaerium nyctitans 5,0 0,24 20,00 0,78 0,02 0,27 1,29 0,51
Dicksonia sellowiana 2,5 0,12 10,00 0,39 0,03 0,37 0,88 0,49
Solanum cladotrichum 2,5 0,12 10,00 0,39 0,01 0,12 0,63 0,24
Cyathea delgadii 2,5 0,12 10,00 0,39 0,01 0,12 0,63 0,24
Tapirira guianensis 2,5 0,12 10,00 0,39 0,01 0,09 0,60 0,21
Araucaria angustifolia 2,5 0,12 10,00 0,39 0,01 0,07 0,58 0,19
Ocotea spixiana 2,5 0,12 10,00 0,39 0,00 0,06 0,57 0,18
Guatteria sellowiana 2,5 0,12 10,00 0,39 0,00 0,06 0,57 0,18
Table 5: Phytosociological parameters of ecological groups at the disturbed forest area
EG
Density Frequency Dominance
IVI CVI
Abs Rel Abs Rel Abs Rel
Light-demanding climax 860,0 43,32 100,00 33,33 3,38 43,79 120,45 87,12 Pioneer 822,5 41,44 100,00 33,33 3,25 42,15 116,92 83,59 Shade-tolerant climax 302,5 15,24 100,00 33,33 1,08 14,05 62,62 29,29
The PBH of 9.71% of the individuals was between 10 and 15cm, where 2.6% were alive E. erythropappus and 97.4% were other species. That means a proportion of one small individual to every 11 large-sized individuals.