Sandra Sanches
Dissertation presented to obtain the Ph.D degree in
Engineering and Technology Sciences, Chemical Engineering
Instituto de Tecnologia Química e Biológica | Universidade Nova de Lisboa
Insert here an image
with rounded corners
Sandra Marisa Lourenço Sanc
Dissertation presented to obtai
Engineering and Technology Sc
and Photolysis Pro
Drinking Water Tre
Engineering and Technology Sc
Instituto de Tecnologia Química e Bi
Oeiras, December 2013
nches
tain the Ph.D degree in
Sciences, Chemical Engineering
rocesses for
Treatment
Sciences, Chemical Engineering
ITQB-UNL and IBET, Microbiology of Man-made Environments Laboratory Instituto de Tecnologia Química e Biológica, Universidade Nova de Lisboa and Instituto de Biologia Experimental e Tecnológica
Apartado 12, 2781-901 Oeiras, Portugal
Fax: +351 21 442 11 61; Phone: +351 21 446 95 52 http://www.itqb.unl.pt
http://www.ibet.pt
Copyright © 2013 by Sandra Sanches All Rights Reserved
Prof. João Crespo:Full Professor at the Chemistry Department of FCT-UNL
(supervisor).
Dr. Vanessa Pereira: Post-doctoral researcher at the Microbiology of Man-Made
Environments Laboratory, IBET and ITQB-UNL (co-supervisor).
ACKNOWLEDGEMENTS
O trabalho conducente à elaboração desta tese teve o apoio financeiro da Fundação para a Ciência e Tecnologia (FCT) e do FSE no âmbito do quadro Comunitário de apoio, BD nº 72244/2010. O trabalho desenvolvido teve também o apoio do IBET e ITQB-UNL.
Muitos são aqueles a quem quero expressar a minha gratidão por me terem encorajado e ajudado, contribuindo para a concretização desta etapa.
À Doutora Vanessa Pereira, minha orientadora, agradeço por me ter guiado ao longo de vários anos e por todo o conhecimento e rigor científico que me transmitiu.
Vanessa, amiga, “irmã”, muito obrigada por estares sempre disponível para me ouvir e “aturar” os meus desânimos face aos resultados menos bons ou aos altos e baixos da vida. Obrigada por teres estado sempre lá, mesmo que fosse à distância de um
“click”, por teres sempre uma palavra de conforto e por me mostrares sempre os dois
lados da “moeda”. O teu bom senso, generosidade com todos os que te rodeiam e rigor em tudo o que fazes caracterizam-te e inspiraram-me durante o meu percurso. Guardo com carinho os teus conselhos e os momentos de cumplicidade!
Ao Professor João, meu orientador, agradeço também por me ter guiado numa viagem repleta de valiosas discussões científicas que tantas vezes me fizeram olhar para os vários assuntos de uma outra perspetiva. Foi um privilégio poder beneficiar da sua experiência e quantidade incrível de conhecimentos que tem para transmitir. Obrigada pelo apoio, confiança e por me fazer acreditar que sou capaz, ajudando-me a crescer não só profissionalmente mas também pessoalmente. Foi um prazer fazer esta viagem consigo!
ruidosas que não são habituais num laboratório de microbiologia. Obrigada pelos seus
“inputs”, pela sua boa disposição e por tornar o seu laboratório num local onde nos
sentimos em casa e gostamos de trabalhar. O meu muito obrigada também por tornar os meus fins de tarde, a caminho de casa, mais animados com conversas banais sobre cultura, viagens, política e tantas histórias tão bem humoradas que são autênticas lições de vida. Vou guardar esses momentos de descontração comigo!
Aos meus colegas da Microbiologia, especialmente aqueles que estiveram lá desde o primeiro dia e que ainda lá se encontram: Filipa e Paula. Também àqueles que já partiram em busca de novas aventuras Rusa, Marta, Bárbara, Catarina e Joana Galinha e àqueles que se juntaram mais tarde: Dulce, Beatriz e Joana Lamego. Muito obrigada pelo vosso companheirismo e momentos de descontração! Gilda,
minha companheira de “gym”, obrigada também pelas conversas bem-humoradas na passadeira do “holmicos” e pelos momentos de cumplicidade e descontração nas aulas de zumba.
À Cláudia Galinha, agradeço todo o empenho em transmitir-me os seus conhecimentos em modelação e as muitas e valiosas discussões nesta área.
À Paula Chicau e à Cristina Leitão, agradeço o apoio técnico, a disponibilidade sempre demonstrada para ajudar-me e o companheirismo. Agradeço também a colaboração da Doutora Paula Passarinho, da Doutora Clarisse Nunes e do Doutor Frederico Ferreira. Ao Engenheiro Vitor Cardoso, Ana Penetra, Alexandre Rodrigues, Engenheira Maria João Benoliel e Doutora Elisabete Ferreira, da Empresa Portuguesa das Águas Livres, quero expressar a minha sincera gratidão pela excelente colaboração, essencial para a concretização desta tese.
Ao Doutor Sebastien Logette e à sua equipa da Veolia Environnement Recherche & Innovation, Maisons Laffitte, France, agradeço por me terem recebido e ensinado técnicas e metodologias que contribuíram para o alargamento dos meus conhecimentos e por me permitirem contactar diretamente com problemas reais.
Aos meus amigos, agradeço toda a amizade. O vosso apoio, mesmo que por vezes à distância, foi muito importante! Um obrigado especial à Inês Oliveira e à Inês Veiga. Inês Veiga, a tua amizade ficará para sempre associada à minha tese, através da bonita fotografia gentilmente cedida para a capa.
À minha família, quero agradecer todo o apoio. Um obrigado muito especial àqueles que me acolheram em Paris durante o meu estágio na Veolia; o vosso apoio e carinho foram fundamentais e fizeram-me sentir realmente em casa!
Aos meus pais, dedico esta tese. Obrigada por estarem presentes em todos os momentos da minha vida e por me apoiarem incondicionalmente. Vocês são o meu exemplo de integridade, humildade, dedicação e trabalho. Mostram-me todos os dias que nada se faz sem esforço e que é sempre possível fazer mais, mesmo quando as forças nos querem abandonar e pensamos que já não somos capazes de prosseguir. O orgulho que vejo nos vossos olhos é aquilo que me motiva a continuar e a querer fazer sempre mais e melhor. É um orgulho ser vossa filha!
ABSTRACT
Water is a fundamental resource for life. The presence of hazardous micropollutants such as pesticides and hormones in drinking water sources as well as the evidence of their presence in several treated waters raised concerns regarding the quality of the water intended for human consumption. The development of new technologies which are able to cope with these micropollutants and ensure the fulfillment of future more stringent regulations is therefore needed. Low pressure ultraviolet direct and indirect photolysis (using hydrogen peroxide and titanium dioxide) and nanofiltration are extremely promising technologies to effectively remove organic micropollutants from water. Nevertheless, there are some challenges related with their application: namely, the formation of photolysis by-products and the need to remove titanium dioxide particles downstream from the photocatalysis process, as well as the development of membrane fouling and formation of a concentrated retentate during nanofiltration.
In this study, the potential of either low pressure ultraviolet direct photolysis, titanium dioxide photocatalysis or nanofiltration to remove several pesticides (atrazine, isoproturon, diuron, alachlor, pentachloropnenol, and chlorfenvinphos) and hormones (17-estradiol, 17-ethinylestradiol, estrone, estriol, and progesterone) from drinking water sources was evaluated. A configuration that combines ultraviolet photolysis and nanofiltration technologies in sequence was assembled to tackle the aforementioned challenges and produce high quality drinking water in terms of these micropollutants, selected due to their persistence, different structures and physico-chemical properties, bioaccumulation potential, and toxicity.
target compounds when assessed individually or as mixtures. Titanium dioxide photocatalysis was able to improve significantly the degradation attained by direct photolysis for the hormones 17-estradiol, 17-ethinylestradiol, and estriol while noteworthy differences were not observed for the other compounds. The main kinetic parameters of the degradation of the target pesticides were determined and applied to predict their degradation under different experimental conditions, allowing further optimisation of the process. The applied model predicted well direct photolysis while overestimating titanium dioxide photocatalysis efficiency.
When the sequential treatment of titanium dioxide followed by nanofiltration was conducted, the catalyst was completely adsorbed on the membrane, limiting further assessment. However, a combined treatment consisting of direct low pressure ultraviolet photolysis followed by nanofiltration was able to efficiently remove the target pesticides and hormones from surface water collected after the sedimentation process, with removal higher than 85.1% throughout a six hour treatment. Remarkable decreases in the endocrine disrupting activity were also attained in the treated water for the mixture of pesticides (64.4-93.8%) and hormones (95.4-99.6%) throughout the treatment. Generally, photolysis by-products generated with higher endocrine disrupting activity than the parent compounds were successfully retained by the membrane. Furthermore, the concentration of the selected micropollutants in the retentate was highly decreased, reducing the need to further treat/dispose the retentate and lowering the respective costs. Fouling was not significantly observed during the treatment. The combined treatment thus demonstrated the potential to tackle the challenges associated with the individual application of the UV and nanofiltration processes.
RESUMO
A água é fundamental para a vida. A presença de micropoluentes, tais como pesticidas e hormonas, em águas superficiais e águas destinada ao consumo humano constitui um problema. Torna-se, por isso, necessário o desenvolvimento de novas tecnologias de tratamento capazes de remover estes compostos da água e assegurar o cumprimento de futuras legislações mais rígidas do que as atuais. A fotólise direta e indireta (usando peróxido de hidrogénio e dióxido de titânio) promovida por radiação ultravioleta de baixa pressão, assim como a nanofiltração, são tecnologias promissoras para a remoção efetiva de micropoluentes orgânicos da água. No entanto, a aplicação destas tecnologias enfrenta alguns desafios: a formação de subprodutos da fotólise, a necessidade de remover as partículas de dióxido de titânio após fotocatálise, a ocorrência de colmatação de membranas durante a nanofiltração e a formação de um retentado de nanofiltração muito concentrado.
Na presente tese, os processos de fotólise direta de baixa pressão, fotocatálise com dióxido de titânio e nanofiltração são avaliados individualmente em termos do seu potencial para remover vários pesticidas (atrazina, isoproturão, diurão, alacloro, pentaclorofenol e clorofenvinfos) e hormonas (17-estradiol, 17-etinilestradiol, estrona, estriol e progesterona) de águas superficiais. Estes pesticidas e hormonas foram selecionados neste estudo devido à sua persistência, diferentes estruturas e propriedades físico-químicas, potencial de bioacumulação e elevada toxicidade. A combinação sequencial de fotólise/fotocatálise com dióxido de titânio e nanofiltração foi depois avaliada em termos da sua capacidade de superar os desafios referidos acima e produzir água com boa qualidade.
individualmente ou sob a forma de misturas foram bastante semelhantes. Apesar da fotocatálise com dióxido de titânio ter melhorado significativamente a degradação das hormonas 17-estradiol, 17-etinilestradiol e estriol, obtida por fotólise direta, não foram observadas diferenças significativas para os restantes compostos. Este estudo permitiu a determinação de parâmetros cinéticos relacionados com a degradação dos pesticidas alvo, que foram posteriormente usados para prever a sua degradação em diferentes condições experimentais, permitindo a otimização do processo. O modelo matemático usado permitiu prever os resultados experimentais obtidos por fotólise direta, embora sobrestime a eficiência da fotocatálise com dióxido de titânio.
tamanho molecular, peso molecular, volume molar e o logaritmo do coeficiente de distribuição octanol-água. A importância destes parâmetros evidencia o impacto de mecanismos de exclusão molecular e interações eletrostáticas, demonstrando que a geometria molecular tem um papel muito importante na rejeição.
O catalisador dióxido de titânio foi completamente adsorvido na membrana quando o processo que integra a fotocatálise, seguido de nanofiltração, foi testado, não sendo possível avaliar a eficiência deste processo. No entanto, o processo que integra a fotólise direta com a nanofiltração demonstrou ser extremamente eficiente para remover os pesticidas e as hormonas alvo de água superficial, recolhida após o processo de sedimentação numa estação de tratamento. As remoções obtidas durante 6 horas de tratamento foram superiores a 85.1%. A atividade de disrupção endócrina da água tratada ao longo do tempo também foi consideravelmente reduzida relativamente à água não tratada, fortificada com uma mistura dos pesticidas (64.4%-93.8%) ou uma mistura das hormonas (95.4-99.6%). Os sub-produtos da fotólise gerados durante o tratamento foram retidos pela membrana. A concentração dos micropoluentes alvo no retentado foi também consideravelmente reduzida, atenuando a necessidade de efetuar um tratamento posterior e reduzindo os respetivos custos. A colmatação da membrana durante o tratamento não foi significativa. Estes resultados demonstram que o tratamento integrado permite ultrapassar as limitações associadas à aplicação individual dos processos de fotólise e nanofiltração.
THESISPUBLICATIONS
Sanches S, Barreto Crespo MT, Pereira VJ (2010) Drinking water treatment of priority
pesticides using low pressure UV photolysis and advanced oxidation processes. Water Res 44(6): 1809-1818.
Sanches S, Penetra A, Rodrigues A, Ferreira E, Cardoso VV, Benoliel MJ, Barreto
Crespo MT, Pereira VJ, Crespo JG (2012) Nanofiltration of hormones and pesticides in different real drinking water sources. Sep Purif Technol 94: 44-53.
Sanches S, Galinha CF, Barreto Crespo MT, Pereira VJ, Crespo JG (2013) Assessment of
phenomena underlying the removal of micropollutants during water treatment by nanofiltration using a multivariate statistical analysis. Sep Purif Technol 118: 377-386.
Sanches S, Penetra A, Rodrigues A, Cardoso VV, Ferreira E, Benoliel MJ, Barreto
Crespo MT, Crespo JG, Pereira VJ (2013) Removal of pesticides from water combining low pressure UV photolysis with nanofiltration. Sep Purif Technol 115: 73-82.
Sanches S, Rodrigues A, Cardoso VV, Ferreira E, Benoliel MJ, Barreto Crespo MT,
LIST OF ABBREVIATIONS
Absorbance
A Adsorption
ACN Acetonitrile
ALA Alachlor
Alk Alkalinity
AOPs Advanced oxidation processes
ATR Atrazine
ByP By-product
Cf Concentration of a given compound in the feed
CFVP Chlorfenvinphos
Cp Concentration of a given compound in the permeate
CPRG Chlorophenol red--D-galactopyranoside
Cr Concentration of a given compound in the retentate
DBPs Disinfection by-products
DC Direct current
DIU Diuron
DOC Dissolved organic carbon
Dyn ads Mass pre-adsorbed under dynamic conditions
EC50 Concentration of a given compound that induces 50% of the
maximum response
EDCs Endocrine disrupting compounds
EEQ Estradiol equivalents
p Incident photon irradiance
EPAL Empresa Portuguesa das Águas Livres
ERE Estrogen response elements
exp Experimental
FL Fluorescence
GC Gas chromatography
GW Groundwater
H2O2 Hydrogen peroxide
hER Human estrogen receptor
HPLC High performance liquid chromatography
h Radiant energy
ind Individual
ISO Isoproturon
k’d Pseudo-first order direct photolysis rate constant
k’f Fluence-based pseudo-first order photolysis rate constant
kO O Pseudo-first-order rate of reaction of hydroxyl radicals with carbonate ions
kO O Pseudo-first-order rate of reaction of hydroxyl radicals with
dissolved organic carbon
kO O Pseudo-first-order rate of reaction of hydroxyl radicals with
hydrogen peroxide
kO O Pseudo-first-order rate of reaction of hydroxyl radicals with bicarbonate ions
kO Second-order rate constant for reaction of hydroxyl radicals with
micropollutants
kO p Pseudo-first-order rate of reaction of hydroxylradicals with para
-chlorobenzoic acid
Ks Specific rate of light absorption by a given compound
k’t Time-based pseudo-first order photolysis rate constant
LGW Laboratory grade water
log D Logarithm of the octanol-water distribution ratio at pH 7.4 log Kow Logarithm of octanol-water partition coefficient
LP Low pressure
Md Molecular depth
MeOH Methanol
MF Microfiltration
mix Mixture
Ml Molecular length
MP Medium pressure
MQ Milli-Q water
MRM Multiple reaction monitoring
MS Mass spectrometry
MW Molecular weight
MWCO Molecular weight cut-off
Mwd Molecular width
m/z Mass to charge ratio
na Not available
nd Not determined
NF Nanofiltration
NOM Natural organic matter
•OH Hydroxyl radicals
[•OH]ss Steady-state concentration of hydroxyl radicals
P Polarisability
PAHs Polycyclic aromatic hydrocarbons
PCP Pentachlorophenol
pKa Inverse of the logarithm of the acid dissociation constant
PLS Projection to latent structures
Qf Feed flow rate
Qp Permeate flow rate
R2 Determination coefficient
Rapp Apparent rejection
RMSECV Root mean square error of cross-validation
RMSEP Root mean square error of prediction
RO Reverse osmosis
S Scavengers
SPE Solid phase extraction
Stat ads Mass pre-adsorbed under static conditions
SW Surface water
t Time
T Temperature
tfilt Time of filtration
TiO2 Titanium dioxide
TOC Total organic carbon
TOTCO3 Total carbonate
UF Ultrafiltration
UPLC Ultra performance liquid chromatography
US EPA United States Environmental Protection Agency
UV Ultraviolet
Vf Volume of feed
Vfilt Filtered volume
Vm Molar volume
Vp Volume of permeate
Vr Volume of retentate
Ws Water solubility
YES Yeast estrogen screen assay
z Distance to the UV source
α1, α2 Distribution coefficients of the carbonate species
Decadic molar absorption coefficient
Quantum yield
Wavelength
em Emission wavelength
ex Excitation wavelength
TABLEOFCONTENTS
Chapter 1 – Introduction: state-of-the-art and motivation ... 1
Chapter 2 – Drinking water treatment of pesticides using low pressure UV photolysis and advanced oxidation processes ... 51
Chapter 3 – Nanofiltration of hormones and pesticides in different real drinking water sources ... 77
Chapter 4 – Assessment of phenomena underlying the removal of micropollutants during water treatment by nanofiltration using multivariate statistical analysis ... 117
Chapter 5 – Removal of pesticides and hormones from water combining low presure UV photolysis with nanofiltration ... 149
Chapter 6 – Discussion and future work ... 189
LIST OF TABLES
Table 1.1 Characterisation of the pesticides atrazine, isoproturon, diuron, alachlor, pentachlorophenol, and chlorfenvinphos in terms of their physico-chemical properties, occurrence levels in groundwater and surface water, and toxicity effects. The colours of the atoms in the molecular structures of the pesticides have the following meaning: grey – carbon; white – hydrogen; green – chloride; red – oxygen; blue – nitrogen; orange – phosphorus...5-6
Table 1.2 Characterisation of the hormones 17-estradiol, 17-ethinylestradiol, estrone, estriol, and progesterone in terms of their physico-chemical properties, occurrence levels in groundwater and surface water, and toxicity effects. The colours of the atoms in the molecular structures of the hormones have the following meaning: grey – carbon; white – hydrogen; red – oxygen...10-11
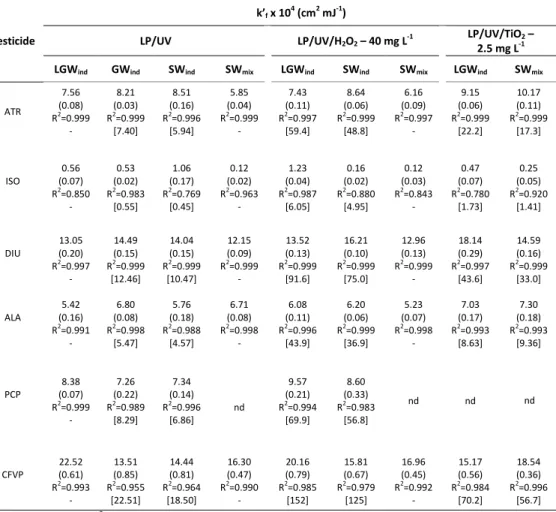
Table 2.1 Fluence-based direct photolysis (LP/UV) and AOPs (LP/UV/H2O2 and
LP/UV/TiO2) rate constants (k’f) obtained for atrazine (ATR), isoproturon (ISO), diuron
(DIU), alachlor (ALA), pentachlorophenol (PCP), and chlorfenvinphos (CFVP) in different water matrices: laboratory grade water (LGW), surface water (SW) and groundwater (GW) as individual compounds (ind) and mixtures (mix); standard errors are given in parenthesis and modelled results are given in square brackets...64
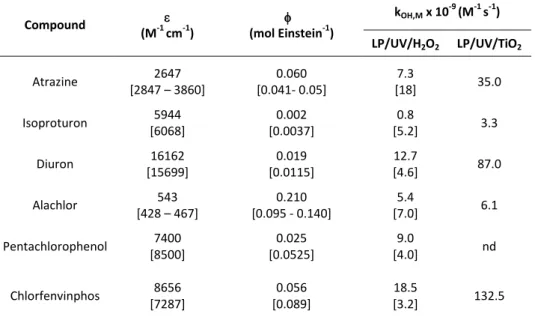
Table 2.2 Decadic molar absorption coefficient (quantum yield ( and second-order rate constants for reaction of the micropollutants with OH radicals (kOH,M) for
the selected pesticides; literature values are given in square brackets (Acero et al. 2008, Song et al. 2008, Wong and Chu 2003b, Benitez et al. 2003, Benitez et al. 2006, De Laat et al. 1999, Beltran et al. 1993, Haag and Yao 1992)...65
Table 3.1 Structure and physico-chemical properties of the selected pesticides and hormones...95
Table 3.2 Characterisation of groundwater and surface water after ultrafiltration...96
Table 3.4 Percent adsorption of the selected pesticides and hormones on the membrane during nanofiltration under different experimental conditions in terms of membrane saturation: without pre-adsorption of the compounds on the membrane, with static pre- adsorption on the membrane, as well as with both static and dynamic pre-adsorption on the membrane...105
Table 3.5 Variation of the composition of the spiked groundwater (GW) and surface water (SW) subject to nanofiltration...108
Table 4.1 Description of the selected inputs for model developing………125
Table 4.2 Physico-chemical properties and molecular size parameters of the selected
pesticides and hormones………..126
Table 5.1 Time-based pseudo-first order direct and OP rate constants (k’t) obtained for the selected pesticides and hormones in surface water collected after the sedimentation process and the respective determination coefficients (R2)...165
Table 5.2 Removal of the selected pesticides and hormones during the integrated treatment without fresh feed solution addition...173
Table 5.3 Summary results obtained by mass spectra analysis of the major by-products detected - parent compound, major daughter ions, their relative abundance, and proposed fragments...181
Table A.1 HPLC methods used for the detection of the pesticides atrazine (ATR), isoproturon (ISO), diuron (DIU), alachlor (ALA), pentachlorophenol (PCP), and chlorfenvinphos (CFVP) as well as para-chlorobenzoic acid (pCBA) in the direct photolysis and AOPs experiments...205
Table A.2 HPLC methods used for the detection of pesticides and hormones in the direct HPLC analysis of samples from pre-adsorption experiments preceding nanofiltration assays...206
Table A.3 HPLC methods used for the detection of the selected pesticides and hormones in the direct HPLC analysis of samples from the LP/UV photolysis experiments as well as feed, retentate, and control samples from nanofiltration and combined treatment experiments...207
Table A.5 Optimised mass spectrometry conditions used for the detection of the target hormones...211
Table A.6 Characterisation of the source waters used in the UV photolysis experiments described in Chapter 2...212
Table A.7 Time-based direct (LP/UV) and indirect (LP/UV/H2O2 and LP/UV/TiO2)
photolysis rate constants (k’t) obtained for the selected pesticides in different water
matrices: Laboratory grade water (LGW), surface water (SW), and groundwater (GW) as individual compounds (ind) and mixtures (mix); standard errors are given in parenthesis...213
LIST OF FIGURES
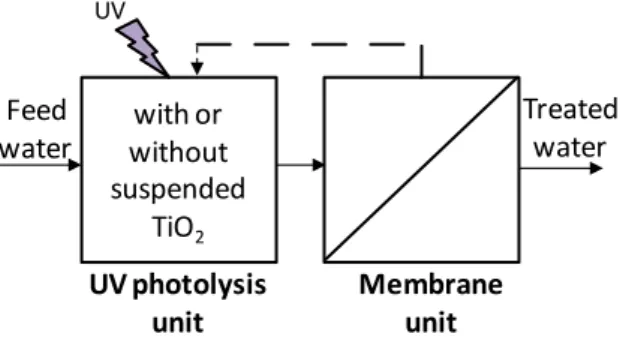
Figure 1.1 Proposed configuration integrating UV direct photolysis or TiO2 UV
photocatalysis and nanofiltration...35
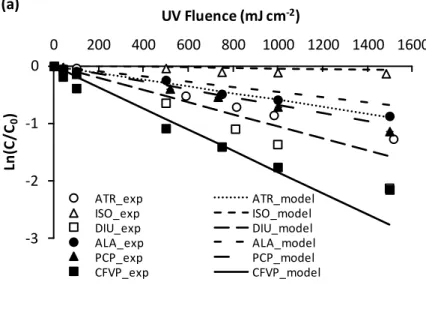
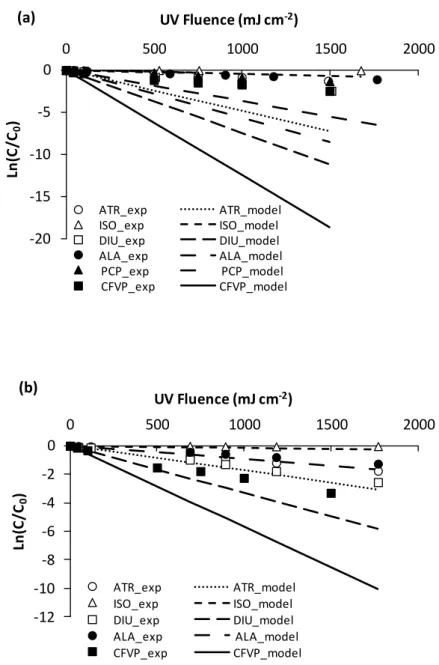
Figure 2.1 Experimental (exp) and model low pressure direct photolysis of atrazine (ATR), isoproturon (ISO), diuron (DIU), alachlor (ALA), pentachlorophenol (PCP), and chlorfenvinphos (CFVP) in (a) surface water and (b) groundwater; experimental values are represented by symbols with error bars whereas the lines show the model results...63
Figure 2.2 Experimental (exp) and model low pressure photolysis of atrazine (ATR), isoproturon (ISO), diuron (DIU), alachlor (ALA), pentachlorophenol (PCP), and chlorfenvinphos (CFVP) in surface water using (a) 40 mg L-1 hydrogen peroxide (H2O2)
and (b) 2.5 mg L-1 titanium dioxide (TiO2); experimental values are represented by
symbols with error bars whereas the lines show the model results...67
Figure 2.3 Modelled time-based direct photolysis rate constants (k’d)...69
Figure 2.4 Modelled time-based direct photolysis (k’d) and OPs (k’i) rate constants obtained for isoproturon...70
Figure 2.5 LP/UV, LP/UV/H2O2, and LP/UV/TiO2 percent degradation of atrazine (ATR),
isoproturon (ISO), diuron (DIU), alachlor (ALA), chlorfenvinphos (CFVP), and pentachlorophenol (PCP) spiked in surface water as individual compounds and mixtures (Mix) using a UV fluence of 1500 mJ cm-2...71
Figure 2.6 Alachlor by-product detected by HPLC...72
Figure 3.1 Schematic representation of experimental procedure (---- experiments that were only conducted with the selected hormones)...85
Figure 3.2 Schematic representation of the experimental setup………88
Figure 3.4 Rejection of the selected hormones (17-estradiol, 17-ethinylestradiol, estrone, estriol, and progesterone) in the different nanofiltration experiments –
without previous adsorption of the selected organic compounds on the membrane, with pre-adsorption under static conditions, and with pre-adsorption under both static and dynamic conditions – in groundwater (GW) and surface water (SW) matrices (error bars correspond to the uncertainty related to analytical methods)...102
Figure 3.5 Percent rejection of inorganic components of the natural water matrices during nanofiltration experiments (error bars correspond to minimum and maximum values obtained; error bars are not provided when the rejection of the components leaded to concentrations below detection limits)...109
Figure 4.1 Molecular structures of the selected pesticides and hormones encompassed in a box used for the determination of measurements that reflect size parameters (grey – carbon; white – hydrogen; green – chloride; red – oxygen; blue –
nitrogen) obtained from Jmol software……….127
Figure 4.2 Univariated correlations between rejection and (a) molecular weight, (b) dipole moment, and (c) molar volume as well as (d) between adsorption and log D. Experimental data present in the plots were obtained for nanofiltration of groundwater spiked with the selected micropollutants carried out without
pre-adsorption………131
Figure 4.3 Optimised multilinear models developed by PLS to predict apparent rejection and the respective normalised regression coefficients related to the relevant inputs: model 1 (a and b) was obtained using all observed data without including molecular size parameters; model 2 (c and d) was obtained using all observed data and molecular size parameters; model 3 (e and f) was obtained by excluding observations associated with pentachlorophenol without using molecular size parameters. RMSEP, RMSECV, R2 values, and slopes of training and validation sets are provided for each model. Alk – alkalinity; MW – molecular weight; – dipole moment; Vm – molar volume; P – polarisability; Vfilt – filtered volume; log D –
logarithm of the octanol-water distribution ratio at pH 7.4; C – concentration; Ml –
molecular length; Mwd– molecular width; Md– molecular depth; pKa– inverse of the
logarithm of the acid dissociation constant; Dyn ads – mass of micropollutants
Figure 4.4 Optimised models developed by PLS to predict adsorption and the respective normalised regression coefficients related to the relevant inputs: model 4 (a and b) was obtained without using molecular size parameters; model 5 (c and d) was obtained by incorporating quadratic and interaction terms of the input parameters without using molecular size parameters; model 6 (e and f) was obtained by incorporating quadratic and interaction terms of the input parameters and using molecular size parameters. RMSEP, RMSECV, R2 values, and slopes of training and
validation sets are provided for each model. Vfilt – filtered volume; Stat ads – mass of
micropollutants pre-adsorbed under static conditions; P – polarisability; Alk –
alkalinity; Vm– molar volume; Dyn ads – mass of micropollutants pre-adsorbed under
dynamic conditions; – dipole moment; pKa – inverse of the logarithm of the acid
dissociation constant; filtration time (tfilt)...140-141
Figure 5.1 Schematic representation of the experimental setup...157
Figure 5.2 Degradation of the selected (a) pesticides and (b) hormones by LP/UV direct photolysis over a 6-7 h experimental period (duplicate injections are provided as error bars; degradations higher than limits of detection are not represented). Horizontal lines in (a) represent % degradations that correspond to the lowest and highest limits of detection of the target pesticides (5-50 g L-1); the horizontal line in
(b) correspond to the detection limit for the hormones estrone and progesterone (25 g L-1
)...167
Figure 5.3 Degradation of the selected (a) pesticides and (b) hormones by TiO2
photocatalysis over a 3-4 h experimental period (50 mgL-1 TiO2; duplicate injections
are provided as error bars; degradations higher than limits of detection are not represented). Horizontal lines in (a) represent % degradations that correspond to the lowest and highest limits of detection of the target pesticides (5-50 g L-1); horizontal
lines in (b) correspond to the lowest and highest limits of detection of the target hormones (5-100 g L-1)...168
Figure 5.5 Removal of the selected pesticides from the retentate (a) and variation of the respective Estradiol Equivalents in the permeate and retentate (b); removal of the selected hormones from the retentate (c) and variation of the respective Estradiol Equivalents in the permeate and at the inlet of the membrane module (d) throughout the integrated treatment conducted without fresh feed solution addition in the absence of TiO2 over a 6h experimental period (duplicate experiments are provided as
error bars; degradations higher than limits of detection are not represented). Horizontal lines in (a) represent % degradations that correspond to the lowest and highest limits of detection of the target pesticides (5-50 g L-1); horizontal lines in (c)
represent the % degradations that correspond to the lowest and highest detection limits of the hormones not detected after 1 h of operation (25-100 g L-1)... 175
Figure 5.6 Removal of the selected pesticides from the retentate (a) and variation of the respective Estradiol Equivalents in the permeate and retentate (b); removal of the selected hormones from the retentate (c) and variation of the respective Estradiol Equivalents in the permeate and at the inlet of the membrane module (d) throughout the integrated treatment conducted with the addition of fresh feed solution in the absence of TiO2 over a 6 h experimental period (duplicate experiments are provided
as error bars)...178
Figure 6.1 Scanning electron microscopy images of the top view (Figures (a) and (b)) and cross section (Figures (c) and (d)) of the TiO2 thin films obtained on the surface of
a commercial ceramic membrane by pulsed DC reactive magnetron sputtering. The following sputtering conditions were applied to obtain the film depicted in Figures (a) and (c): distance to the target – 9 cm, immobilisation time – 8 h, current intensity –
0.7 A, pressure – 1.2x10⁻² mbar and argon:oxygen ratio – 2:1. To obtain the film
depicted in Figures (b) and (d), the following conditions were applied: distance to the target – 15 cm, immobilisation time – 11.5 h, current intensity – 1 A, pressure – 1.2x10⁻² mbar and argon:oxygen ratio – 2:1...198 Figure A.1 Mass spectra of major by-products detected...220-223
C
HAPTER
1
CONTENTS
1.1 Water availability and quality ... 3
1.2 Emerging micropollutants in water ... 3
1.2.1 Pesticides ... 4
1.2.2 Endocrine disrupting compounds ... 8
1.3 Drinking water treatment: aim and challenges ... 12
1.4 UV based processes ... 14
1.4.1 UV direct photolysis ... 14
1.4.2 Advanced oxidation processes ... 15
1.4.2.1 UV combined with hydrogen peroxide ... 16
1.4.2.2 Titanium dioxide heterogeneous photocatalysis ... 17
1.4.3 Impact of water composition upon UV photolysis ... 20
1.4.4 Current use and challenges ... 21
1.5 Pressure-driven membrane processes ... 24
1.5.1 Nanofiltration ... 25
1.5.1.1 Membrane types and module configurations ... 26
1.5.1.2 Selection of Desal 5DK membrane ... 27
1.5.2 Membrane, solute and water-matrix interactions ... 27
1.5.3 Current use and challenges ... 30
1.6 Integration of UV photolysis and nanofiltration: overview of recent
developments ... 32
1.7 Objectives and thesis outline ... 35
This chapter comprises the state-of-the-art related with the water treatment
technologies addressed in the present thesis - ultraviolet (UV) direct photolysis,
advanced oxidation processes (AOPs), and nanofiltration (NF) - as well as the
motivation for the approach followed and the main objectives of this Thesis.
1.1 WATER AVAILABILITY AND QUALITY
Water covers 70 percent of the earth’s surface. Nevertheless, only approximately 2.5 percent is freshwater, and because most of that water is locked up in ice and glaciers,
only 0.3 percent of the total freshwater is easily accessible in rivers and lakes, which
are the most common sources of drinking water (Oki and Kanae 2006, Shiklomanov
1993).
Moreover, the exponential growth of population has led to an increasing demand of
potable water. Since water is a fundamental resource for life, water availability and
quality (chemical and microbial) are among the main environmental challenges of the
21st century.
1.2 EMERGING MICROPOLLUTANTS IN WATER
The disposal of several chemicals that are used in several industries, agriculture,
medicine, and other activities have raised increasing concern regarding their potential
adverse effects for human health and environment in the last decades. Many organic
compounds such as pesticides, pharmaceutical and personal care products, endocrine
disrupting compounds (EDCs), polychlorinated biphenyls, phthalates, alkylphenols,
over the world at ng L-1 to low g L-1 levels (Cabeza
et al. 2012, Zheng et al. 2012,
Velicu and Suri 2009, Rao et al. 2013).
Based on their relevance in terms of occurrence levels, hazardous potential as well as
the need to comply with current and potentially more stringent future regulations,
some pesticides and endocrine disrupting compounds with different chemical
structures, properties, and behaviour were selected to be addressed in the studies
carried out in the scope of the present thesis.
1.2.1 Pesticides
The widespread and extensive use of pesticides in agriculture and wood preservation
to control weeds, insects, and plant diseases has led to their presence in several
water sources, mainly through runoffs, spray drift, and drainage (Knauert et al. 2008).
A group of pesticides with different structures and properties was targeted in the
studies described in this thesis that included: atrazine (ATR), isoproturon (ISO), diuron
(DIU), alachlor (ALA), pentachlorophenol (PCP), and chlorfenvinphos (CFVP). Table 1.1
depicts their structures, occurrence concentrations in surface water (SW) and
groundwater (GW), toxicity effects, and specific physico-chemical properties such as
molecular weight (MW), water solubility (Ws), logarithm of octanol-water partition
coefficient (log Kow), inverse of the logarithm of the acid dissociation constant (pKa),
Table 1.1 Characterisation of the pesticides atrazine, isoproturon, diuron, alachlor, pentachlorophenol, and chlorfenvinphos in terms of their physico-chemical properties, occurrence levels in groundwater and surface water, and toxicity effects. The colours of the atoms in the molecular structures of the pesticides have the following meaning: grey – carbon; white – hydrogen; green – chloride; red – oxygen; blue – nitrogen; orange – phosphorus.
Compound*
[CAS number] Description
Molecular formula
MW (Da)
Ws at 25 °C (mg L-1)
log Kow pKa
Vm (cm3mol-1)
Occurrence levels (ng L-1)
Toxicity effects
Atrazine [1912-24-9]
Herbicide C8H14ClN5 215.7 34.7[1] 2.56[2] 1.70[3] 169.9[4] 2[5] – 5200[6]
Decrease of pituitary hormone levels, ovarian and liver histopathology, effects on nervous immune, and cardiovascular systems[7]. Non-Hodgkin’s lymphoma, preterm delivery, and intrauterine growth retardation[8,9]. Demasculinisation of
male gonads (reduced germ cell numbers in teleost fish, amphibians,
reptiles, and mammals), partial and/or complete feminisation of fish,
amphibians, and reptiles[10]. Changes in the testosterone metabolism[11].
Isoproturon [34123-59-6]
Herbicide C12H18N2O 206.3 14[1] 2.87[12] na 196.3 [4] 7[13]– 1959[14]
Hepatocellular tumours, preneoplastic, and neoplastic
lesions[15].
Diuron [330-54-1]
Herbicide C9H10Cl2N2O 233.1 42[1] 2.68[12] na 170.2[4] 0.27[5] – 864[14]
Hemolytic anaemia and compensatory hematopoiesis.
Table 1.1 Characterisation of the pesticides atrazine, isoproturon, diuron, alachlor, pentachlorophenol, and chlorfenvinphos in terms of their physico-chemical properties, occurrence levels in groundwater and surface water, and toxicity effects. The colours of the atoms in the molecular structures of the pesticides have the following meaning: grey – carbon; white – hydrogen; green – chloride; red – oxygen; blue – nitrogen; orange – phosphorus (continuation).
Compound*
[CAS number] Description
Molecular formula
MW (Da)
Ws at 25 °C (mg L-1)
log Kow pKa
Vm (cm3mol-1)
Occurrence levels (ng L-1)
Toxicity effects
Alachlor [15972-60-8]
Herbicide C14H20ClNO2 269.8 240[1] 3.52[17] 0.62[18] 240.9[4] 27[19] – 9950[20]
Lymphomatopoietic cancers, leukaemia, multiple myeloma[21], and thyroid[22]. Anaemia, increased
risk of cancer, and problems in the eye, liver, kidney and spleen[23].
Pentachlorophenol [87-86-5]
Herbicide Insecticide
Fungicide C6HCl5O 266.3 14.0
[1] 5.12[24] 4.70[25] 147.6[4] 20 – 21620[26]
Trachea, bronchus and lung cancers, non-Hodgkin lymphoma,
chronic obstructive pulmonary disease, leukaemia[27], and
thyroid[28].
Chlorfenvinphos [470-90-6]
Insecticide C12H14Cl3O4P 359.6 124[1] 3.81[12] na 261.8[4] 2.48[29]– 145[5]
Changes in the central and peripheral nervous system[30]. Lipid
peroxidation, hemolysis, and erythrocyte malformation[31].
The high water solubility of these compounds and their relatively low log Kow values
(exception of pentachlorophenol) suggest that these compounds are expected to
partition to some extent into the aquatic environment. In fact, these micropollutants
have been found in the surface water and groundwater all over the world at
concentrations up to 21.62 g L-1 (Zheng et al. 2012) (Table 1.1). Based on the toxicity
data available, these levels are able to cause severe diseases. Several pathologies
have been related with the exposure of humans and animals, namely aquatic
organisms, to the aforementioned pesticides: disruption of the endocrine system (e.g.
Hayes et al. 2011), several types of cancer (e.g. Ruder and Yin 2011), as well as liver
pathologies and modifications in the nervous, immune, and cardiovascular system
(e.g. Vidyasagar et al. 2004, ATSDR 2003) (Table 1.1). Due to their occurrence levels,
toxicity, persistence, and bioaccumulation potential, these pesticides were considered
priority by the European Water Framework Directive (Decision 2455/2001/EC). This
classification constituted an alert for the need to reduce and monitor their presence
in drinking water sources and was withdrawn by the amending Directive
2013/39/EU, probably because of their banning or introduction of application
restrictions. Even though atrazine, alachlor, and chlorfenvinphos were banned in the
European Union before 2007 (Decisions 2004/248/EC and 2006/966/EC, Regulation
2076/2002) and pentachlorophenol and diuron face severe restrictions in terms of
application for plant protection (Decisions 2004/248/EC, 2006/966/EC, Regulation
2076/2002), they were still detected in European countries such as Spain and Greece
in 2010-2012 at levels up to 10 g L-1 (Postigo et al. 2010, Vryzas et al. 2012, Cabeza et
al. 2012).
Furthermore, these compounds are still extensively produced and applied in other
countries. As an example, atrazine remains one of the most widely used herbicides in
United States Environmental Protection Agency (US EPA) and regulatory actions were
introduced in 1984 to restrict certain non wood-preservation applications (US EPA
2008), its production is still noteworthy in USA (Van der Zande 2010). Maximum
contaminant levels in drinking water are established in the US National Primary
Drinking Water Regulations for atrazine, alachlor, and pentachlorophenol (3, 2, and 1 g L-1, respectively). Generally less restrictive guideline values are implemented in
Australia (NHMRC and NRMMC 2011) and Canada (Health Canada 2012) although a
similar maximum acceptable concentration is set for atrazine in Canada (5 g L-1).
There is often a gap between legislation and research since banned micropollutants
are still present in drinking water sources and despite their proven hazardous effects
they are not legislated yet in countries where their occurrences have been reported
as maximum.
1.2.2 Endocrine disrupting compounds
Endocrine disrupting compounds are natural or synthetic compounds with the ability
to interfere with hormone biosynthesis, metabolism, secretion, binding action, and
transport, resulting in a deviation from normal homeostatic control or reproduction,
even at very low exposure levels. Endocrine disruptors include plant products such as
phytoestrogens, pesticides, plasticisers, phenols, and hormones (Diamanti-Kandarakis
et al. 2009).
Hormones constitute the most important group of EDCs due to their extremely high
estrogenic activity. A woman is able to excrete daily approximately 64 g of estriol as
well as 3-20 g and 0.5-5 g of estrone and 17-estradiol, respectively, as revised by
ingredient compounds of oral contraceptive pills. Since they are not fully assimilated
by humans, hormones are continuously released to the environment mostly via
domestic wastewater effluents either in the original form or partially metabolised.
Conventional wastewater treatment processes are often not completely effective to
remove these anthropogenic compounds from the effluent. Thus, non eliminated
compounds are directly released into the environment (Kolpin et al. 2002, Hecker and
Hollert 2011). Hormones such as 17-estradiol, 17-ethinylestradiol, estrone, estriol,
and progesterone became ubiquitous in the environment and are the major
contributors of the estrogenic activity observed in water sources (Birkett 2003).
Based on their water solubility and hydrophilicity, these hormones are also expected
to partition to some degree in the aquatic environment (Table 1.2). These hormones
present very different structures and physico-chemical properties comparatively with
the aforementioned pesticides and are therefore expected to behave differently
during drinking water treatment.
These hormones have been reported to occur in surface waters and groundwaters in
USA (Velicu and Suri 2009), Europe (Aydin and Talinli 2013, Jardim et al. 2012), and
particularly China (Rao et al. 2013, Zhou et al. 2011), at concentrations up to 180 ng
L-1 (Table 1.2). Despite the lower occurrence levels of these hormones comparatively
with the pesticides aforementioned, hormones are able to induce severe
endocrinologic disorders such as male feminisation (Table 1.2). Purdom et al. (1994)
reported the production of vitellogenin (the precursor of egg yolk proteins expressed
in females for embryos development) by male trout due to exposure to 17
-ethinylestradiol at doses as low as 0.1 ng L-1 during 10 days. Furthermore, a 7-year
research in a canadian lake demonstrated that chronic exposure of fathead minnow
(Pimephales promelas) to 5-6 ng L-1 of 17-ethinylestradiol led to feminisation of
Table 1.2 Characterisation of the hormones 17-estradiol, 17-ethinylestradiol, estrone, estriol, and progesterone in terms of their physico-chemical properties, occurrence levels in groundwater and surface water, and toxicity effects. The colours of the atoms in the molecular structures of the hormones have the following meaning: grey – carbon; white – hydrogen; red – oxygen.
Compound*
[CAS number] Description
Molecular formula
MW (Da)
Ws at 25 °C (mg L-1)
log Kow pKa
Vm (cm3 mol-1)
Occurrence levels (ng L-1)
Toxicity effects
17-Estradiol [50-28-2]
Natural steroid hormone
C18H24O2 272.4 3.6[1] 4.01[2] 10.4[2] 232.6[3] 0.09[4] – 134[5]
Feminisation of male species (vitellogenin production by male
fish and chorionic proteins production within male or juvenile animals, impact on
gonadal development, reductions in sperm count and motility). Altered oogenesis in females and early-stage eggs,
ovarian and testicular hispathology[6-10]. Mammary
tumors[11].
17-Ethinylestradiol [57-63-6]
Synthetic oral
contraceptive C20H24O2 296.4 11.3
[1] 3.67[2] 10.4[2] 244.5[3] 1.55[12]– 127.9[13]
Feminisation of male species (see details in the first line of the
table).
Near extinction of Pimephales promelas in canadian lakes[14].
Estrone [53-16-7]
Natural steroid hormone
C18H22O2 270.4 30.0[1] 3.13[2] 10.4[2] 232.1[3] 0.60[12] – 180[5]
Feminisation of male species (see details in the first line of the
table).
Table 1.2 Characterisation of the hormones 17-estradiol, 17-ethinylestradiol, estrone, estriol, and progesterone in terms of their physico-chemical properties, occurrence levels in groundwater and surface water, and toxicity effects. The colours of the atoms in the molecular structures of the hormones have the following meaning: white – hydrogen; grey – carbon; red – oxygen (continuation).
*molecular structures depicted were obtained from the Jmol software; **no dissociation; MW – molecular weight; Ws – water solubility; log Kow – logarithm of octanol-water partition coefficient; pKa –inverse of the logarithm of the acid dissociation constant; Vm – molar volume; [1] Meylan and Howard 1994 [2] Snyder et al. 2007 [3] Chemspider
[4] Velicu and Suri 2009 [5] Zhou et al. 2011 [6] Harries et al. 1997 [7] Jobling et al. 1998 [8] Desbrow et al. 1998 [9] Vajda et al. 2008 [10] Vajda et al. 2011 [11] Turan et al. 2004 [12] Rao et al. 2013 [13] Sun et al. 2009 [14] Kidd et al. 2007 [15] Saito et al. 2012 [16] Chang et al. 2008 [17] Nickenig et al. 2000.
Compound*
[CAS number] Description
Molecular formula
MW (Da)
Ws at 25 °C (mg-1 L)
log Kow pKa
Vm (cm3 mol-1)
Occurrence levels (ng L-1)
Toxicity effects
Estriol [50-27-1]
Natural steroid hormone
C18H24O3 288.4 441[1] 2.45[2] 10.4[2] 229.6[3] 0.33[4] – 94[5] Feminisation of male species[10].
Progesterone [57-83-0]
Natural steroid hormone
C21H30O2 314.5 8.8[1] 3.87[2] ** 288.9[3] 0.07[16] - 11.81[4]
Incidence of postmenopausal
Recently, a directive amending Directives 2000/60/EC and 2008/105/EC has been
submitted that recommends the inclusion of 17-estradiol and 17-ethinylestradiol in
the list of priority substances (European Commission 2012). 17-estradiol, 17
-ethinylestradiol, estrone, and estriol are included in the US EPA Contaminant
Candidate List 3, which comprises compounds that are suspected to require
regulation under the Safe Drinking Water Act (US EPA 2009b).
1.3 DRINKING WATER TREATMENT: AIM AND CHALLENGES
The main goal of drinking water suppliers is to provide water with high microbial and
chemical quality. Conventional surface water treatment often includes coagulation,
flocculation, sedimentation, filtration, and final disinfection (chlorination or
chloramination). Disinfection is sometimes sufficient to obtain drinking water from
groundwater. Although chloramination is also applied, chlorine is the disinfectant
most widely used. Disinfection by-products (DBPs), that are produced during
chlorination, have been detected in several distribution systems (e.g. Wlodyka-Bergier
and Bergier 2011, Jeong et al. 2012) and have been related to different types of
cancer (Costet et al. 2011, Rahman et al. 2010) and adverse reproductive outcomes
(Grellier et al. 2010).
As revised by Brunkard et al. (2011), several outbreaks related with the presence of
bacteria (e.g. Legionella, Salmonella, Campylobacter), viruses (norovirus, hepatitis A
virus), and protozoa (Giardia intestinalis, Cryptosporidium) have been registered due
to failures of sand filtration units, sedimentation contact units and chlorination during
drinkng water treatment. In 1993, a serious outbreak was caused by Cryptosporidium
oocysts that passed through the sand filtration system and were not properly
USA. Up to 400,000 cases of serious illness and 100 deaths were registered (Gerba
2000a).
Several pesticides and hormones, namely atrazine (McInnis 2010, Rodriguez-Mozaz et
al. 2004), pentachlorophenol (McInnis 2010), and estriol (Kuster et al. 2008) have also
been detected in treated water from drinking water utilities applying conventional
treatment processes. The monitoring of the presence of several compounds in
Canadian municipal treated drinking water from 1986 to 2006 revealed the presence
of several contaminants; atrazine was the most frequently detected pesticide in
treated surface water, largely exceeding the legal limits (McInnis 2010).
The development of alternative technologies that enable the efficient removal of both
microorganisms and chemicals is therefore required. Moreover, such technologies
should allow water utilities to comply with current and future more stringent
regulations.
The need to comply with more stringent US regulations regarding drinking water
quality led to a shift towards the implementation of UV disinfection, as alternative or
in combination with chlorine, due to its proven higher inactivation potential towards
bacteria and protozoa relatively to chlorination (Shin et al. 2009, Le Goff et al. 2010).
Another advantage of using UV radiation is the decrease of the chlorine doses needed
to achieve final disinfection and the consequent reduction in the production of DBPs.
Moreover, many organic compounds may be photochemically degraded by UV direct
photolysis and advanced oxidation processes (e.g. Wu and Linden 2008, Shemer and
Linden 2007a, Pereira et al. 2007a, Marotta et al. 2013, De la Cruz et al. 2013). UV
radiation may, thus, be suitable to considerably improve both microbial and chemical
quality of drinking water.
filtration, that will act as an effective barrier to organic compounds (e.g.
Yangali-Quintanilla et al. 2009, Verliefde et al. 2009, Salvaterra et al. 2011) and natural
organic matter (NOM) (Salvaterra et al. 2011) as well by constituting an extra barrier
for bacteria and viruses (Patterson et al. 2012).
1.4 UV BASED PROCESSES
1.4.1 UV direct photolysis
UV direct photolysis is a process that leads to the degradation of organic compounds
through the application of radiation at the ultraviolet range (200-400 nm). Molecules
in its ground state can absorb a quantum of light energy or photon and transit to a
higher-energy state. Such molecules are therefore much more reactive and can
undergo different reactions than more stable molecules, following different reaction
pathways (Kopecký 1992). These reactions lead to the degradation of molecules that
ultimately result in their mineralisation, with the formation of carbon dioxide, water,
and inorganic ions.
A wide range of UV lamps may be applied to degrade organic compounds.
Nevertheless, a lamp that may simultaneously achieve good microbial inactivation
and micropollutants degradation is ideal. Low pressure (LP) and medium pressure
(MP) UV mercury lamps are conventional UV sources applied for water disinfection
due to their germicidal effect. MP lamps emit radiation at 200 – 500 nm while LP
lamps emit predominantly radiation at 254 nm. Although the use of both LP and MP
lamps is already well implemented in some drinking water utilities for disinfection,
by-product formation and energy demand as well as operating costs are typically lower
for LP lamps (IJpelaar et al. 2007). Even though UV fluences typically applied for
degradation of micropollutants higher UV fluences need to be used. Despite its high
efficiency for disinfection the use of UV radiation for the degradation of organic
compounds should be further tested and optimised.
LP lamps have demonstrated effectiveness towards several micropollutants such as
the pharmaceuticals clofibric acid, iohexol (Pereira et al. 2007b), phenazone, and
phenytoin (Yuan et al. 2009) or the PAHs anthracene and benzo(a)pyrene (Sanches et
al. 2011a). Nevertheless, several compounds do not have the capacity to absorb
photons at 254 nm. As an example, only 6% of dibenzothiophene and dibenzofuran as
well as 15% of fluorine spiked in phosphate buffer solutions were removed by a LP
lamp at a UV fluence of 1000 mJ cm-2 (Shemer and Linden 2007b). Photolysis of
carbamazepine by a LP lamp above 5% was also not observed in another study, even
when a UV fluence of 1700 mJ cm-2 was applied (Pereira et al. 2007b).
1.4.2 Advanced oxidation processes
Advanced oxidation processes combine UV radiation with oxidants or
semi-conductors (heterogeneous photocatalysis) and rely on the formation of highly
reactive, unselective, and short-lived hydroxyl radicals (•OH) (Schwarzenbach et al.
1993). These radicals initiate sequential reactions that result in partial or total
degradation of organic micropollutants. For some compounds, chemical oxidation
processes involved in AOPs have been reported to enhance degradation rates
obtained by direct photolysis (Pereira et al. 2007b, Pereira et al. 2012, Rosenfeldt et
al. 2007) and/or improve their mineralisation levels (De la Cruz et al. 2013).
Hydrogen peroxide (H2O2) and ozone have become the most popular oxidants while
1.4.2.1 UV combined with hydrogen peroxide
During UV/H2O2 oxidation, degradation of micropollutants takes place through the
reaction of organic micropollutants with hydroxyl radicals that are generated by the
reaction between H2O2 and UV photons with certain radiant energy (h). This
mechanism is described in general by the following equations:
H2O2hν2 OH
OHmicropollutantbyproducts
At very high concentrations, hydrogen peroxide also acts as an hydroxyl radical
scavenger producing a much less reactive hydroperoxyl radical, •HO2,leading to the
production of water (H2O) and oxygen (O2) as illustrated by Equations 1.3 and 1.4 (Wu
and Linden 2008).
O OH HO2 H2O
H2 2
HO2 OHH2OO2
LP/UV/H2O2 has been described for the degradation of several micropollutants.
Removals of 90% were attained for estriol, octilphenol, and progesterone in a surface
water employing a UV fluence of 1500 mJ cm-2 and 100 mg L-1 of H
2O2 while less than
20% removal was achieved by direct photolysis for estriol and octilphenol (Pereira et
al. 2012). In other studies, the degradation of the pesticides parathion (Wu and
Linden 2008) and metaldehyde (Autin et al. 2012) in synthetic waters by this AOP was
also noteworthy using LP and MP lamps. Hindered effects, attributed to the presence
of H2O2, were, however, observed during the degradation of fluorene, dibenzofuran,
and dibenzothiophene in a natural water (Shemer and Linden 2007a).
(1.1)
(1.2)
(1.3)
1.4.2.2 Titanium dioxide heterogeneous photocatalysis
Heterogeneous photocatalysis is a photoreaction process that is accelerated by the
presence of a solid semi-conductor. Among the semiconductors applied, TiO2 is the
reference material in promoting a good level of disinfection, even towards
Cryptosporidium (Sunnotel et al. 2010), as well as an efficient degradation and
mineralisation of a multitude of organic compounds (e.g. Maldonado et al. 2007,
Wang et al. 2009, Sousa et al. 2013).
The primary step in the photocatalytic process involves the generation of conduction
band electrons (e-) and valence band holes (h+) through the irradiation/ activation of
TiO2 with energy greater than its band gap energy. The incidence of radiation induces
the ejection of an electron of the valence band to the conduction band, producing a
positively charged hole in the catalyst and generating an electron-hole pair:
TiO2hνeh
Electron and hole pairs can recombine in the bulk catalyst or diffuse to the catalyst
surface and react with adsorbed species, undergoing reductive and oxidative
reactions. In the presence of water, hydroxyl radical formation occurs on the
semiconductor surface due to the hole trapping by interfacial electron transfer.
Photogenerated holes can oxidise organic compounds directly, while the electrons
formed can react with the adsorbed molecular oxygen on the Ti(III)-surface, reducing
it to superoxide radical anion, [O2] (Balasubramanian et al. 2004, Konstantinou et
al. 2002). These reactions occur as follows:
e
[O
]
O
2 2
OH
HO
O
H
]
[O
2 2 2
e
[HO
]
HO
2 2
OH
O
H
O
H
]
[OH
2 2 2 2
OH
h
OH
Since OH radicals are generated on the semiconductor surface, photocatalysis is a
surface-dependent process. Oxidation may also occur via other oxygen-containing
radicals formed in reactions between the positive holes and hydroxyl groups or water
adsorbed at the catalyst surface. Hydroxyl radical attack and hole oxidation have been
shown to be the primary oxidants responsible for the heterogeneous TiO2
photodecomposition of organic substrates (Balasubramanian et al. 2004,
Konstantinou et al. 2002).
Anatase, rutile and brokite are the three polymorph TiO2 phases that can be
synthesised and applied as pure phases or as mixtures. Photocatalytic activity has
been demonstrated for the three phases. Due to the difficulty of synthesising pure
brookite (it is usually a minority phase along with rutile and/or anatase depending on
experimental conditions), anatase and rutile are the TiO2 polymorphs more commonly
addressed (Addamo et al. 2006). Anatase and rutile present energy band gaps of 3.2
and 3.0 eV, respectively (Balasubramanian et al. 2004). Anatase is generally regarded
as the most photochemically active phase of titania, presumably due to the combined
effect of lower rates of recombination (related with its greater rate of hole trapping)
and higher surface adsorptive capacity towards organic compounds. Mixed-phase
titania exhibit higher photocatalytic activity than anatase or rutile alone due to three (1.6)
(1.7)
(1.8)
(1.9)
factors: (1) the smaller band gap of rutile extends the useful range of photoactivity
into the visible region; (2) the stabilisation of charge separation by electron transfer
from rutile to anatase slows recombination; (3) the small size of the rutile crystallites
facilitates this transfer, generating catalytic hot spots at the rutile/anatase interface
(Hurum et al. 2003). Different commercial formulations of TiO2 are available. The
photoactivity of Degussa® P25 TiO2 was found to be higher than that of Hombikat UV
100 TiO2 for the treatment of alkylbenzene sulfonate (Mehrvar and Venhuis 2005).
Wong and Chu (2003) also reported an almost duplication of alachlor degradation
using Degussa® P25 comparatively to anatase TiO2 from BDH under 300 nm
irradiation due to the larger surface area available in Degussa® P25. Degussa® P25,
consisting of 70% anatase and 30% rutile with an average particle size of 20-30 nm,
and a BET surface area of 50 ± 15 m2 g-1 is therefore the most widely used
photocatalyst (Alhakimi et al. 2003).
It has been demonstrated that the pesticides and hormones selected for the study
described in this thesis as well as other organic compounds can be treated by
heterogeneous photocatalysis. Efficient degradations using 200 mg L-1 of suspended
Degussa® P25 were attained in a solar pilot plant: atrazine completely disappeared in
less than 1hour while complete mineralisation of alachlor and chlorfenvinphos was
attained within 240 and 320 min, respectively (Maldonado et al. 2007).
Photomineralisation of diuron in less than 45 min was also achieved using Degussa®
P25 TiO2 when an UV lamp with a maximum of light emission at 365 nm was
employed although no degradation was attained by direct photolysis (El Madani et al.
2006). 81% of propanolol was degraded after 240 min of irradiation in a solar plant
while only 30% mineralisation was reached using 0.4 g L-1 of TiO
2 (De la Cruz et al.
2013). Total organic carbon (TOC) and bisphenol A were also highly removed