UNIVERSIDADE FEDERAL DE MINAS GERAIS
P
ROGRAMA DEP
ÓS-
GRADUAÇÃO EMS
ANEAMENTO,
M
EIOA
MBIENTE ER
ECURSOSH
ÍDRICOSNANOFILTRATION AND REVERSE
OSMOSIS EVALUATION IN GOLD ACID
MINE DRAINAGE TREATMENT AIMING
WATER REUSE
Alice Oliveira Aguiar
Belo Horizonte
NANOFILTRATION AND REVERSE OSMOSIS
EVALUATION IN GOLD ACID MINE DRAINAGE
TREATMENT AIMING WATER REUSE
Alice Oliveira Aguiar
NANOFILTRATION AND REVERSE OSMOSIS
EVALUATION IN GOLD ACID MINE DRAINAGE
TREATMENT AIMING WATER REUSE
Dissertação apresentada ao Programa de Pós-graduação
em Saneamento, Meio Ambiente e Recursos Hídricos da
Universidade Federal de Minas Gerais, como requisito
parcial à obtenção do título de Mestre em Saneamento,
Meio Ambiente e Recursos Hídricos.
Área de concentração: Meio Ambiente
Linha de pesquisa: Caracterização, prevenção e controle
da poluição
Orientador: Míriam Cristina Santos Amaral Moravia
AGRADECIMENTOS
São tantas coisas a agradecer que é até difícil saber por onde começar. Agradeço primeiramente à vida, com suas infinitas possibilidades e caminhos misteriosos. A Deus, pela força para seguir em frente sempre lembrando daquilo que nos é mais importante. E por fim, às várias pessoas que direta ou indiretamente trilharam esse caminho comigo.
À Miriam, orientadora dedicada e profissional exemplar. Obrigada pela oportunidade, amizade e confiança durante esses dois anos.
Ao meu marido Luiz Gustavo, por todos os bons momentos, pelo apoio incondicional, pelo amor incalculável. Sou eternamente grata por ter te achado nesse mar infinito de pessoas.
Agradeço aos meus pais, Laura e Orlando, pelo dom da vida e por me guiar tão eximiamente nos seus caminhos. Muito obrigada primeiramente pelos valores ensinados ao longo da vida, pelo incentivo constante para sempre fazer o meu melhor, e pela força nos momentos difíceis.
Ao meu irmão, Marcelo pela constante companhia e ótima amizade. Todos os meus dias não seriam tão divertidos e completos sem você.
À minha avó Hilze. Vó, você é a pessoa mais forte e generosa que conheço; minha inspiração para ser uma pessoa mais solidária e completa. Agradeço por todas as conversas, além da atenção e carinho sempre. Ao meu avô Geraldo, pelo exemplo de vida e de dedicação.
Aos todos os meus tios, tias, primas, primos... Enfim, à minha querida família com seus caóticos encontros familiares e divertidas conversas.
Agradeço às amizades encontradas ao longo de todo esse percurso. Às minhas amigas da engenharia química que viraram amigas da vida: Aline, Barbara Ricci, Barbara Zocratto, Mariana e Lorene. Às minhas amigas desde sempre do colégio Loyola: Ana Clara, Ana Paula, Camilinha, Joana, Natália e Paty.
e Luiza, trabalhos em grupo nunca foram tão perfeitos e ao mesmo tempo divertidos. Enfim, a toda equipe do DESA. Eu nunca trabalhei com uma equipe tão competente, trabalhadora e dedicada como vocês. Sinto-me honrada de ter feito parte desse grupo.
Finalmente, gostaria de agradecer a todas as pessoas que contribuíram para a conclusão desse trabalho: Alexandre (absorção atômica), Orlando (ângulo de contato), Jéssica (AFM), Breno e Renata (MEV), Luzia e Késsia (FTIR), e muitos e tantos outros.
RESUMO
ABSTRACT
Acid mine drainage (AMD) is an effluent characterized by low pH and high concentrations of sulfate, metals, and metalloids. AMD treatment by membrane separation processes (MSP), specifically nanofiltration (NF) and reverse osmosis (RO) is particularly interesting as these processes can retain divalent ions efficiently to produce high quality permeate for industrial reuse. The literature suggests the technical viability of these processes; however, further study is needed, in special on operational parameters optimization, on economic viability evaluation, on chemical cleaning strategies, and on membrane ageing. Therefore, the aim of this study was to evaluate the main operational conditions of the AMD treatment by MSP, optimize these parameters, and conduct a preliminary capital and operational cost evaluation (Chapter 2). Then, it aimed to evaluate the membrane fouling formed during AMD treatment, evaluate the best chemical cleaning procedure in this conditions, and the membrane ageing after prolonged exposure to AMD retentate and to the chemical cleaning solution (Chapter 3). The results showed that although effluent pretreatment had no considerable effect on the membrane-fouling tendency, it improved the final NF permeate quality. The NF showed higher potential for AMD treatment than RO, as it had higher permeate flux and satisfactory solutes retention efficiency. Among the NF membranes, the NF90 had the highest solutes retention efficiency, while the NF270 had the highest permeate flux. Effluent pH affected both the retention efficiency and the membrane-fouling tendency. The best combination of membrane type and feed pH was the NF270 at pH 5.5. The maximum water recovery rate at this condition was 60%, when a sharper decrease in retention efficiency and permeate flux was observed. The estimated capital and operational costs of the UF-NF system were US$ 131,250.00, and 0.257 US$/m3 of effluent. The AMD is mainly comprised by dissolved inorganic compounds, which resulted in an inorganic fouling layer rich in aluminum, arsenic, calcium, chromium, nickel, potassium, and sodium. Among the evaluated cleaning solutions, the best cleaning agent was hydrochloric acid (HCl) at a concentration of 0.20% w/w; this concentration also provided the lowest membrane exposure to the acid. Membrane ageing caused by AMD retentate, and AMD retentate plus periodic HCl solution decreased the NF270 water permeability after 270 days by 49 and 45%, respectively. However, the membrane rejection to magnesium sulfate and glucose decreased less than 10% in both conditions. These results suggest that the NF270 membrane is stable during AMD treatment.
Keywords: Nanofiltration; reverse osmosis; acid mine drainage; water reuse; effluent pH;
SUMMARY
PUBLICATIONS ... XI
LIST OF FIGURES ... XII
LIST OF TABLES ... XIII
LIST OF ABBREVIATIONS, ACRONYMS AND SYMBOLS ... XIV
1 CHAPTER ... 1
INTRODUCTION ... 1
1.1 LITERATURE REVIEW ... 2
1.1.1 Gold ... 2
1.1.2 Acid Mine Drainage ... 4
1.1.3 Membrane Separation Processes ... 9
1.2 JUSTIFICATION ... 11
1.3 OBJECTIVES ... 12
1.3.1 General Objective ... 12
1.3.2 Specific Objectives ... 12
1.4 DOCUMENT STRUCTURE ... 12
2 CHAPTER ... 13
GOLD ACID MINE DRAINAGE TREATMENT BY MEMBRANE SEPARATION PROCESSES: AN EVALUATION OF THE MAIN OPERATIONAL CONDITIONS ... 13
2.1 INTRODUCTION ... 14
2.2 MATERIALS AND METHODS ... 17
2.2.1 Analytical Methods ... 17
2.2.2 Gold Acid Mine Drainage Characterization ... 18
2.2.3 Membrane Separation Processes ... 18
2.2.4 Evaluation of Effluent Pretreatment ... 20
2.2.5 Nanofiltration and Reverse Osmosis Membranes Evaluation ... 21
2.2.6 Evaluation of Different Feed pH Values in Nanofiltration ... 22
2.2.7 Maximum Water Recovery Rate ... 23
2.2.8 Preliminary Investment and Cost Estimate ... 23
2.3 RESULTS AND DISCUSSION ... 25
2.3.1 Evaluation of Effluent Pretreatment ... 25
2.3.2 Evaluation of Nanofiltration and Reverse Osmosis Membranes ... 28
2.3.3 Evaluation of Different Feed pH Values in Nanofiltration ... 31
2.3.4 Maximum Water Recovery Rate ... 36
3 CHAPTER ... 45
ACID MINE DRAINAGE TREATMENT BY NANOFILTRATION: A STUDY OF MEMBRANE FOULING, CHEMICAL CLEANING, AND MEMBRANE AGEING ... 45
3.1 INTRODUCTION ... 46
3.2 MATERIALS AND METHODS ... 49
3.2.1 Effluent Characterization ... 49
3.2.2 Unit Description ... 50
3.2.3 Membrane Characterization ... 50
3.2.4 Scaling Evaluation during AMD Treatment ... 51
3.2.5 Chemical Cleaning Optimization ... 52
3.2.6 Membrane Ageing... 54
3.3 RESULTS AND DISCUSSION ... 55
3.3.1 Scaling Evaluation during AMD Treatment ... 55
3.3.2 Chemical Cleaning Optimization ... 62
3.3.3 Membrane Ageing... 66
3.4 CONCLUSIONS ... 71
4 CHAPTER ... 72
SUMMARY OF EXPERIMENTAL PROGRESS ... 72
5 CHAPTER ... 75
SUGGESTIONS FOR FUTURE WORK ... 75
PUBLICATIONS
CONGRESS PUBLICATIONS:
AGUIAR, A.; ANDRADE, L.; PIRES, W.; AMARAL, M. Effect of Feed Ph in the Nanofiltration of Gold Acid Mine Drainage. 10th International Conference on Acid Rock Drainage & IMWA Annual Conference – 21 to 24 April 2015, Santiago, Chile.
AGUIAR, A.; ANDRADE, L.; PIRES, W.; AMARAL, M. Evaluation of Nanofiltration and Reverse Osmosis in the Treatment of Gold Acid Mine Drainage. 10th International Conference on Acid Rock Drainage & IMWA Annual Conference – 21 to 24 April 2015, Santiago, Chile.
AGUIAR, A.; ANDRADE, L.; PIRES, W.; AMARAL, M. Cleaning procedure for a NF membrane treating gold acid mine drainage. Euromembrane Conference – 7 to 10 September 2015, Aachen, Germany.
AGUIAR, A.; ANDRADE, L.; PIRES, W.; AMARAL, M. Nanofiltração Aplicada ao Tratamento de Drenagem Ácida de Mina de Ouro. 28º Congresso Brasileiro de Engenharia Sanitária e Ambiental – 4 to 8 October 2015, Rio de Janeiro, Brazil.
ARTICLES TO BE SUBMITTED:
A. O. AGUIAR, L. H. ANDRADE, B. C. RICCI, W. L. PIRES, G. A. MIRANDA, M. C. S. AMARAL. Gold acid mine drainage treatment by membrane separation processes: an evaluation of the main operational conditions
LIST OF FIGURES
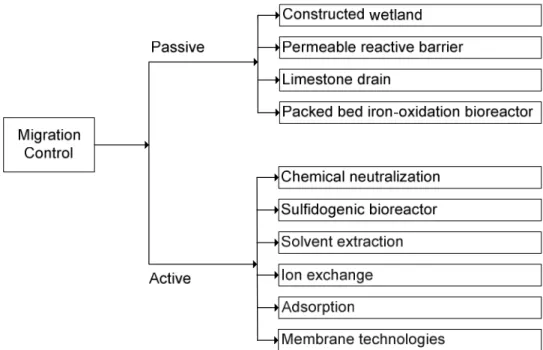
FIGURE 1.1 – Migration control technologies for AMD remediation ... 8
FIGURE 1.2 – Schematic diagram of a simplified membrane separation process ... 9
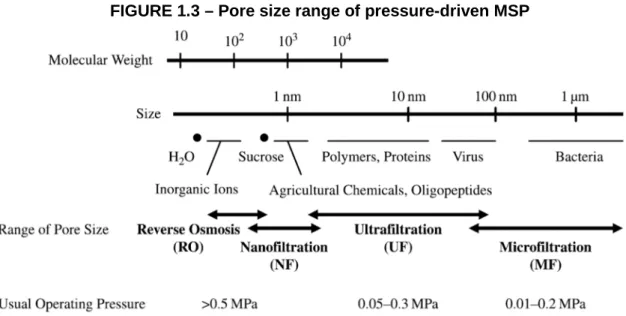
FIGURE 1.3 – Pore size range of pressure-driven MSP ... 10
FIGURE 2.1 – Schematic of NF/RO unit ... 19
FIGURE 2.2 – Permeate flux by pure water flux as a function of permeation time and feed pH for membranes a) NF90 and b) NF270 ... 32
FIGURE 2.3 – Conductivity and conductivity retention efficiency of the AMD permeate with the NF270 membrane as a function of water recovery rate ... 37
FIGURE 2.4 – Observed salt retention ( ) and recovery rate (RR) by concentration factor (CF) ... 38
FIGURE 2.5 – and values for calcium and sulfate at different RR ... 39
FIGURE 2.6 – Permeate flux, natural logarithm of fouling resistance, and process effective pressure as a function of water recovery rate ... 41
FIGURE 3.1 – Permeate flux decay during AMD treatment ... 56
FIGURE 3.2 – SEM images of the membranes: a) F-NF270; b) FAC-NF270, at x10,000 and x5,000 magnifications ... 58
FIGURE 3.3 – EDX of the precipitates found at two different points of the F-NF270 ... 58
FIGURE 3.4 – AFM images of: a) V-NF270, b) F-NF270, and c) FAC-NF270 membranes . 60 FIGURE 3.5 – ATR/FTIR spectra of the V-NF270, F-NF270, and FAC-NF270 membranes 61 FIGURE 3.6 – NF270 membrane water permeability after cleaning procedure with citric acid followed by NaOH and with NaOH followed by citric acid ... 63
FIGURE 3.7 – NF270 membrane cleaning efficiency for a single cleaning step. ... 64
FIGURE 3.8 – NF270 membrane cleaning efficiency for different HCl concentrations at 15 and 30 min of chemical cleaning. ... 65
FIGURE 3.9 – SEM images of: a) V-NF270; b) exposed to AMD (for 90 d); and c) exposed to AMD with periodic HCl (for 90 d), at x10,000 and x5,000 magnifications ... 68
FIGURE 3.10 – AFM images of the exposed NF270 membrane: a) to AMD (270 d); and b) to AMD + periodic HCl (270 d) ... 70
LIST OF TABLES
TABLE 1.1 – World demand of gold in tons by sectors in the period 2005-2013... 3
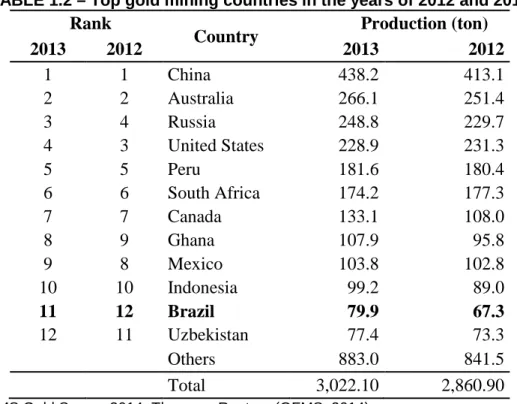
TABLE 1.2 – Top gold mining countries in the years of 2012 and 2013 ... 3
TABLE 2.1 – AMD main characteristics ... 18
TABLE 2.2 – Membranes characteristics as provided by the suppliers ... 21
TABLE 2.3 – AMD solids fraction ... 26
TABLE 2.4 – Concentration of the main pollutants on the permeate with the NF90 membrane, and system characteristics during nanofiltration ... 27
TABLE 2.5 – Water permeability, membrane resistance, average permeate flux, and fouling resistance ... 29
TABLE 2.6 – Main pollutants concentration and retention efficiency of NF/RO permeate for each membrane ... 31
TABLE 2.7 – Membrane resistance, water permeability, permeate flux by pure water flux at 40% RR, permeate flux at 40% RR, and fouling resistance at 40% RR for the membranes NF90 and NF270 ... 33
TABLE 2.8 – Main ionic concentrations and retention efficiencies of the NF90 and NF270 accumulated permeates at each feed pH ... 34
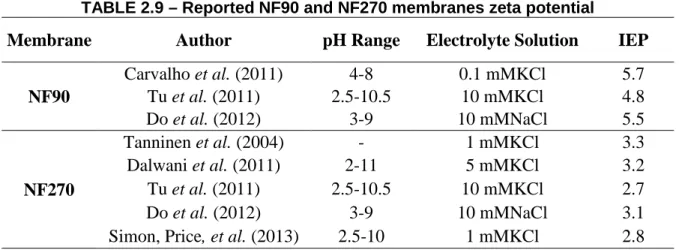
TABLE 2.9 – Reported NF90 and NF270 membranes zeta potential ... 35
TABLE 2.10 – Main pollutants concentration and retention efficiency of the AMD permeate with the NF270 membrane at ph 5.5, at every 10% of water recovery rate ... 37
TABLE 2.11 – Supersaturation degree in the bulk of the solution (Sb) and at the membrane surface (Sm) at different recovery rates ... 40
TABLE 2.12 – Cost estimation of the UF-NF treatment system for AMD ... 42
TABLE 3.1 – AMD main characteristics ... 50
TABLE 3.2 – Cations concentrations of the solutions of the acid digestion of the V-NF270 and F-NF270, and of the raw AMD ... 57
TABLE 3.3 – NF270 membrane surface roughness and water contact angle ... 59
TABLE 3.4 - Peaks assignable from ATR/FTIR spectra to polysulfone ... 62
TABLE 3.5 – Estimated price of chemicals per chemical cleaning procedure ... 65
TABLE 3.6 – Estimated cleaning time and membrane exposure to HCl for 90% cleaning efficiency by each solution concentration studied ... 66
LIST OF ABBREVIATIONS, ACRONYMS AND SYMBOLS
AMD – Acid Mine Drainage
MSP – Membrane Separation Processes
MF – Microfiltration
UF - Ultrafiltration
NF – Nanofiltration
RO – Reverse Osmosis
RR – Recovery Rate
CF – Concentration Factor
SEM/EDX – Scanning Electron Microscopy with Energy Dispersive X-ray Spectroscopy
AFM – Atomic Force Microscopy
1 CHAPTER
1.1 Literature Review
1.1.1 Gold
Gold is known to mankind since ancient times. Its bright yellow color distinguishes it from other metals. Besides, gold’s properties such as high corrosion resistance, malleability, ductility, high heat and electricity conductance and relative scarcity, made it a valuable element. Numerous civilizations before Christ were already able to use gold in jewelry and personal adornment due to natural gold deposits as nuggets and its ease of use (Schmid and Corain, 2003; Norgate and Haque, 2012).
Due to its high malleability, which can sometimes compromise the final product, in many cases gold is used in the form of alloys. The content of gold in an alloy is traditionally expressed in carats. The 24 carat gold has a purity degree of 99.99%, and is mainly used in the production of gold bars and coins for retail investment; the 18 carat gold has a purity degree of 75% (75% gold, 10 to 20% silver and 5 to 15% copper) and is extensively used in the production of jewelry in Europe and Brazil (DNPM, 2009).
TABLE 1.1 – World demand of gold in tons by sectors in the period 2005-2013
Demand 2005 2007 2009 2011 2013
Jewellery 2,721 2,425 1,817 2,029 2,361
Industry of electronics 286 322 275 320 279
Dental and medical 62 58 53 43 36
Other industrial uses 92 98 87 95 93
Retail investment (bars and coins) 412 442 825 1,569 1,778
Net official sector - 663 - 484 - 34 457 409
TOTAL (tons) 2,910 2,861 3,023 4,513 4,956
Source: GFMS Gold Survey 2014, Thomson Reuters(GFMS, 2014).
Mining and mineral processing are activities of great economic importance in Brazil. Data from the Brazilian Institute of Geography and Statistics (IBGE) indicate that mineral extraction industry accounted for 4.1% of 2013 GDP (Gross Domestic Product) which corresponded to US$ 77.9 billion. Moreover, total exports of the jewelry productive chain reached US$ 3.2 billion in the same year (DNPM, 2014). In 2013, Brazil was the world’s 11th largest gold producer, contributing a total of 79.9 tons as it is shown in TABLE 1.2 (GFMS, 2014).
TABLE 1.2 – Top gold mining countries in the years of 2012 and 2013 Rank
Country Production (ton)
2013 2012 2013 2012
1 1 China 438.2 413.1 2 2 Australia 266.1 251.4 3 4 Russia 248.8 229.7 4 3 United States 228.9 231.3 5 5 Peru 181.6 180.4 6 6 South Africa 174.2 177.3 7 7 Canada 133.1 108.0 8 9 Ghana 107.9 95.8 9 8 Mexico 103.8 102.8 10 10 Indonesia 99.2 89.0
11 12 Brazil 79.9 67.3
12 11 Uzbekistan 77.4 73.3 Others 883.0 841.5 Total 3,022.10 2,860.90
Source: GFMS Gold Survey 2014, Thomson Reuters (GFMS, 2014).
Gold is one of the few metals found in the environment in its native state, rarely being combined with other elements. Native gold is the most common form of gold and possesses a gold content of 90% or more, moreover native gold is frequently accompanied by silver. Following native gold, the gold-silver tellurides are the most common gold minerals (Norgate and Haque, 2012). There are 19 known minerals to which gold may be combined, the most frequent minerals being the calaverite (AuTe2) and sylvanite ((Au,Ag)Te2) (DNPM, 2009).
Gold can be found in placer or lode deposits. Lode deposits are deposits of metalliferous ore which fills a fissure in a rock formation, or a vein of ore that is deposited between layers of rock. Placer deposits are those formed when stable minerals with high specific gravity are freed from their matrix by weathering processes and are slowly carried to stream beds, sand beds or crevices where they concentrate. Other minerals which can be found in placer deposits are platinum, zircon and various gemstones (Norgate and Haque, 2012).
From a metallurgical perspective, gold ores may be non-refractory (or free-milling) or refractory. Non-refractory minerals are easy to treat and gold recovery is obtained by gravity separating or direct cyanidation. Refractory gold ores are those where the gold is finely disseminated in the matrix of a sulfide host mineral, their treatment is more difficult and requires a pre-treatment prior to cyanidation. The pre-treatment might be an additional process such as roasting, bacterial oxidation or pressure oxidation. Over 90% of primary gold ores in Brazil are refractory ores (MME, 2009). Besides hindering the extraction of gold, the presence of sulfides may lead to the generation of acid mine drainages as will be explained later.
In conclusion, gold is a product of great importance to modern society and Brazil is one of the largest global producers of gold. Additionally, Minas Gerais leads national production holding almost 50% of total national production. As seen in many other industrial activities, mining and mineral processing are associated with many environmental impacts. Within this context, it is important to study measures to mitigate these impacts, especially in the state of Minas Gerais. These studies should promote a more sustainable gold production process.
1.1.2 Acid Mine Drainage
huge soil movements which cause alterations on local topographic profile and create tailings deposits. It may also lead to soil erosion, noise pollution and air pollution due to the release of gas and particulates into the atmosphere. Underground mining, among other impacts, may result in damage to adjacent rocks by landslides and explosions and poor work conditions may pose health risks to operators.
Surface and groundwater can be affected by mining through disruption of hydrological pathways, possible increase in the rate of groundwater recharge, lowering of the water table, wastewater discharge, among others (Robles-Arenas et al., 2006). The acid mine drainage (AMD) is an undesired wastewater generated at some mining sites which causes significant environmental problems. AMD occurrence has been reported in the extraction of gold, coal, copper, zinc and uranium (Trindade and Barbosa Filho, 2002). It has been recognized as one of the major environmental problems of mining activity not only due to its environmental impacts, but also due to the challenges of AMD control once initiated, the high volumes involved, the associated treatment costs, and the process perpetuity (Grande et al., 2010).
AMD is characterized by its low pH and high concentration of sulfate (SO42-); as well as high
concentrations of metals (e.g. Fe, Cu, Pb, Zn, Cd, Hg, Ni, Co) and metalloids (especially As, but also Sb, Se) (Johnson and Hallberg, 2005; Robles-Arenas et al., 2006; Sierra et al., 2013). These pollutants are not biodegradable and tend to accumulate in living organisms, causing various diseases and disorders. Some environmental impacts associated with AMD include acidification of rivers and streams as well as leaching of toxic metals (Diao et al., 2013).
Acid mine drainage (AMD) generation is initiated by the oxidation of metal sulfide (particularly pyrite (FeS2), arsenopyrite (FeAsS) and pyrrhotite(Fe(1-x)S with x = 0 to 0.17)) in
mining waste, tailings and mine structures (such as pits and underground workings) of abandoned or active mines (Johnson and Hallberg, 2005; Anawar, 2013). As pyrite is the most reported cause of AMD, the oxidation of metal sulfide is often expressed in terms of pyrite oxidation. There are two main paths for pyrite oxidation. The first is through direct oxidation when exposed to oxygen and water, as expressed by EQUATION 1:
The second is through reaction with ferric iron (Fe+3), as expressed by EQUATION 2:
( ) + 14 + 8 → 15 + 2 + 16 (Eq. 2)
Both pathways are fast (Costello, 2003; Anawar, 2013). The regeneration of ferric iron occurs when there is sufficient oxygen in the system as shown in EQUATION 3. Yet, this oxidation is known to be very slow and unstable at low pH except in the presence of microorganisms which may increase the rate of ferrous iron (Fe+2) oxidation (Anawar, 2013).
4 + + 4 → 4 + 2 (Eq. 3)
Ferric iron can also precipitate as iron(III) hydroxide, the red-orange precipitate typically seen in AMD, as expressed by EQUATION 4:
2 + 6 ↔ 2 ( ) ( ) + 6 (Eq. 4)
Sulfur- and iron-oxidizing microorganisms may catalyze EQUATIONS 1 and 3, increasing the production of sulfate and ferric iron. These microorganisms consist of the Bacteria and Archaea domains. In environments impacted by AMD the main bacterial genera reported were Acidithiobacillus (specially the specie A. ferrooxidans) and Leptospirillum, other genera reported were Acidimicrobium, Acidisphaera, Acidobacterium, Acidocella, Acidiphilium,
Alicyclobacillus, Ferrimicrobium, Frateuria, Sulfobacillus and Thiomonas. The Archaea
orders reported included the thermoplasmatales (specially the iron-oxidizing genus
Ferroplasm), sulfolobales and methanomicrobiales (Mohapatra et al., 2011).
According to Grande et al. (2010), AMD is an anthropogenic process as it results from the action of man. The oxidation of metal sulfides also occurs in undisturbed rocks, however at rates so slow that the water or the host rock is able to buffer the acid generated (Costello, 2003; Anawar, 2013). Due to mining activity and grain-size reduction, the surface area of metal sulfides increases and they become more prone to oxidation thus exceeding the buffering capabilities of the system.
Diao et al., 2013). On the other hand, migration control techniques aim to remediate the AMD that has already been generated.
At-source control methods include selective handling and alkaline amendment, dry barriers, wet covers and biocides. Selective handling and alkaline amendment seeks to blend acid-producing and acid-consuming (such as carbonate) minerals to produce a benign composite. The accurate prediction of the amount of alkalinity needed in each situation has a significant cost and long-term liability implications. Moreover, the presence of alkalinity in the tailing and mining spoils does not ensure that the acidity will be neutralized as a direct contact between the infiltrating water and the alkalinity is needed (Barnhisel et al., 2000). A variation of this method is the coating technology, or passivation. The coating is usually composed of phosphate or silicate composites and prevents the direct contact of pyrite with oxidizing agents (Diao et al., 2013). Dry barriers and wet covers (underwater storage and flooding and sealing of abandoned deep mines) aim to retard the movement of oxygen and/or water into the acid-producing minerals, therefore minimizing AMD generation. Lastly, biocides have been applied in tailings and mining spoils to inhibit microbial activities, decreasing the rates of reactions expressed by EQUATIONS 2 and 3 (Johnson and Hallberg, 2005).
At first, at-source control methods may seem more attractive than traditional treatments as they can permanently solve AMD problems and do not require facilities for continued treatment after mine closure. However, these methods are unable to control 100% of the net-acidity produced on-site and migration control techniques would still be needed for the remaining AMD. Additionally, at-source control techniques for abandoned mines sites are generally unfeasible. This is mainly due to the absence of reliable mine maps and restricted access for the underground mines; and, for the surface mines, due to the huge volumes of tailings of unknown composition and expense related to rehandling and mixing these tailings (Barnhisel et al., 2000).
FIGURE 1.1 – Migration control technologies for AMD remediation
Among the migration control technologies, the most widespread is chemical neutralization. This process consists of continuously adding lime or other alkaline material in the AMD, increasing the effluent pH and precipitating many metals as hydroxides or carbonates. Although much used, this technology has the drawbacks of requiring large amounts of reagents and generating a secondary waste which must be properly disposed of. Besides, the precipitation of metals is not selective, thus hindering metal recovery (Sierra et al., 2013).
1.1.3 Membrane Separation Processes
Membrane separation processes (MSP) use a selective barrier (membrane) which under a driving force can promote the total or partial separation of the solution components. The feed solution is then divided into two streams: the fraction that crosses the membrane called the permeate; and the fraction which remains in the feed side called the retentate (Baker, 2012). FIGURE 1.2 shows a simplified diagram of a membrane separation process, here Qf, Qp and
Qr represents the feed, permeate and retentate flux, respectively; and Cf, Cp and Cr represents,
respectively, the feed, permeate and retentate solution concentration of any solution component.
FIGURE 1.2 – Schematic diagram of a simplified membrane separation process
FIGURE 1.3 – Pore size range of pressure-driven MSP
Source: Advanced membrane technology and applications (Li et al., 2011).
RO membranes are dense non-porous membranes (Drioli and Giorno, 2009). The free volumes observed in these membranes are the spaces between the polymeric chains caused by thermal vibration of the polymer molecules (Baker, 2012). These membranes can separate solution components of low molecular weight, like monovalent inorganic ions (Jamaly et al., 2014). The predominant transport mechanism through RO membranes follows the solution-diffusion model. In this model the solution components dissolve in the membrane material and then diffuse through the membrane. Thus, membrane selectivity is achieved due to differences in the solution components solubility in the membrane material, and differences in the solution components diffusion rate (Baker, 2012).
NF membranes are an intermediate between UF membranes and RO membranes (Hilal et al., 2005; Baker, 2012). They have pore sizes ranging from 1-2 nm and can retain small molecules like divalent inorganic ions and sugars (Jamaly et al., 2014). Permeation through NF membranes is a complex combination of molecular exclusion and charge interaction as well as on the solution-diffusion mechanism (Drioli and Giorno, 2009). Both NF and RO are of special interest in water and wastewater treatment, as they can retain macromolecules as well as dissolved inorganic ions.
Moreover, the increase in membrane units throughout the world has decreased the cost of membrane modules, thus making these processes more economically viable.
The literature presents few studies of AMD treatment with MSP. Al-Zoubi et al. (2010) studied the treatment of two synthetic AMD solutions with nanofiltration (NF99-Alfalaval and DK-GE-Osmonics) and reverse osmosis membranes (HR98PP- Alfalaval). Sierra et al. (2013) treated a mercury AMD using the NF-2540 membrane (FILMTEC™). Mullett et al. (2014) investigated the treatment of a cooper AMD with two NF membranes (NF 270-Dow and TS 80-TriSep). Although these studies point to the viability of this technology, they evaluate the effects of some operational parameters but do not attempt to optimize AMD treatment. The long-term viability of AMD treatment with MSP was even less studied. It depends on the membrane stability to the AMD solution, and to the chemical cleaning agent used to maintain membrane fouling controlled.
Therefore, this study aimed to evaluate some of the main operational parameters of MSP and optimize them. With this optimization, a more precise investment and cost estimate could then be conducted. Finally, membrane chemical cleaning was studied and membrane ageing during AMD treatment was investigated.
1.2 Justification
1.3 Objectives
1.3.1 General Objective
The present study aims to investigate the use of nanofiltration and reverse osmosis in the treatment of gold acid mine drainage aiming at water production with high quality for industrial reuse.
1.3.2 Specific Objectives
The specific objectives are:
1. Investigate the influence of different pretreatments on the nanofiltration of AMD; 2. Evaluate different nanofiltration and reverse osmosis membranes, selecting the most
suited for this application;
3. Study the influence of feed pH on the NF process and optimize this operational parameter;
4. Optimize water recovery rate aiming at higher permeate productivity and lower membrane-fouling tendency;
5. Conduct a preliminary investment and cost estimate of the optimized treatment system;
6. Evaluate membrane cleaning agents and optimize the cleaning solution concentration; 7. Investigate membrane fouling during AMD treatment;
8. Study the NF270 membrane ageing by AMD retentate and a combination of AMD retentate and cleaning solution.
1.4 Document Structure
2 CHAPTER
2.1 Introduction
Gold has high commercial value because of the unique properties and relative scarcity of this element. Gold mining and processing are important economic activities in Brazil, and, in 2013, the mineral extraction industry accounted for 4.1% of Brazil's GDP (Gross Domestic Product) (DNPM, 2014). More than 90% of the primary gold ore in Brazil is refractory ore (MME, 2009), which generally contains sulfide minerals. The oxidation of sulfide minerals in mining waste, tailings, and structures of active or abandoned mines can cause the formation of acid mine drainage (AMD). AMD is recognized as one of the most difficult environmental problems confronting mining companies; because of the ecological consequences of AMD, the difficulty of controlling it once it has started, the large volumes involved, the high associated treatment costs, and the perpetuity of the process (Grande et al., 2010). AMD is characterized by low pH and high concentration of sulfate, as well as high concentrations of metals and metalloids (Johnson and Hallberg, 2005; Robles-Arenas et al., 2006; Sierra et al., 2013).
However, NF and RO processes are highly susceptible to membrane fouling, which is caused by the deposition of organic and inorganic matter and/or the formation of biofilms on the membrane surface (Simon, Mcdonald, et al., 2013). Although membrane fouling in MSP is inevitable, the rate and extent of fouling can be influenced by the feed characteristics, membrane properties, and operational conditions (Wei et al., 2010). It is essential to control membrane fouling to ensure an economically feasible operation. Membrane fouling: increases the feed pressure requirement, which leads to higher energy consumption or lower system productivity; increases the chemical costs and reduces the membrane lifespan because of the increased cleaning frequency; increases the potential of damage to the membrane; and causes deterioration in the permeate quality because of reduced water permeability and higher concentration polarization (Ang et al., 2011).
Feed characteristics play a significant role in determining foulant–membrane and foulant– foulant interactions, and, consequently, membrane-fouling tendency (Wei et al., 2010). Effluent pretreatment can improve feed solution characteristics by removing some foulant compounds, such as colloidal impurities, inorganic precipitates, macromolecules, and biological contaminants, thereby reducing the fouling tendency of the membrane. Various technologies are available for effluent and water pretreatment and in the selection of the technology, one must consider the most expected membrane foulants. Inadequate feed pretreatment is the major cause for RO system failure/inefficiency (Chakravorty and Layson, 1997); therefore, the system should be well designed and operated. Moreover, variations in the feed quality have to be monitored, as they could be transferred to the NF or RO membranes (Pearce, 2008). Microfiltration (MF) and ultrafiltration (UF) are often used as effluent pretreatment for NF and RO systems. Because of the smaller pore size, MF and UF are more effective at removing fouling components and particulates than conventional pretreatments.
The membrane surface properties, such as hydrophobicity/hydrophilicity, surface roughness, and membrane charge density and charge polarity directly influence the fouling tendency of the membrane. The majority of commercial NF and RO membranes are made from polymers that have high thermal, chemical, and mechanical stability (Lalia et al., 2013), and functional groups, such as -OH and -NH2, can be added to the membrane surface to increase its
Usually, commercial membranes are negatively charged to minimize the adsorption of negatively charged organic foulants and to increase salt rejection (Li et al., 2011). The negative surface charge can be accomplished by adding functional groups, such as sulfonic and/or carboxylic acid groups, as these groups can deprotonate in the feed solution (Lalia et
al., 2013). Therefore, the surface properties of the membrane depend on the polymeric
material of the membrane, the manufacturing process, and the added functional groups, as well as the conditions to which the membrane is exposed. The feed solution pH, for example, has a significant effect on the membrane charge and the distribution of solute species, as it can protonate and deprotonate the membrane functional groups and/or the molecules in the solution; and consequently, influences the process efficiency.
Finally, operational conditions, such as feed pressure, temperature, and feed flow rate, influence the convective transport of foulants toward the membrane surface (Wei et al., 2010). Wang et al. (2005) have observed that higher operating pressures yielded higher initial permeate flux but faster decline in permeate flux with time, which is explained by the severer membrane fouling originated from foulants drag, denser foulant layers and consequent higher concentration polarization. They also studied crossflow velocity, and higher velocities lessened membrane fouling. This is explained by the back transport of solute to the bulk solution, consequently diminishing concentration polarization. However, one of the most important operational conditions for designing NF/RO systems is the water recovery rate. The water recovery rate (RR) is defined as the feed flow rate divided by the permeate flow rate. Consequently, higher RR implies higher system productivity and lower retentate production, which, consequently, influence the treatment capacity and the investment in equipment (Bi et
al., 2014). The water recovery rate is limited by an increase in the solute concentration of the
feed solution. This increase leads to higher osmotic pressure, lower effective pressure, and higher fouling tendency because of the higher concentration polarization. Jamaly et al. (2014) pointed out that the water recovery rate had the strongest effect on both capital and operational costs.
rejection of heavy metal ions by nanofiltration (NF270-Dow membrane) was further investigated by Al-Rashdi et al. (2013) pertaining to the effects of feed pH, pressure, and metal concentration on cations rejection and permeate flux. These authors observed that metal rejection was higher at a feed pH below the membrane isoelectric point, attributable to the positive charge on the membrane surface. Tests were also carried out on non-synthetic AMD solutions. Sierra et al. (2013) treated mercury AMD by employing the NF-2540 (FILMTEC™) membrane. They studied the effects of pressure and volume reduction factor (feed concentration) and observed that the permeate flux was similar to the pure water flux up to a pressure of 10 bar, which suggests low concentration polarization. Moreover, the rejection of pollutants increased with the pressure and, at 10 bar, sulfate rejection was 88%. On the other hand, Mullett et al. (2014) investigated the treatment of copper AMD with two NF membranes (NF 270-Dow and TS 80-TriSep). They conducted feed pH and water recovery tests; however, only for the feed pH test with the NF 270 membrane used non-synthetic effluent. The results for this tests show that sulfur (S-2) rejection increased with higher pH, while the rejection of cations (Ca+2, Cu+2, Mg+2, and Mn+3) decreased with higher pH. Moreover, all the reported rejections were higher than 88%.
Evidently, membrane separation processes showed high potential for AMD treatment, with high pollutants retention efficiencies. However, a thorough evaluation of AMD treatment in relation to all the main process characteristics was still needed. Therefore, the aim of this study was to evaluate gold AMD treatment relevant to feed pretreatment, membrane selection, pH adjustment, and maximum water recovery. With these conditions optimized, a more realistic cost assessment could be obtained.
2.2 Materials and Methods
2.2.1 Analytical Methods
Multi-element analyses of liquid samples were performed by ion chromatography (Dionex ICS-1000 ion chromatography, equipped with column type IonPac AS22 and IonPac CS12A). The other parameters analyzed were pH (pHmeter Qualxtron QX 1500), conductivity (Hanna conductivity meter HI 9835), turbidity (Hach 2100AN turbidimeter), and solid fractions. All analyses were performed in accordance with the Standard Methods for the Examination of
2.2.2 Gold Acid Mine Drainage Characterization
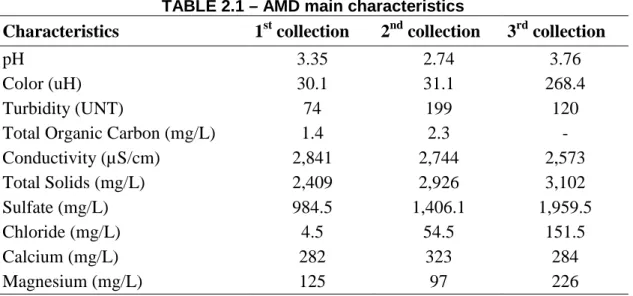
AMD was collected at a gold mining company site in the state of Minas Gerais, Brazil. The company has two underground gold mines and an industrial processing plant. AMD was collected at one of the underground mines, at the fourth level below ground. The AMD flow rate at this industrial facility was 15 m3/h. The AMD characteristics vary throughout the year, and the effluent properties of greatest interest to the present study are presented in TABLE 2.1.
TABLE 2.1 – AMD main characteristics
Characteristics 1st collection 2nd collection 3rd collection
pH 3.35 2.74 3.76
Color (uH) 30.1 31.1 268.4 Turbidity (UNT) 74 199 120 Total Organic Carbon (mg/L) 1.4 2.3 - Conductivity (µS/cm) 2,841 2,744 2,573 Total Solids (mg/L) 2,409 2,926 3,102 Sulfate (mg/L) 984.5 1,406.1 1,959.5 Chloride (mg/L) 4.5 54.5 151.5 Calcium (mg/L) 282 323 284 Magnesium (mg/L) 125 97 226
Each batch of experiments used the same AMD collection sample to enable the comparison of the results.
2.2.3 Membrane Separation Processes
2.2.3.1 Microfiltration and Ultrafiltration
The microfiltration (MF) module was a submerged membrane module provided by Pam Membranas Seletivas Ltda., with a filtration area of 0.04 m2, average pore diameter of 0.4 µm, and a polyetherimide-based polymer. MF occurred at a pressure of 0.7 bar, with up to 60% of water recovery.
2.2.3.2 Nanofiltration and Reverse Osmosis
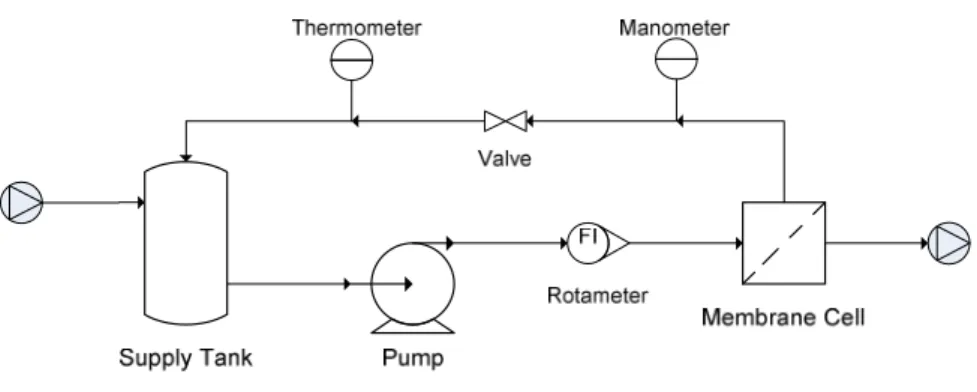
For the nanofiltration and reverse osmosis experiments, a bench-scale unit was used. This unit comprised the following: a supply tank, a pump, a valve for pressure adjustment, a rotameter, a manometer, a thermometer, and a stainless-steel membrane cell. The diameter of this membrane cell is 9.8 cm, providing a filtration area of 75 cm², and the diameter of the inlet channel is 0.64 cm. A feed spacer with approximate thickness of 1 mm was placed over the membrane to promote flow distribution. FIGURE 2.1 is a schematic of the NF/RO unit.
FIGURE 2.1 – Schematic of NF/RO unit
This unit used flat-sheet commercial membranes after they had been properly cut to fit the membrane cell. These membranes were first placed in an ultrasound bath with citric acid solution at pH 2.5, followed by an ultrasound bath with 0.1% NaOH solution, for 20 minutes each. This procedure aimed to remove possible residual components from the membrane surface. Subsequently, one clean membrane at a time was inserted onto the membrane cell and pre-compacted with distilled water at 10 bar, until permeate flux stabilization. Finally, the effluent filtration test was conducted at 10 bar, with a feed flow rate of 0.14 m3/h, and the temperature at approximately 25 °C.
#$ = ) ∙ %+ ∙%( ,(25°/),(-) (Eq. 5)
where ΔV/Δt is the permeate volume by time, A is the filtration area, J5 is the normalized permeate flux at 25 °C, μ(T) is the water viscosity at the process temperature, and μ(25 °C) is the water temperature at 25 °C.
2.2.3.3 Resistance to filtration
According to the simplified resistance-in-series model, the total filtration resistance could be divided into intrinsic membrane resistance and fouling resistance. The intrinsic membrane resistance to filtration (R:) was determined from EQUATION 6:
;< = = ∙ ,(25°/)1 (Eq. 6)
The fouling resistance to filtration (R>) was calculated based on the values of the normalized effluent permeate flux (J$,@) obtained near the end of each experiment, as shown in EQUATION 7:
;> = μ(25°/) ∙ #%A − C ∙ %D
$,@− ;<
(Eq. 7)
where (%P − σ ∙ Δπ) is the process effective pressure, i.e., applied pressure minus osmotic pressure, multiplied by the reflection coefficient (Noble and Stern, 1995). The reflection coefficient (σ) was estimated as the average molar retention, and the osmotic pressure difference was calculated using the van't Hoff equation (EQUATION 8):
∆D = HI/J− /KL ∙ ; ∙ -M
NOP
(Eq. 8)
where Cr and Cp are the concentrations of solute “i” on the retentate and permeate,
respectively, R is the universal gas constant, and T is the temperature in Kelvin.
2.2.4 Evaluation of Effluent Pretreatment
effluent, effluent pre-filtered with qualitative filter paper (Fmaia - 8µm), and effluent pre-filtered by microfiltration. The AMD used on these experiments was from the 1st collection. Nanofiltration was carried out with the membrane NF90, supplied by Dow Filmtec (TABLE 2.2).
After the membrane was pre-compacted, nanofiltration with the three AMD feed solutions was carried out for two hours. The permeate flux and the temperature were measured every seven minutes. The final accumulated permeate was collected for analysis, while the retentate was continuously returned to the supply tank. Feed and permeate were analyzed for conductivity, total solids, and ion concentrations.
2.2.5 Nanofiltration and Reverse Osmosis Membranes Evaluation
The feed solution characteristics and the required permeate quality for reuse can directly influence the membrane selection for a given process. Three NF membranes and two RO membranes were compared for the treatment of gold AMD. The NF membranes analyzed were NF90, NF270, and MPF-34, while the RO membranes analyzed were TFC-HR and BW30. TABLE 2.2 shows the main characteristics of these membranes, as provided by the suppliers.
TABLE 2.2 – Membranes characteristics as provided by the suppliers
Reverse Osmosis Nanofiltration
Characteristic TFC-HR BW30 MPF-34 NF90 NF270 Supplier Koch
Membrane Dow Filmtec™ Koch Membrane Dow Filmtec™ Dow Filmtec™ Membrane Material Proprietary TFC® polyamide Polyamide Thin-Film Composite Proprietary SelRO™ composite Polyamide Thin-Film Composite Polyamide Thin-Film Composite Maximum Operating
Pressure (bar) 41 41 35 41 41 Maximum Operating
Temperature (°C) 45 45 70 40 40 pH Range,
Continuous Operation 4 - 11 2 - 11 0 - 14 2 - 11 2 - 11 NaCl Retention 99.55% a 99.5% b 35% c 85-95% d - CaCl2 Retention - - - - 40-60% e
MgSO4 Retention - - - > 97% f > 97% f
a
Test conditions: 2,000 mg/L NaCl at 15.5 bar applied pressure, 15% recovery, 25 °C, and pH 7.5. b
Test conditions: 2,000 ppm NaCl at 15.5 bar applied pressure, 15% recovery, and 25 °C. c
Test conditions: 5% NaCl at 30 bar, 30 °C. d
The NF270, NF90, and BW30 Dow Filmtec™ membranes were selected to obtain a wide range of salt rejection values. The NF270 is a loose NF membrane, with low salt rejection; while the NF90 is a tight NF membrane, with moderate rejection; and the BW30 is a RO membrane, with high rejection, commonly used in the second pass of RO desalination (Tu et
al., 2011). On the other hand, the MPF-34 and TFC-HR Koch Membrane Systems®
membranes were selected for stability over a wide range of pH (0–14) and high salt rejection, respectively. The TFC-HR membrane is a low-pressure RO membrane, typically used in the treatment of brackish water and in water reclamation (Fujioka et al., 2012), whereas the MPF-34 membrane can be used for acid and caustic recovery because of its high pH resistance (Balanyà et al., 2009).
AMD from the second collection was used for the membranes evaluation and MF was conducted as NF or RO pretreatment. The nanofiltration and reverse osmosis experiments were carried until a water recovery rate of 10% was achieved. The permeate flux, temperature, and the permeate accumulated volume were measured periodically. The final accumulated permeate was collected for analysis, while the retentate was continuously returned to the supply tank. Feed and permeate solutions were analyzed for conductivity, total solids, and ion concentrations.
2.2.6 Evaluation of Different Feed pH Values in Nanofiltration
The influence of feed pH on gold AMD nanofiltration was assessed. The nanofiltration membranes investigated were the NF90 and NF270, while the assessed feed pHs values were 3.2 (natural effluent pH), 4.2, 5.0, 5.5, and 6.0. The AMD used on these experiments was from the second collection.
2.2.7 Maximum Water Recovery Rate
The water recovery rate is defined as the ratio of feed flux (Qf) to permeate flux (Qp)
(EQUATION 9). It is an important index for NF system design, since it affects the process capacity and the demand for investment in equipment.
;; =QQK
R∙ 100%
(Eq. 9)
The maximum water recovery rate for the treatment of gold AMD was experimentally determined. This experiment used AMD from the third collection. First, the pH of the AMD was adjusted to 5.5 and, subsequently, the effluent was pretreated with UF. Finally, a volume of 10 L of this pretreated effluent was nanofiltered. NF was carried out until a water recovery rate of 80% was obtained. The permeate was collected for analysis, while the retentate was continuously returned to the supply tank.
At every 100 mL of permeate obtained, the permeate flux and the temperature were measured; while at every 500 mL obtained, the conductivity and pH were measured; and at every 1,000 mL obtained, the ion concentrations were determined.
2.2.8 Preliminary Investment and Cost Estimate
A preliminary study was conducted to estimate the capital and operational expenses (CapEx and OpEx) of the optimized AMD treatment system. The following variables were considered: membrane unit cost, membrane replacement, alkalizing agents, chemical cleaning agents, energy consumption, and system maintenance.
The capital cost of the UF-NF membrane unit considered one filtration stage and a AMD volumetric flow of 15 m³/h, which is the capacity of the designed system (QUVW). To estimate the capital cost per cubic meter of effluent, the capital cost was annualized by means of the amortization factor, as presented in EQUATION 10 (Sethi and Wiesner, 2000):
)/A =(1 + XXY∙ (1 + XY)Z[
Y)Z[− 1
where (A/P) is the amortization factor, XY is the investment rate (in 2015 was equal to 10% in Brazil), and DL is the design life of the plant. The UF-NF system design life was considered to be 15 years. The capital cost per cubic meter was obtained from EQUATION 11:
/Y\K/]^ =/Y\K∙ )/A
QUVW
(Eq. 11)
where /Y\K/]^ is the capital cost per cubic meter of effluent, /Y\K is the system capital cost, and QUVW is the capacity of the designed system.
Membrane replacement costs considered an average membrane lifespan of 5 years. To determine the cost for membrane replacement, the required membrane area for UF and NF was determined. The recovery rate was set at 90% and 60% for ultrafiltration and nanofiltration respectively. An average permeate flux of 25 L/h.m² was considered for NF, and of 40 L/h.m² for UF. NF and UF membranes costs were 50.00 and 75.00 US dollars per square meter, respectively. These prices were provided by a large commercial membrane supplier.
The alkalizing agent used was NaOH. The volume of NaOH solution used to adjust the pH of the raw effluent was measured and used to estimate the neutralizing cost of the process. In this estimate, NaOH price was assumed as 425.00 US$/ton of NaOH1. In the cost estimation of the chemical cleaning agent, a cleaning frequency of once a week for one hour was assumed. The cleaning agent used was HCl solution at 0.2% w/w, which has an approximate price of 7.10 US$/L of HCl (37%)2. The volume of the cleaning solution considered the volume of the NF modules and the an estimated volume of the feed and return pipes.
The energy cost estimate comprised the UF power requirement and the NF feed pump requirement. The UF power requirement was estimated at 0.2 kWh/m3 (Pearce, 2008). The NF feed pump requirement was obtained from EQUATIONS 12 and 13 (Sethi and Wiesner, 2000):
1 Value available at: <
http://www.icis.com/resources/news/2006/05/06/2013928/chemical-profile-caustic-soda/>. Accessed on: 13 October 2015.
QR =# ∙ A;; (Eq. 12)
`R =%A ∙ Qc b (Eq. 13)
where QR is the NF feed flow, `R is the energy for feed pump, # is the average NF permeate flux (equals 25 L/h.m²), A is the total NF membrane area, RR is the water recovery rate (60%), %A is the applied pressure (10 bar), and c is the feed pump efficiency (considered as 70%). The energy tariff paid by this mining company in Brazil is 0.04 US$/kWh (considering an exchange rate of US$1 = R$0.25).
Maintenance costs were estimated at 5% per year of the initial investment cost (Shen et al., 2014).
2.3 Results and Discussion
2.3.1 Evaluation of Effluent Pretreatment
Pretreatment is an important step in NF and RO operations, since the membrane will be less prone to fouling because of the removal of foulants components from the feed solution. Acid mine drainage (AMD) effluent with three different pretreatments were tested as NF feed solutions, namely, raw AMD, AMD pre-filtered with qualitative paper, and microfiltered AMD. The qualitative paper filter has a pore diameter of 8 µm, close to the pore diameter of industrial cartridge filters, which is approximately 5µm (Shahalam et al., 2002).
TABLE 2.3 – AMD solids fraction
Total solids (mg/L)
Total fixed solids (mg/L)
Total volatile solids (mg/L)
Total suspended solids (mg/L)
Fixed suspended solids (mg/L)
Volatile suspended solids (mg/L)
2,409 1,845 564 36 27 9
As is apparent from TABLE 2.3 there is a high concentration of total fixed solids (TFS) compared with total volatile solids (TVS). The TVS is usually considered organic matter, although some organic matter will not volatize at high temperature (500 °C), while some inorganic matter will volatize (Tchobanoglous et al., 2003). On the other hand, the TFS is mostly composed of inorganic matter and ions. Therefore, the main foulant anticipated in AMD treatment is scaling, and not biofouling. Scaling is formed by the crystallization and deposition of sparingly soluble inorganic salts. Various techniques can be applied to minimize scaling, such as pH adjustment, system design, and anti-scaling dosage (Karabelas et al., 2014; Henthorne and Boysen, 2015). Because of the high concentrations of sulfate and calcium ions in AMD, calcium sulfate (CaSO4) scaling is the most anticipated in AMD
treatment. Jamaly et al. (2014) stressed the importance of anti-scaling evaluation and optimization prior to usage. In this study, anti-scaling was not used to enhance permeate recovery, since retentate treatment by precipitation (as CaSO4 or CaCO3) would be more
difficult after an scaling dosage. A detailed evaluation of AMD treatment with anti-scaling will be undertaken in future work.
TABLE 2.4 shows the concentration of the main pollutants in the permeate, and the system characteristics obtained during nanofiltration. The pollutant concentration was measured on the accumulated nanofiltration permeate (obtained with the NF90 membrane) for each feed pretreatment, while the observed retention efficiency (Rdef) was obtained from EQUATION 14:
;ghW(%) = /R/− /K
R ∙ 100%
(Eq. 14)
where /R and /K are the concentrations in the feed and permeate solutions for each solution component.
(TABLE 2.4), probably because the process is more stable in this condition. As this treatment system aims to obtain a high quality permeate, suitable for reuse as process water, the retention of sulfate and calcium ions have to be optimized, as these ions can precipitate in pipes and equipment, resulting in damage. The increase in the retention efficiency of these ions is an advantage of using microfiltration prior to nanofiltration for the proposed treatment system. Chakravorty and Layson (1997) reported that microfiltration pretreatment was able to deal with high load variation in a desalination plant, while providing consistent water quality. On the other hand, media filters (such as the qualitative paper filter used in this study) could leak pollutants when the feed flow rate changed and/or became overloaded.
TABLE 2.4 – Concentration of the main pollutants on the permeate with the NF90 membrane, and system characteristics during nanofiltration
AMD
Pretreatment Characteristics Raw AMD
Pre-filtered AMD Microfiltered AMD Permeate Concentration [Retention (%)]
Total Solids (mg/L) 495 (79.5) 482 (80.0) 293 (87.8) Calcium (mg/L) 93.9 (66.7) 82.3 (70.8) 42.8 (84.8) Magnesium (mg/L) 67.7 (45.9) 59.1 (52.8) 18.7 (85.0) Sulfate (mg/L) 7.2 (99.3) 6.7 (99.3) 5.2 (99.5) Chloride (mg/L) 1.4 (68.0) 1.1 (75.7) 1.2 (74.0)
System
Characteristics
Reflection Coefficient (σ) 0.77 0.80 0.91 ∆Peffective (bar) 9.67 9.64 9.53
Average Permeate Flux by
Water Flux (%) 87.1 79.1 79.1 Water Permeability
(m³/s.m².Pa) 8.4×10
-12
The ratio of average effluent permeate flux by water flux was 87.1, 79.1, and 79.1, respectively, for the raw AMD, the pre-filtered AMD, and the microfiltered AMD (TABLE 2.4). In this case, effluent permeate flux by water flux was used to minimize the influences that variations in water permeability could have on the comparison of effluent permeate fluxes. The lower permeate flux with the microfiltered AMD can be partly explained by the lower effective pressure obtained in this condition. However, a complete investigation of the fouling mechanism is needed to fully explain the observed difference. The average permeate flux for the microfiltered AMD was 26.4 L/h.m2. Sierra et al. (2013) obtained with the NF2540 membrane a permeate flux of approximately 45 L/h.m2 for mercury AMD at an effective pressure of 10 bar and feed flow rate of 1,000 L/min. Besides the obvious difference in effluent solution and membrane characteristics, the increase in feed flow rate increases the shearing forces and decreases membrane fouling which could explain the higher permeate flux obtained.
The water permeability (K) of the NF90 membrane, membrane resistance to filtration (Rm),
and fouling resistance (Rf) are indicated in TABLE 2.4 for each AMD pretreatment
investigated. Water permeability was measured before effluent filtration, and its variability is a result of variations in the membrane characteristics, or in the effectiveness of membrane cleaning. From TABLE 2.4 it is clear that the final fouling resistances obtained after two hours of filtration for each pretreatment had the same order of magnitude, which suggests that the nanofiltration of raw, pre-filtered, and microfiltered AMD does not cause severe membrane fouling. The low fouling tendency is also corroborated by the low initial concentrations of fouling components, such as suspended solids and organic matter, in the raw effluent. However, even low concentrations of fouling components can directly increase the frequency of cleaning and maintenance of the membrane and, therefore, reduce the membrane lifespan. Moreover, the high variability of AMD throughout the year suggests the importance of pretreatment to prevent possible damage to or failure of the system. Additionally, microfiltration (or ultrafiltration) can ensure higher permeate flux, reduce fouling and chemical usage, and increase on-stream time (Pearce, 2008).
2.3.2 Evaluation of Nanofiltration and Reverse Osmosis Membranes
the industrial process. All five membranes used in this study are thin-film anisotropic composite membranes with a thin polyamide (PA) skin layer over a microporous support layer. Since the permeation rate is inversely proportional to the membrane thickness, a thinner membrane provides higher permeation rates. The membrane skin layer provides separation properties and permeation rates, while the microporous layer provides mechanical strength (Tu et al., 2011; Baker, 2012).
TABLE 2.5 presents the water permeability, membrane resistance, fouling resistance at 10% of effluent recovery rate, and average permeate flux. As anticipated, the RO membranes tested (TFC-HR and BW30) showed permeate fluxes considerably lower than the NF membranes (MPF34, NF90, and NF270) during the filtration time. Among the NF membranes, the NF270 showed the highest permeate flux throughout the test. The average permeate flux of the NF270 membrane was 88.6 L/h.m2, while the average permeate fluxes of the BW30 and TFC-HR RO membranes were 10.0 and 10.2 L/h.m2, respectively, which confirmed the denser polymeric structure of these RO membranes. The NF270 membrane had a water permeability 44.1 and 58.8% higher than the other two NF membranes, namely, NF90 and MPF-34, respectively. These results are in accordance with the structure of these membranes and with the water permeability reported in other work (Balannec et al., 2005; Balanyà et al., 2009; Tu et al., 2011).
TABLE 2.5 – Water permeability, membrane resistance, average permeate flux, and fouling resistance
Membrane
Water permeability
(m3/s.m2.Pa)
Membrane resistance
(m-1)
Average permeate flux
(L/h.m2)
Fouling resistance at 10% water recovery (m-1)
TFC-HR 3.4×10⁻¹² 3.3×10+14 10.2±0.2 4.1×10+13 BW30 3.2×10⁻¹² 3.5×10+14 10.0±0.3 3.1×10+13 MPF-34 1.4×10⁻¹¹ 8.1×10+13 45.2±1.9 4.8×10+12 NF90 1.9×10⁻¹¹ 6.0×10+13 55.7±3.0 1.0×10+13 NF270 3.4×10⁻¹¹ 3.3×10+13 88.6±4.2 1.1×10+13
for effluent treatment (Balannec et al., 2005; Al-Zoubi et al., 2010; Fornarelli et al., 2013; Mullett et al., 2014).
Moreover, higher fouling resistances were observed for the RO membranes than for the NF membranes (TABLE 2.5). The RO membranes tend to have higher concentration polarization resistances compared with the NF membranes, attributable to their higher rate of ionic rejection. In addition, these high rejections increases the fouling tendency of RO membranes, owing to an increase in ion concentration at the membrane surface that tends to precipitate. The membrane-fouling tendency in pressure-driven processes can also be influenced by the membrane surface properties, since membranes with smoother and/or more hydrophilic surfaces tend to have a lower fouling tendency (Wei et al., 2013). Tu et al. (2011) reported a water contact angle of 54.6±3.0°, 50.9±4.9°, and 28.8±2.4° for the BW30, NF90, and NF270 membranes, respectively. Liu et al. (2011) reported a root-mean-squared roughness of 118.6±12.3nm and 72.8±9.5nm for the BW30 and NF90 membranes, respectively. Therefore, a lower fouling tendency was expected for the NF membranes compared with the RO membranes. Among the NF membranes, a lower water contact angle and lower surface roughness also increased water permeability and permeate flux.
The treated mother liquor in this plant contained 275–285 g/L of NaCl and 550–600 mmol/L of sulfate.
TABLE 2.6 – Main pollutants concentration and retention efficiency of NF/RO permeate for each membrane
Membrane
Permeate Concentration [Retention (%)] Conductivity
(µS/cm)
TS (mg/L)
Calcium (mg/L)
Sulfate (mg/L)
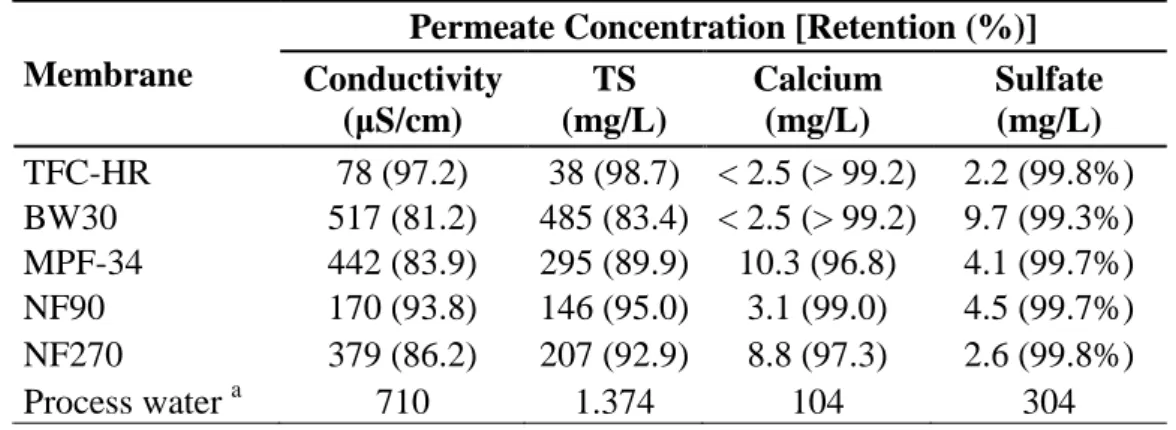
TFC-HR 78 (97.2) 38 (98.7) < 2.5 (> 99.2) 2.2 (99.8%) BW30 517 (81.2) 485 (83.4) < 2.5 (> 99.2) 9.7 (99.3%) MPF-34 442 (83.9) 295 (89.9) 10.3 (96.8) 4.1 (99.7%) NF90 170 (93.8) 146 (95.0) 3.1 (99.0) 4.5 (99.7%) NF270 379 (86.2) 207 (92.9) 8.8 (97.3) 2.6 (99.8%) Process water a 710 1.374 104 304
a
Process water quality
The selection of the most appropriate membrane for a given application should take into consideration both the quality of the final permeate and the average permeate flux, as these factors directly influence the capital and operational costs of the system. The low average permeate flux obtained for the TFC-HR membrane makes it cost-prohibitive for this application, especially since the NF membranes achieved satisfactory pollutant retention for water reuse. The BW30 membrane had low retention efficiency and low average permeate flux, and, consequently, was not suitable for AMD treatment. Among the NF membranes, the NF90 had the highest retention efficiency, while the NF270 had the highest average permeate flux; therefore, these two membranes were the most promising for AMD treatment.
2.3.3 Evaluation of Different Feed pH Values in Nanofiltration
FIGURE 2.2 shows the ratio of permeate flux to pure water flux versus filtration time for the NF90 [FIGURE 2.2(a)] and the NF270 [FIGURE 2.2(b)] membranes. The permeate flux decreased continuously over time with both membranes because of an increase in concentration polarization, pore blocking, and initial fouling formation during filtration. TABLE 2.7 shows the values of membrane resistance and water permeability, as well as permeate flux by pure water flux, permeate flux, and fouling resistance at 40% RR. The different initial permeate fluxes led to different water recovery rates (RR) for each pH tested. Therefore, since permeate flux and fouling resistance are dependent on RR, these results were presented at a fixed RR of 40%.
FIGURE 2.2 – Permeate flux by pure water flux as a function of permeation time and feed pH for membranes a) NF90 and b) NF270
a) b) 50% 60% 70% 80% 90% 100%
0 50 100 150 200 250
P er m ea te f lu x / W at er f lu x Time (min)
3.2 4.2 5.0 5.5 6.0
50% 60% 70% 80% 90% 100%
0 50 100 150 200 250
P er m ea te f lu x / W at er f lu x Time (min)

![FIGURE 2.2 shows the ratio of permeate flux to pure water flux versus filtration time for the NF90 [FIGURE 2.2(a)] and the NF270 [FIGURE 2.2(b)] membranes](https://thumb-eu.123doks.com/thumbv2/123dok_br/15208187.20961/46.892.169.772.458.1072/figure-permeate-water-versus-filtration-figure-figure-membranes.webp)