Genetic structure and conservation of Mountain Lions in the South-Brazilian
Atlantic Rain Forest
Camila S. Castilho
1,2, Luiz G. Marins-Sá
2, Rodrigo C. Benedet
3and Thales R.O. Freitas
1 1Departamento de Genética, Universidade Federal do Rio Grande do Sul, Porto Alegre, RS, Brazil.
2Instituto Serrano de Conservação da Natureza, Urubici, SC, Brazil.
3Projeto Puma, Lages, SC, Brazil.
Abstract
The Brazilian Atlantic Rain Forest, one of the most endangered ecosystems worldwide, is also among the most im-portant hotspots as regards biodiversity. Through intensive logging, the initial area has been reduced to around 12% of its original size. In this study we investigated the genetic variability and structure of the mountain lion,Puma concolor. Using 18 microsatellite loci we analyzed evidence of allele dropout, null alleles and stuttering, calculated the number of allele/locus, PIC, observed and expected heterozygosity, linkage disequilibrium, Hardy-Weinberg
equilibrium,FIS, effective population size and genetic structure (MICROCHECKER, CERVUS, GENEPOP, FSTAT,
ARLEQUIN, ONESAMP, LDNe, PCAGEN, GENECLASS software),we also determine whether there was evidence of a bottleneck (HYBRIDLAB, BOTTLENECK software) that might influence the future viability of the population in south Brazil. 106 alleles were identified, with the number of alleles/locus ranging from 2 to 11. Mean observed heterozygosity, mean number of alleles and polymorphism information content were 0.609, 5.89, and 0.6255, spectively. This population presented evidence of a recent bottleneck and loss of genetic variation. Persistent re-gional poaching constitutes an increasing in the extinction risk.
Key words:Araucaria Forest, Atlantic Rain Forest, conservation, genetic diversity, microsatellite.
Received: April 4, 2011; Accepted: September 14, 2011.
Introduction
The Brazilian Atlantic Rain Forest, one of the four most important biodiversity hotspots worldwide (Myerset al., 2000), is also one of the most endangered ecosystems, through having undergone intense human exploitation and deforestation (Ribeiroet al., 2009). The Araucaria Forest, one of the Atlantic Rain Forest physiognomies in south Brazil, has been heavily logged since the early 1900’s. The whole biome is now legally protected (Federal Law 285/99, February, 2006) Even so, illegal exploitation still persists, and only 11.26% of the original area of the Atlantic Rain Forest itself, and 12.6% of the Araucaria Forest (Ribeiroet al., 2009), still remain. Of this small remnant, only 0.39% of the latter lies within some kind of legally protected area (Ribeiroet al., 2009).
Although almost 90% of the original habitat has dis-appeared in less than a hundred years, little is known on the effects of this fragmentation on animal populations. There are no population estimates prior to deforestation, and even today there are still none for most Brazilian mammals. The
mountain lion (Puma concolor) is a top predator, whose very presence influences the ecosystem, and prey popula-tions, hence the importance of its conservation (Henke and Bryant, 1999; Milleret al., 2001; Terborghet al., 2001).
The mountain lion, the second largest Neotropical felid, occupies the largest geographical area in the Ameri-cas, this extending from Canada to southern Argentina. The subspecies that occurs in southern Brazil isPuma concolor capricornensis(Culveret al., 2000). It is listed as of least concern (IUCN, 2008), and as vulnerable in the Brazilian National Red List (MMA and Fundação Biodiversitas, 2008). Little is known about local populations. Although having suffered severe habitat loss, there is no information regarding population sizes, and only scarce recent data on regional species (Mazzolli et al., 2002; Mazzolli, 2010; Castilhoet al., 2011; and Marins-Sá, 2005, MSc Disserta-tion, Curso de Pós-Graduação em Ecologia UFRGS, Porto Alegre).
In addition to the severe habitat loss, the species is still illegally hunted because of livestock depredation (Mazzolliet al., 2002; Marins-Sá, 2005, MSc Dissertation, Curso de Pós-Graduação em Ecologia UFRGS, Porto Ale-gre), which, in south Brazil, has been reported since the 1990’s (Mazzolliet al., 2002). Depletion very much
de-www.sbg.org.br
Send correspondence to Camila S. Castilho. Departamento de Genética, Universidade Federal do Rio Grande do Sul, Av. Bento Gonçalves 9500, Prédio 43323M, Caixa Postal 15053, 91501-970 Porto Alegre, RS, Brazil. E-mail: [email protected].
creased when ranchers implemented management actions, such as corralling small animals (sheep and goats) at night (Mazzolliet al., 2002).
Previous studies described the genetic variability, and structural and ecological characteristics of mountain lions in North America (Sinclairet al., 2001; Ernestet al., 2003; Anderson et al., 2004; McRae et al., 2005,) and South America (Culveret al., 2000; Morenoet al., 2006; Miotto
et al., 2007; Ruiz-Garciaet al., 2009). However, specific information regarding genetic variability status related to recent specific processes, especially in such an important ecosystem as the Brazilian, is still lacking.
Knowledge of possible recent bottlenecks is ex-tremely important for present-day management strategies. Identification of their very existence, the subsequent loss in genetic diversity, and the prevailing genetic structure, is important for evaluating the extinction risk of a population (Montgomery et al., 2000; Reed and Frankham, 2003; Frankhamet al., 2005; O’Gradyet al., 2008).
Thus, the aim of this study was to determine whether there was a bottleneck that could possibly affect future pop-ulation viability, besides assessing genetic structure, in-breeding and causes of mortality in regional mountain lions. The results would contribute to the conservation and management of both this endangered species and the eco-system itself.
Material and Methods
Sample collection and laboratory procedures
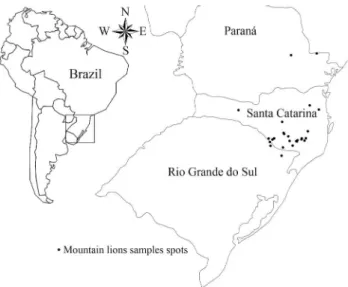
We collected 63 samples of the mountain lion (Puma concolorLinnaeus, 1771) population in southern Brazil, 37 (58.7%) from the field and 26 from museum skins and skulls (41.3%). The samples came from the south Brazilian states of Rio Grande do Sul, Santa Catarina, and Paraná, from 1983 through 2007. Location, year and cause of death/capture were recorded. All the sample locations were recorded (coordinates registered in museum samples, and death/capture location in field samples using GPS) and mapped using TrackMaker (Figure 1). Genomic DNA was extracted using the CTAB protocol (Doyle and Doyle, 1987) for tissue samples, and phenol-chloroform (Sam-brooket al., 1989) for blood samples.
18 loci, four originally designated in Felis catus
(Menotti-Raymondet al., 1999) and 14 inPuma concolor
(Kurushimaet al., 2006; Rodzenet al., 2007), were ampli-fied for subsequent analysis of genetic variability of the wild mountain lion population in south Brazil. Each micro-satellite locus was individually amplified in PCR reactions, according to Castilhoet al., (2011). Allele sizes were de-fined by separating the amplification products on 6% poly-acrylamide gels together with a 25 bp marker ladder. Intron DBY-7 (Luoet al., 2007) was used for sex determination under the same PCR conditions as those for microsatellites.
Samples were genotyped at least twice for validated allele scores.
Data analysis
Genetic polymorphism was estimated as the number of alleles per locus (A), observed heterozygosity (Ho), ex-pected heterozygosity (HE), polymorphic information
con-tent (PIC), and allelic frequencies, using the CERVUS 3.0.3 program (Marshallet al., 1998). GENEPOP 3.3 (Ray-mond and Rousset, 1995) was used for testing linkage dis-equilibrium (LD) and ARLEQUIN 3.1 for checking geno-typic distribution conformance to Hardy-Weinberg equilibrium (HWE).
Significance levels (a= 0.05) were corrected with the
Bonferroni approach for multiple simultaneous compari-sons (Rice, 1989), in order to infer LD and departures from HWE. The probability of the presence of null alleles, allele dropout, and scoring errors due to stutter was tested using MicroChecker 2.2.3 (Van Oosterhoutet al., 2004). Allelic richness (AR) and inbreeding coefficient (FIS) were
calcu-lated with the FSTAT 2.9.3.2 program (Goudet, 2001). In order to detect any genetic evidence of a popula-tion decline, the BOTTLENECK program (Cornuet and Luikart, 1996) was used with the infinite allele (I.A.M.), stepwise mutation (S.M.M.), and two-phase (T.P.M.) mod-els, with 70% t and 95% S.M.M., 20% variance, and 1,000 iterations, as recommended by Piryet al.(1999). The Wil-coxon sign-rank test was applied to determine significance (p£0.05). In order to assess whether the small sample size
(n = 37) was masking the results, HYBRIDLAB 1.0 (Niel-senet al., 2006) was used to simulate a population with 500 individuals, with n = 37 as a base population, and BOTTLENECK run with the same parameters described above.
ware. GENECLASS 2 (Piryet al., 2004) was carried out to infer the assignment or exclusion of individuals, assuming that all those sampled belonged to the same population. The ONESAMP1.1 (Tallmon et al., 2008) and LDNe 1.31 (Waples, 2006) programs were used with genotypic data for estimating the effective population size (Ne).
The probability of loss in a generation of alleles with frequencies from 0.01 to 0.10 was calculated, using Pr (A) = (1 - p)2N, wherepis allele frequency (Frankhamet al., 2005), and considering N as a mean between that calculated by LDNe and ONESAMP. The loss of genetic variation in one generation was also calculated, using the equation He= 1 - 1/(2Ne)t, where Heis the level of heterozygosity, Ne the effective population size, andtthe number of genera-tions (Loweet al., 2004).
Results
DNA extraction was successful for 37 individuals, viz., 28 field samples (25 obtained from poachers, 1 road kill and 2 captured animals) and 9 from museums. DNA ex-traction was a failure in the case of field samples containing excess fat. Sixteen males and 21 females were successfully sexed using intron DBY-7 from the Y chromosome.
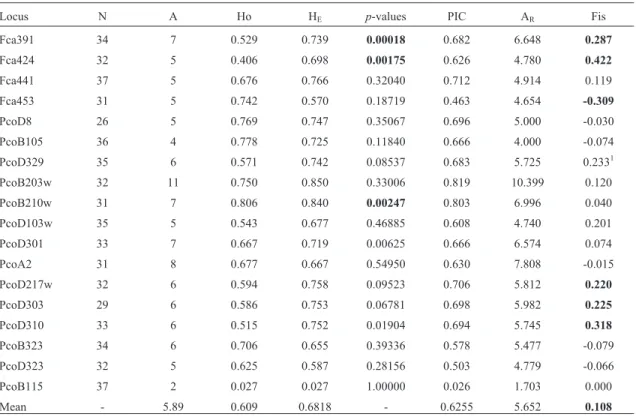
106 alleles were identified for the 18 microsatellite loci in the 37 samples (Table 1). The number of alleles/lo-cus ranged from 2 (PcoB115) to 11 (PcoB203w), with a mean of 5.89. Mean observed heterozygosity (Ho) was 0.609 (ranging from 0.027 to 0.806), and mean expected heterozygosity (HE) 0.6818 (ranging from 0.027 to 0.850)
(Table 1). Polymorphism information content (PIC) for 16 of the 18 loci was higher than 0.5, with only Fca453 and Pco115 lower (0.463 and 0.026 respectively). The mean PIC for all the loci was 0.6255 (Table 1).
Tests showed no loci to be in linkage disequilibrium, although deviation from HWE (p > 0.05 after Bonferroni correction) occurred in three loci, Fca391, Fca424 and PcoB210w (Table 1).FIS, calculated to test whether in-breeding was responsible for deviations from HWE, ranged from -0.30 to 0.42 (meanFIS= 0.10), in the case of global
FIS and seven samples, significantly (Table 1). The FIS
value for sample Fca453 indicated heterozygote excess, and for the remainder, heterozygote deficit. CERVUS failed to find mother/ father – offspring pairs. For more de-tails on parentage relations in this population see Castilho
et al.(2011). MicroChecker results gave no evidence of al-lele dropout or scoring erros due to stuttering, although loci Fca391 and Fca424 presented a general excess of homozy-gotes for most allele-size classes, thereby implying the pos-sible presence of null alleles.
Allelic frequencies varied from 0.013 to 0.986, with 17% at 0.01, and 34% and 46.2% lower than 0.05 and 0.10, respectively. One, at 0.98, was almost fixed in this popula-tion (locus Pco115). Seven alleles (6.6% of the total), ap-parent in samples dating from 1983 to 1995, were absent in the more recent.
Analysis with PCAGEN software (p > 0.05, data not shown) failed to detect a population genetic structure. The results from GENECLASS corroborated this, by indicating that all the individuals came from the same population source (p > 0.05).
Although evidence of a recent bottleneck in this pop-ulation was found, when applying the Wilcoxon sign-rank test using the infinite allele model (I.A.M.) and two-phase model (T.P.M.), with 70% stepwise mutation model (S.M.M.), this was not so with either 95% S.M.M. (p > 0.05) or the stepwise mutation model (S.M.M.) for n = 37 (Table 2). However, when using n = 500 simulated genotypes, a recent bottleneck for I.A.M. and T.P.M. with 70% and 95% S.M.M. was noted (Table 2).
With ONESAMP1.1 (Tallmonet al., 2008), it was es-timated that the effective population size (Ne) was 23.5 (confidence limits 95% = 20.74-31.5), and with LDNe, 16.5. Neas a mean between 23.5 and 16.5 was considered for further calculations.
The high percentage of alleles with allelic frequency of 0.01 (17%), or lower than 0.05 (32.1%) and 0.10 (46.2%), presume the risk of loss in future generations. The probability of future loss of alleles with frequencies from 0.01 to 0.10, considering N = 20.0 (mean between calcula-tions by LDNe and ONESAMP) were 0.67 for alleles with a frequency of 0.01 (17%), and 0.44, 0.30, 0.20, 0.13, and 0.02 for alleles with allelic frequencies of 0.02 (3.8%), 0.03 (7.5%), 0.04 (5.7%), 0.05 (1.9%), and 0.10 (2.82%), re-spectively (Figure 2). It is possible that 6.6% of all the al-leles have already been lost, as they appeared only in samples dating from 1983 through 1995, and not in more recent ones. Using the equation He= 1-1/(2Ne)t, it was cal-culated that, in one generation, an effective population size of 20 individuals loses 0.025% of the variation present in the initial population.
The cause of death was recorded in the case of field samples (71.4% and 81.25% of all the females and males, respectively). The main cause was farmer retaliatory
ing, due to livestock depredation (74% of all deaths, and 92.8% and 53.8% of female and male deaths respectively). Human action was instrumental for 92.86% of all deaths/captures (100% and 84.6% of females and males, re-spectively). Road kills were responsible for 7.2% and 7.7% of female and male deaths, respectively. Only males were captured (23.2%), or killed by disease (15.4%).
Discussion
The absence of genetic structure in the study area cor-roborates data obtained by Castilhoet al.(2011) for this population, in that the surroundings are still permeable for mountain lions, possibly arising from the long distances that this species is capable of traveling (Sweanoret al., 2000; Logan and Sweanor, 2001), even though through
dis-continuous habitats (Logan and Sweanor, 2001; Castilhoet al., 2011). Ruiz-Garciaet al.(2009) found genetic similar-ity among individuals from the Bolivian Andes, and sam-ples from Colombia, Peru, Ecuador, Venezuela, and the west Brazilian Amazon.
Severe habitat loss is one of the major causes of ge-netic loss and extinction risk in animals in general, and car-nivore populations in particular (Nowell and Jackson, 1996). Bottlenecks caused by habitat loss have been re-corded for several species (Hoelzel, 1999; Kuo and Janzen, 2004; Culveret al., 2008), these always indicating the need for attention to the population that has undergone a reduc-tion in size, because of the increased extincreduc-tion risk of both the population or species (Montgomeryet al., 2000; Reed Table 1- Characterization of microsatellites for mountain lions in south Brazil for 18 microsatellite loci. Locus name, number of individuals genotyped (N), number of alleles (A), observed heterozygosity (Ho), expected heterozygosity (HE), HWEP-values, polymorphic information content (PIC), allelic
richness (AR), and inbreeding coefficient (FIS). Bold values: p£0.05 after Bonferroni correction.
Locus N A Ho HE p-values PIC AR Fis
Fca391 34 7 0.529 0.739 0.00018 0.682 6.648 0.287
Fca424 32 5 0.406 0.698 0.00175 0.626 4.780 0.422
Fca441 37 5 0.676 0.766 0.32040 0.712 4.914 0.119
Fca453 31 5 0.742 0.570 0.18719 0.463 4.654 -0.309
PcoD8 26 5 0.769 0.747 0.35067 0.696 5.000 -0.030
PcoB105 36 4 0.778 0.725 0.11840 0.666 4.000 -0.074
PcoD329 35 6 0.571 0.742 0.08537 0.683 5.725 0.2331
PcoB203w 32 11 0.750 0.850 0.33006 0.819 10.399 0.120
PcoB210w 31 7 0.806 0.840 0.00247 0.803 6.996 0.040
PcoD103w 35 5 0.543 0.677 0.46885 0.608 4.740 0.201
PcoD301 33 7 0.667 0.719 0.00625 0.666 6.574 0.074
PcoA2 31 8 0.677 0.667 0.54950 0.630 7.808 -0.015
PcoD217w 32 6 0.594 0.758 0.09523 0.706 5.812 0.220
PcoD303 29 6 0.586 0.753 0.06781 0.698 5.982 0.225
PcoD310 33 6 0.515 0.752 0.01904 0.694 5.745 0.318
PcoB323 34 6 0.706 0.655 0.39336 0.578 5.477 -0.079
PcoD323 32 5 0.625 0.587 0.28156 0.503 4.779 -0.066
PcoB115 37 2 0.027 0.027 1.00000 0.026 1.703 0.000
Mean - 5.89 0.609 0.6818 - 0.6255 5.652 0.108
Table 2-P-values for heterozygosity (H) deficiency and/or excess from Wilcoxon sign-rank test, using the infinite allele model (I.A.M.), stepwise muta-tion model (S.M.M.), and two-phase model (T.P.M.) with 70% and 95% stepwise mutamuta-tion models and 20% variance. Results for n = 37 (field samples) and n = 500 (simulated genotypes). Values in bold face are p£0.05.
n = 37 n = 500
I.A.M T.P.M S.M.M. I.A.M T.P.M. S.M.M.
70% 95% 70% 95%
H deficiency 0.99979 0.95512 0.51694 0.18461 1.0 0.99998 0.99203 0.75246
H excess 0.00026 0.04937 0.50000 0.82673 0.0 0.00003 0.00912 0.26131
and Frankham, 2003; Frankhamet al., 2005; O’Gradyet al., 2008).
Evidently there has been a recent bottleneck in the south Brazilian mountain lion population. The excess of heterozygosity observed when a population has suffered a recent bottleneck can be detected during 0.25 to 2.5 x 2 Ne generations (41 to 412 years forP. concolor), after which allelic frequencies again regain equilibrium. The bottle-neck that was detected in the present study possibly started when intense deforestation occurred in the Araucaria Forest in south Brazil. From the early 1900’s, this has brought about the loss of almost 90% of the original vegetation cover. Concomitantly, in addition to the extensive loss of habitat, many loggers hunted mountain lions and their prey species for food or protection. Although illegal, the hunting of mountain lions and prey species still persists (Mazzolliet al., 2002). A severe decrease in population through human intervention can induce genetic loss (Allendorf et al., 2008). Thus, poaching can be held directly responsible for bottlenecks, and the consequential loss of genetic diversity, in several animal species (Bonnell and Selander 1974; Larson et al., 2002; Culver et al., 2008; Bishop et al., 2009). Furthermore, bottlenecks induce the loss of low-frequency alleles, and, consequentially, of genetic diversity through inbreeding and genetic drift (Allendorf and Lui-kart, 2007), thereby increasing the susceptibility to in-breeding depression effects, such as reproductive and cardiac problems, and epidemic diseases (O’Brien and Evermann, 1988; Roelkeet al., 1993).
Molecular markers show that North American moun-tain lions comprise a large panmictic population, with
re-duced genetic variation compared to the South Americans (Culveret al., 2000). Most likely, the present-day North Americans descended from a founder event involving a small number of individuals that had migrated out of South America approximately 10,000 years ago (Culveret al., 2000). Therefore, higher genetic diversity in southern Bra-zil could be expected, when compared with North Ameri-can studies. However, on comparing genetic diversity found forP. concolorwith that for North American sam-ples (Kurushima et al., 2006; Rodzen et al., 2007) (Table 3), the observed mean number of alleles/locus and the expected heterozygosity estimated in the present study were found to be lower, when using the same spe-cies-specific primers (n = 243 individuals from California and Nevada, and n = 23-25 individuals from California) (Kurushimaet al., 2006; Rodzenet al., 2007).
Furthermore, diversity in individuals from south Bra-zil was lower than that found for previously analyzed South American mountain-lion populations (Table 4). The pres-ent results cannot be directly compared to other studies in South America, since different sets of microsatellites were used by all. Even so, by using species-specific primers, higher heterozygosity could be expected. Diversity in the individuals from south Brazil was lower than that indicated for other previously analyzed South-Americans. The mean number of alleles/locus was lower in the former than the latter, except when compared with São Paulo and Bolivian samples. Mean heterozygosity was also lower, except when compared with Bolivian samples, although this may have been due to the small number of samples used (9 and 8 indi-viduals respectively) (Miottoet al., 2007; Ruiz-Garcia et
Table 3- Mean observed and expected heterozygosity and alleles/locus for 14 species-specific loci used in this study, and in two others (Kurushimaet al., 20061; Rodzenet al., 20072), using samples from North American mountain lion individuals.
Ho HE Alleles
This study Kurushimaet al.2006 Rodzenet al.2007
This study Kurushimaet al.2006 Rodzenet al.2007
This study Kurushimaet al.2006 Rodzenet al.2007
PcoD82 0.769 0.79 0.747 0.83 5 8
PcoB1052 0.778 1.00 0.725 0.74 4 7
PcoD3292 0.571 0.71 0.742 0.77 6 8
PcoB203w1 0.750 0.46 0.850 0.57 11 7
PcoB210w1 0.806 0.62 0.840 0.74 7 7
PcoD103w1 0.543 0.58 0.677 0.71 5 6
PcoD3012 0.667 0.58 0.719 0.78 7 7
PcoA22 0.677 0.76 0.667 0.68 8 6
PcoD217w1 0.594 0.45 0.758 0.59 6 5
PcoD3032 0.586 0.67 0.753 0.68 6 4
PcoD3102 0.515 0.5 0.752 0.62 6 5
PcoB3232 0.706 0.71 0.655 0.69 6 5
PcoD3232 0.625 0.33 0.587 0.57 5 5
PcoB1152 0.027 0.75 0.027 0.67 2 5
al., 2009). This appears to indicate a loss of genetic diver-sity in south Brazilian mountain lion populations.
According to evident inbreeding and the estimated global value, this population may be in the process of losing genetic variability. Both estimates of effective population size were lower than Ne= 50, the number necessary for di-minishing the loss of genetic diversity by inbreeding (Sou-lé, 1980), and Ne = 500, the number necessary for preventing long-term loss of variability by genetic drift (Franklin, 1980; Frankel and Soulé, 1981). This observed loss of genetic diversity is probably a consequence of the recent bottleneck this population apparently underwent. On increasing, with inbreeding and low Ne, this loss can lead to reduced adaptive potential and increased inbreeding de-pression, with vulnerability to environmental, demographic and stochastic variation, and a consequential increase in the probability of extinction (Reed and Frankham, 2003; Spiel-manet al., 2004; Frankhamet al., 2005). Inbreeding may also affect both individual and population performances (Keller and Waller, 2002).
Conserving Brazilian mountain lions
As carnivores exert considerable influence on ecosys-tems and the maintenance of their ecological processes (Henke and Bryant, 1999; Milleret al., 2001; Terborghet al., 2001; Rayet al., 2005), environments where mountain lions have disappeared through human presence and inter-vention manifest decreased biodiversity (Ripple and Beschta, 2006). Carnivores in general are secretive and
nocturnal, comprise small populations, and are frequently endangered. These characteristics, although making it diffi-cult to study them, increase the need for further informa-tion, thereby making conservation genetics an essential tool for the purpose. Little is known on mountain lion genetic variability in south Brazil, this constituting a crucial item for both understanding the evolutionary potential of the population and for determining the best strategy for their conservation and management.
A recent bottleneck and loss of genetic diversity were identified in this population. As it is well-known that a de-crease in population size and the consequential loss of ge-netic diversity increase the risk of extinction (Hoelzel, 1999; Dalénet al., 2006; Hájkováet al., 2007; Culveret al., 2008), special attention should be dedicated to conserva-tion acconserva-tion, in order to reduce the risk in this case.
Apart from human persecution induced by financial loss, poaching and human exploitation are the major causes of death in carnivores (Nowell and Jackson, 1996). Al-though hunting is illegal in Brazil, it still occurs in many ar-eas, including in the southern part of the country. In the studied samples, human action was responsible for 92.86% of all the deaths/captures (100% and 84.6% of females and males, respectively), 74% the result of poaching. Although this high percentage may be owing to the sampling method employed, obviously it still indicates the importance of the impact in the area. Weaveret al.(1996) found that 75% of all mountain lion deaths in North America were caused by human persecution, and Morrison and Boyle (2009) that Table 4- Genetic diversity estimates in mountain lions in South and North American populations. N = number of individuals, L = number of loci ana-lyzed.
Continent/Country/State/Region N L Mean number alleles/locus Mean heterozygosity Reference
North America
Utah 50 9 4.44 0.653 Sinclairet al., 2001
California 431 12 4.4 0.44 Ernestet al., 2003
Colorado, Wyoming, South Dakota 312 9 4 0.535 Andersonet al., 2004
Utah, Colorado, Arizona, New Mexico 540 16 3.25-5.06 0.52-0.63 McRaeet al., 2005
South América (SA)
East1SA 22 10 8.6 0.71 Culveret al., 2000
North SA 25 10 9.1 0.75 Culveret al., 2000
Central SA 17 10 6.7 0.75 Culveret al., 2000
South SA 22 10 6.0 0.64 Culveret al., 2000
Bolivia – Andes 8 7 3.857 0.592 Ruiz-Garciaet al., 2009
Colombia, Peru, Ecuador, Venezuela, and western Brazilian Amazon
45 7 11 0.629 Ruiz-Garciaet al., 2009
Brazil – MG, GO, SC, PR, SP 182 4 9.25 - Morenoet al., 2006
Brazil – SP 9 4 4 - Miottoet al., 2007
Brazil – RS, SC, PR 37 183 5.98 0.609 This study
Brazilian state abbreviations: MG = Minas Gerais, GO = Goiás, SC = Santa Catarina, PR = Paraná, SP = São Paulo, RS = Rio Grande do Sul.
1This region corresponds to the distribution of the subspecies
Puma concolor capricornensis.
2
Samples from captive individuals.
50% were by direct human action. Poaching also caused a general decline in the mammal population of the Atlantic Rain Forest (Cullenet al., 2000; Pavioloet al., 2008, 2009). The population in south Brazil is, without doubt, still prone to poaching and persecution by way of farmer retaliatory hunting (Mazzolliet al., 2002; Marins-Sá, 2005, MSc Dis-sertation, Curso de Pós-Graduação em Ecologia UFRGS, Porto Alegre), and although the observed bottleneck was probably caused by intense deforestation and habitat loss, it is currently believed that illegal poaching poses the largest local threat. Since this population has undergone a recent and intense reduction in size (identified by the evident bot-tleneck), with the consequentially low effective population size and decrease in genetic diversity, poaching will proba-bly further increase the risk of extinction.
Conservation efforts may focus on the population level, instead of the species (Garneret al., 2005), since ex-tinction rates for populations are estimated to be three to eight times higher than for species (Hugheset al., 1997). ForP. concolor, a species that has a geographically diversi-fied environment and various subspecies (Culver et al., 2000), as well as manifold genetic diversity across its range, and a variable intensity of threats, the best conserva-tion strategy could be to develop regional conservaconserva-tion plans according to the identified threats for each region. Therefore, it is believed that mountain lion conservation ef-forts in south Brazil should be directed towards mitigating human-versus-predator conflicts due to livestock depreda-tion, since this appears to be a grave threat and the principal cause of mountain lion deaths in the area nowadays. Mazzolliet al.(2002), when studying the causes of moun-tain lion depredation in south Brazil, observed that ranches without management plans lost as much as 78% of the goats and 84% of the sheep, whereas losses were substantially re-duced if the herds were corralled at night. The authors ob-served that mountain lions often killed several free-ranging sheep or goats in a single attack, but would take only a sin-gle animal from a corral, thereby indicating that ranchers that have introduced management plans for their livestock are prone to few or no losses to mountain lions, thus imply-ing that less conflict is possible with rancher cooperation. Furthermore, education programs should be intensified, with a focus on local populations and farmers, and genetic monitoring programs, implemented for surveying the fluc-tuation of genetic variability, since there are indications of an imminent loss in coming generations.
Acknowledgments
The authors thank the LAMAQ/UFSC and Capão da Imbuia museums, M. Mazzolli, P.W.V. Castilho, M. Grai-pel, S. Althoff, A. Fillippini, M. M. Mendoça, I. Croda, W. Veronezi, C. Silveira, T. C. Margarido, R. Von Hohen-dorff, M.E. Saito, landowners, and partners of the project for help in sample collecting. We also thank the staffs of the São Joaquim National Park/ICMBio and the Instituto
Ser-rano de Conservação da Natureza-ISCN for technical and logistical support. We are grateful to Martha T.B. Wallauer and Jordan P. Wallauer for technical assistance, as also to P. Estrela, G.L. Gonçalves, C.M. Lopes, G.P. Fernández, E. Eizirik, P.G. Crawshaw Junior, R. Hoelzel, and anonymous reviewers for suggestions on earlier versions of this manu-script. This research was financially supported by the Con-selho Nacional de Pesquisa (CNPq) and the Fundação de Amparo à Pesquisa do Rio Grande do Sul (FAPERGS).
References
Allendorf FW and Luikart G (2007) Conservation and the Genet-ics of Populations. Blackwell Publishing, Oxford, 642 pp. Allendorf FW, England PR, Luikart G, Ritchie PA and Ryman N
(2008) Genetic effects of harvest on wild animal popula-tions. Trends Ecol Evol 23:327-337.
Anderson CR, Lindzey FG and McDonald DB (2004) Genetic structure of cougar populations across the Wyoming Basin: Metapopulation or megapopulation. J Mamm 85:1207-1214.
Bishop JM, Leslie AJ, Bourquin SL and O’Ryan C (2009) Re-duced effective population size in an overexploited popula-tion of the Nile crocodile (Crocodylus niloticus). Biol Conserv 142:2335-2341.
Bonnell ML and Selander RK (1974) Elephant Seals: Genetic variation and near extinction. Science 184:908-909. Castilho CS, Marins-Sá LG, Benedet RC and Freitas TRO (2011)
Landscape genetics of mountain lions (Puma concolor) in southern Brazil. Mamm Biol 76:476-483.
Cornuet JM and Luikart G (1996) Description and power analysis of two tests for detecting recent population bottlenecks from allele frequency data. Genetics 144:2001-2014.
Cullen L, Bodmer RE and Valladares-Padua C (2000) Effects of hunting in habitat fragments of the Atlantic forests, Brazil. Biol Conserv 95:49-56.
Culver M, Johnson WE, Pecon-Slattery J and O’Brien SJ (2000) Genomic ancestry of the American puma (Puma concolor). J Hered 91:186-197.
Culver M, Hedrick PW, Murphy K, O’Brien S and Hornocker MG (2008) Estimation of the bottleneck size in Florida panthers. Anim Conserv 11:104-110.
Dalén L, Kvaloy K, Linnell JDC, Elmhagen B, Strand O, Tanner-feldt M, Henttonen H, Fuglei E, Landa A and Angerbjörn A (2006) Population structure in a critically endangered arctic fox population: Does genetics matter? Mol Ecol 15:2809-2819.
Doyle JJ and Doyle JL (1987) A rapid isolation procedure for small quantities of fresh leaf tissue. Phytochem Bull 9:11-15.
Ernest HB, Boyce WM, Bleich VC, May BP, Stiver SJ and Torres SG (2003) Genetic structure of mountain lion (Puma concolor) populations in California. Conserv Genet 4:353-366.
Frankel OH and Soulé ME (1981) Conservation and Evolution. Cambridge University Press, Cambridge, 327 pp.
Franklin IR (1980) Evolutionary change in small populations. In: Soulé ME and Wilcox BA (eds) Conservation Biology: An Evolutionary-Ecological Perspective. Sinauer, Sunderland, pp 135-150.
Garner A, Rachlow JL and Hicks JF (2005) Patterns of genetic di-versity and its loss in mammalian populations. Conserv Biol 19:1215-1221.
Goudet J (2001) FSTAT, a program to estimate and test gene di-versities and fixation indices ver. 2.9.3. Available from http://www.unil.ch/izea/softwares/fstat.html. Updated from Goudet J (1995) FSTAT v-1.2. A computer program to cal-culate F-statistics. J Hered 86:485-486.
Hájková P, Pertoldi C, Zemanová B, Roche K, Hájek B, Bryja J and Zima J (2007) Genetic structure and evidence for recent population decline in Eurasian otter populations in the Czech and Slovak Republics: Implications for conservation. J Zool 272:1-9.
Henke SE and Bryant FC (1999) Effects of coyote removal on the faunal community in western Texas. J Wildl Manage 63:1066-1081.
Hoelzel AR (1999) Impact of population bottlenecks on genetic variation and the importance of life-history, a case study of the northern elephant seal. Biol J Linnean Soc 68:23-39. Hughes JB, Daily GC and Ehrlich PR (1997) Population diversity:
Its extent and extinction. Science 278:689-692.
Kuo C and Janzen FJ (2004) Genetic effects of a persistent bottle-neck on a natural population of ornate box turtlesTerrapene ornate. Conserv Genet 5:425-437.
Kurushima JD, Collins JA, Well JA and Ernest HB (2006) Devel-opment of 21 microsatellite loci for puma (Puma concolor) ecology and forensics. Mol Ecol Notes 6:1260-1262. Larson S, Jameson R, Bodkin J, Staedler M and Bentzen P (2002)
Microsatellite DNA and mitochondrial DNA variation in remnant and translocated sea otter (Enhydra lutris) popula-tions. J Mamm 83:893-906
Logan KA and Sweanor LL (2001) Desert Puma: Evolutionary Ecology and Conservation of an Enduring Carnivore. Island Press, Washington DC, 463 pp.
Lowe A, Stephen H and Ashton P (2004) Ecological Genetics: Design, Analysis, and Application. Blackwell Publications, Oxford, 326 pp.
Luo SJ, Johnson WE, David VA, Menotti-Raymond M, Stanyon R, Cai QX, Beck T, Yuhki N, Pecon-Slattery J, Smith JLD,
et al.(2007) Development of Y chromosome intraspecific polymorphic markers in the Felidae. J Hered 98:400-413. Marshall TC, Slate J, Kruuk LEB and Pemberton JM (1998)
Sta-tistical confidence for likelihood-based paternity inference in natural populations. Mol Ecol 7:639-655.
Mazzolli M, Graipel ME and Dunstone N (2002) Mountain lion depredation in southern Brazil. Biol Cons 105:43-51. Mazzolli M (2010) Mosaics of exotic forest plantations and native
forests as habitat of pumas. Environ Manage 46:237-253. McRae BH, Beier P, Dewald LE, Huynh Y and Keim P (2005)
Habitat barriers limit gene flow and illuminate historical events in a wide-ranging carnivore, the American puma. Mol Ecol 14:1965-1977.
Menotti-Raymond M, David VA, Lyons LA, Schaffer AA, Tomlin JF, Hutton MK and O’Brien SJ (1999) A genetic linkage map of microsatellites in the domestic cat (Felis catus). Genomics 57:9-23.
Miller B, Dugelby B, Foreman D, Del Rio CM, Noss R, Phillips M, Reading R, Soulé ME, Terborgh J and Willicox L (2001) The importance of large carnivores to healthy ecosystems. Endangered Species Update 18:202-210.
Miotto RA, Rodrigues FP, Ciocheti G and Galetti PM (2007) De-termination of the minimum population size of pumas (Puma concolor) through fecal DNA analysis in two pro-tected Cerrado areas in the Brazilian southeast. Biotropica 39:647-654.
Moreno VR, Grisolia AB, Campagnari F, Milazzotto M, Adania CH, Garcia JF and Souza EB (2006) Genetic variability of
Herpailurus yagouaroundi, Puma concolorand Panthera onca(Mammalia, Felidae) studied usingFelis catus micro-satellites. Genet Mol Biol 29:290-293.
Morrison AS and Boyle WM (2009) Conserving connectivity: Some lessons from mountain lions in southern California. Conserv Biol 23:275-285.
MMA and Fundação Biodiversitas (2008) Livro Vermelho da Fauna Brasileira Ameaçada de Extinção. MMA, Belo Hori-zonte, 1420 pp.
Montgomery ME, Woodworth LM, Nurthen RK, Gilligan DM, Briscoe DA and Frankham R (2000) Relationships between population size and loss of genetic diversity: Comparisons of experimental result with theoretical predictions. Conserv Genet 1:33-43.
Myers N, Mittermeier RA, Mittermeier CG, Fonseca GAB and Kent J (2000) Biodiversity hotspots for conservation priori-ties. Nature 403:853-858.
Nielsen AEG, Bach LA and Kotlicki P (2006) Hybridlab ver. 1.0: A program for generating simulated hybrids from popula-tion samples. Mol Ecol Notes 6:971-973.
Nowell K and Jackson P (1996) Wild Cats: Status, Survey and Conservation Action Plan. IUCN, Gland, 382 pp.
O’Brien SJ and Evermann JF (1988) Interactive influence of in-fectious disease and genetic diversity in natural populations. Tree 3:254-259.
O’Grady JJ, Reed DH, Brook BW and Frankham R (2008) Extinc-tion risk scales better to generaExtinc-tions than to years. Anim Conserv 11:442-451.
Paviolo A, De Angelo CD, Di Blanco YE and Di Bitetti MS (2008) JaguarPanthera oncapopulation decline in the Up-per Paraná Atlantic Forest of Argentina. Oryx 42:554-561. Paviolo A, Di Blanco YE, De Angelo CD and Di Bitetti MS
(2009) Protection affects the abundance and activity patters of pumas in the Atlantic Forest. J Mamm 90:926-934. Piry S, Luikart G and Cornuet JM (1999) Bottleneck: A computer
program for detecting recent reductions in the effective pop-ulation size using allele frequency data. J Hered 90:502-503. Piry S, Alapetite A, Cornuet JM, Paetkau D, Baudouin L and Estoup A (2004) GeneClass2: A software for genetic assign-ment and first-generation migrant detection. J Hered 95:536-539.
Ray JC, Redford KH, Steneck RS and Berger J (2005) Large car-nivores and the conservation of biodiversity. Island Press, Washington DC, 526 pp.
Raymond M and Rousset F (1995) GENEPOP ver.1.2. Population genetics software for exact test ecumenism. J Hered 86:248-249.
Ribeiro MC, Metzger JP, Martensen AC, Ponzoni FG and Hirota MM (2009) The Brazilian Atlantic Forest: How much is left, and how is the remaining forest distributed? Implications for conservation. Biol Conserv 142:1141-1153.
Rice WR (1989) Analyzing tables of statistical tests. Evolution 43:223-225.
Ripple WJ and Beschta RL (2006) Linking a cougar decline, trophic cascade, and catastrophic regime shift in Zion Na-tional Park. Biol Conserv 133:397-408.
Rodzen JA, Banks JD, Meredith EP and Jones KC (2007) Charac-terization of 37 microsatellite loci in mountain lions (Puma concolor) for use in forensic and population applications. Conserv Genet 8:1239-1241.
Roelke ME, Martenson JS and O’Brien SJ (1993) The conse-quences of demographic reduction and genetic depletion in the endangered Florida panther. Curr Biol 3:340-350.
Ruiz-Garcia M, Pacheco LF and Alvarez D (2009) Caracteri-zación genética del puma andino boliviano (Puma concolor) en el Parque Nacional Sajama (PNS) y relaciones con otras poblaciones de puma del noroccidente de Sudamérica. Rev Chil Hist Nat 82:97-117.
Sambrook JE, Fritsch F and Maniatis T (1989) Molecular Clon-ing: A Laboratory Manual. 2nd edition. Cold Spring Harbor Press, Cold Spring Harbor.
Sinclair EA, Swenson EL, Wolfe ML, Choate DC, Bates B and Crandall KA (2001) Gene flow estimates in Utah’s cougars implies management beyond Utah. Anim Conserv 4:257-264.
Soulé ME (1980) Thresholds for survival: Maintaining fitness and evolutionary potential. In: Soulé ME and Wilcox BA (eds) Conservation Biology: An Evolutionary-Ecological Per-spective. Sinauer, Sunderland, pp 151-170.
Spielman D, Brook DW and Frankham R (2004) Most species are not driven to extinction before genetic factors impact them. Proc Natl Acad Sci USA 101:15261-15264.
Sweanor LL, Logan KA and Hornocker MG (2000) Cougar dis-persal patterns, metapopulation dynamics and conservation. Conserv Biol 14:798-808.
Tallmon DA, Koyuk A, Luikart GH and Beaumont MA (2008) ONeSAMP: A program to estimate effective population size using approximate Bayesian computation. Mol Ecol Resour 8 299-301.
Terborgh J, Lopez L, Nuñez P, Rao M, Shahabudin G, Orihuela G, Riveros M, Ascanio R, Adler GH, Lambert TD,et al.(2001) Ecological meltdown in predator-free forest fragments. Sci-ence 294:1923.
Van Oosterhout C, Hutchinson WF, Wills DPM and Shipley P (2004) MICRO-CHECKER: Software for identifying and correcting genotyping errors in microsatellite data. Mol Ecol Notes 4:535-538.
Waples RS (2006) A bias correction for estimates of effective population size based on linkage disequilibrium at unlinked gene loci. Conserv Genet 7:167-184.
Weaver JL, Paquet PC and Ruggiero LF (1996) Resilience and conservation of large carnivores in the Rocky Mountains. Conserv Biol 10:964-976.
Internet Resources
IUCN (2008) IUCN Red List of Threatened Species, http://www.iucnredlist.org (April, 2009).
PCAGEN Software, http://www.unil.ch/izea/soft-wares/pcagen.html (August 4, 2010).
Associate Editor: Fabrício Santos