1 Recebido para publicação em 30.1.2015 e aprovado em 17.3.2015.
2 Universidade Federal do Amazonas, Manaus-AM, Brasil, <lucisouza@ufam.edu.br>.
V
ARIABILITY ANDG
ENETICS
TRUCTURE INP
OPULATIONS OFArrabidaea bilabiata
(S
PRAGUE) S
ANDWITH IN THEA
MAZONASS
TATE1Variabilidade e Estrutura Genética em Populações de
Arrabidaea bilabiata
(Sprague) Sandwith
no Estado do Amazonas
SOUZA, L.S.A.2, SILVA, J.F.2, LOPES, M.T.G.2, BENTES, J.L.S.2, VALENTE, M.S.F.2, and
COSTA NETO, P.Q.2
ABSTRACT - Weeds in pastures can intoxicate animals, and Arrabidaea bilabiata is the most important species for herbivores in floodplain areas in the Amazon Basin. Genetic diversity studies in natural populations may contribute to the better understanding of the range of toxicity and the genetic variability organization in this species. The objective of this study was to assess the variability and genetic structure in six populations of A.bilabiata sampled in floodplain areas in three municipalities of the Amazonas State, from the AFLP markers analysis. AFLP markers were efficient to characterize the genetic variability of the 65 individuals analyzed. From four combinations of oligonucleotides, a total of 309 AFLP fragments was obtained, where 304 (98.38%) were polymorphic. By the dendrogram and Bayesian cluster analysis, there was a formation of two isolated groups, the first one comprising individuals from Autazes municipality and the second one comprising individuals from Itacoatiara and Parintins. However, depending on the method to define the most probable cluster number, there was a separation of the six populations, according to their geographical origin. Mantel test confirmed that geographically closer populations are more akin, although low gene flow (0.538) is observed among the sampled populations. The molecular analysis of variance found that 49.29% of the genetic variability are among individuals inside populations and 50.71% among the populations analyzed. The results indicate the possibility that isolated A.bilabiata populations contain plants with different toxicity levels and suggest a strong adaptability of the species.
Keywords: Arrabidaea bilabiata, pasture weeds, poisonous plants, AFLP, genetic diversity.
RESUMO - Plantas daninhas de pastagens podem causar intoxicações aos animais, sendo a espécie Arrabidaea bilabiata a mais importante para herbívoros nas regiões de várzea da Bacia Amazônica.
Estudos de diversidade genética em populações naturais podem contribuir para o melhor entendimento sobre a variação de toxicidade e a organização da variabilidade genética na espécie. O objetivo deste trabalho foi avaliar a variabilidade e estrutura genética em seis populações de A. bilabiata coletadas
em áreas de várzea de três municípios do Estado do Amazonas, a partir da análise de marcadores AFLP. Esses marcadores foram eficientes para caracterizar a variabilidade genética nos 65 indivíduos analisados. A partir de quatro combinações de oligonucleotídeos, um total de 309 fragmentos de AFLP foram obtidos, sendo, destes, 304 (98,38%) polimórficos. Pelo dendrograma e a análise bayesiana de agrupamento, houve formação de dois grupos isolados: o primeiro foi formado por indivíduos do município de Autazes, e o segundo, por indivíduos de Itacoatiara e Parintins. Contudo, dependendo do método de definição do número mais provável de agrupamentos, houve separação das seis populações de acordo com a origem geográfica. O teste de Mantel confirmou que populações mais próximas geograficamente são mais similares, apesar de baixo fluxo gênico (0,538) ser verificado entre as populações amostradas. A análise de variância molecular concluiu que 49,29% da variabilidade genética encontra-se entre indivíduos dentro das populações e 50,71% entre as populações analisadas. Os resultados indicam a possibilidade de que populações isoladas de A.bilabiata contenham
plantas com níveis diferenciados de toxicidade e sugerem forte adaptabilidade da espécie.
INTRODUCTION
The poisoning by toxic plants is common in pastures, especially in northern Brazil, where these plants are responsible for the death of adult bovine animals (Tokarnia, 2007). In addition to the financial loss to livestock, another important issue is the use of parts or by-products of intoxicated animal, constituting a potential risk to human health. Research suggests that toxins can be transferred to humans by means of the ingestion of products such as meat, milk and offal of intoxicated animals (Riet-Correa & Medeiros, 2001). This is more serious in the Brazilian state of Amazonas, where it is common for affected animals to have “sudden death” and be slaughtered and their meat sold.
Arrabidaea bilabiata, known as “gibata” or “chibata” is a resistant weed, adapted to various environmental conditions; it is the most important toxic plant for herbivores in the Amazon River floodplain areas. The species causes “sudden death” in cattle (Tokarnia et al., 2004; Jabour et al., 2006) and is referred to as a medicinal plant with antidiarrheal and aphrodisiac uses and in improving overall health in Venezuela and Suriname (van Andel & Havinga, 2008).
The first reports of toxic principles in A. bilabiata referred to the presence o f c a r d i o a c t i v e s t e r o i d s , a n d l a t e r monofluoracetic acid was identified in this species (Riet-Correa & Medeiros, 2001). There are indications that the origin of the plant can influence the toxicity (Jabour et al., 2006), but no study was conducted to confirm the change of toxicity due to environmental factors or a possible difference in toxicity due to the genetic variability among plant populations from different areas. Exsiccated specimens deposited in the “Missouri Botanical Gardens” mention samples of the species in Bolivia, Brazil (Acre, Amapá, Amazonas, Pará and Roraima), Colombia, French Guiana, Guyana, Peru, Suriname and Venezuela.
In the Amazon, floodplains are traditionally used for animal grazing and constantly suffer disturbances that alter the selection pressure in the plant community present in this ecosystem. Cultural practices and seasonal flooding due to overflowing rivers are factors
that can change the genetic variability in existing populations of A. bilabiata in the region. In addition, little is known about the biology of the species. Studies on genetic diversity in natural populations may contribute to a better understanding of the variation in toxicity among plants (Tokarnia et al., 2007) and the organization of the genetic variability in the species, which was an important step for the tillage and approaches that are specific for control, their genetic conservation and improvement works (Setotaw et al., 2010
)
An efficient way to access the genetic variability among individuals and/or populations is by using molecular genetic markers. Among the markers used in genetic diversity studies, Amplified fragment length polymorphism (AFLP) is highlighted, which does not require the use of probes or genomic libraries and can be used for any species in which there is no previous genetic information (Bonin et al., 2007), similar to A. bilabiata.
AFLP markers have been used to study gene flow, population structure, genetic mapping, ploidy level and genetic diversity in several weed species (Slotta, 2008). As examples of weeds that have had part of their genetic variability accessed by AFLP markers, it is possible to mention jointed goatgrass (Aegilops cylindrica) (Pester et al., 2003), proso millet (Panicum miliaceum) (Karan et al., 2004) and Veronica hederifolia ivy-leaved Speedwell (Veronica hederifolia) (Wu et al., 2010).
Research currently conducted on
A. bilabiata primarily assesses the lethal doses and symptoms of intoxication in different animal species such as rabbits, buffalo and cattle (Ortiz, 2004; Tokarnia et al., 2004; Jabour et al., 2006). There is a need for more accurate studies on possible genetic differences among geographically separated populations, helping to combat poisoning, in the control methods and in the discovery of possible chemical compounds with biotechnological potential.
Brazilian State of Amazonas, from the AFLP markers analysis.
MATERIALS AND METHODS
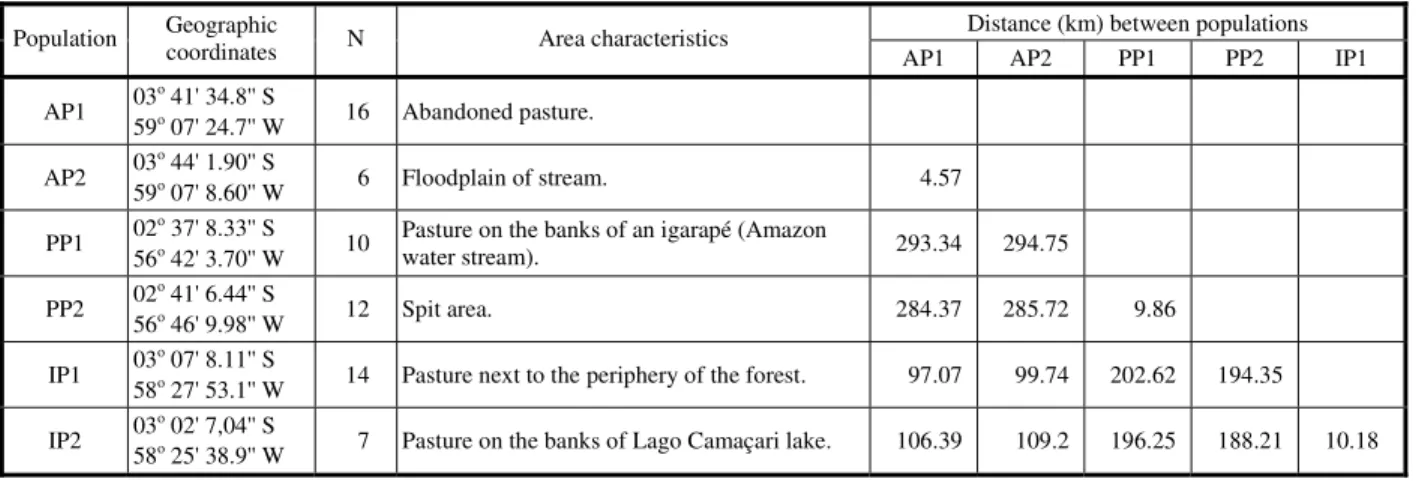
Data collection was conducted in two natural populations of A. bilabiata located in three municipalities in the Brazilian State of Amazonas, totaling 65 individuals. Two populations were sampled in each city: Autazes (AP1 and AP2), Parintins (PP1 and PP2) and Itacoatiara (IP1 and IP2) (Table 1). The leaves sampled were in an intermediate age, with green color and less rigidity than the mature leaves. The sampled material was georeferenced and stored in plastic bags containing silica gel for subsequent DNA extraction.
The DNA extraction was performed using the cationic detergent CTAB 2% (Cationic Hexadecyltrimethyl Ammonium Bromide) (Doyle & Doyle, 1987), following the protocol optimized by Hoisington et al. (1994).
Quantification of DNA was done by the comparative method in 1% agarose gel using markers with known molecular weight (50 to 100 ng). The agarose gel was stained with ethidium bromide and visualized by UV transilluminator.
For DNA digestion reactions, the combination of restriction enzymes EcoRI/ MseI was used with 200 ng of genomic DNA, 5.0 µL of buffer One Phor All 10X (OPA;
Amersham), 0.5 µL of BSA solution (bovine
serum albumin) (10 µg µL-1), 0.5 µL of enzyme
MseI (10 units/µL, New England Biolabs) and
0.4 µL of enzyme EcoRI (12 units/µL, Gibco) in
a final volume of 50 µL. The reactions were
carried at 37 oC for three hours, followed by enzyme inactivation at 70 oC for 15 minutes.
For preamplification reactions, primers complementary to the sequences of restriction enzyme sites were used with a selective nucleotide, where a primer combination E+A/M+C was used. Preamplification products were diluted by adding 40 µL of ultrapure water
(“UPW” or “high-purity water”).
In selective amplification, four combinations of primers were used: EcoRI-AAC/MseI-CAC, EcoRI-AGC/MseI-CAT, EcoRI-ATC/MseI-CGC and EcoRI-AGT/ MseI-CCA. Primers with the highest number of polymorphic loci were amplified in all individuals of the populations. For the amplification reactions via PCR (Polymerase Chain Reaction), 2.5 µL of the preamplification
product were used, diluted in the thermal cycler (also known as a thermocycler, PCR machine or DNA amplifier) (Techine TC-512). After application of the samples, electrophoresis was performed under constant power of 50 W, with about four hours of racing.
In the disclosure of the gel, the method of staining with silver nitrate was used, according to the protocol proposed by Creste et al. (2001). The polymorphic loci were analyzed for presence/absence of the amplified fragment.
Table 1 - Characterization of the populations of Arrabidaea bilabiata for geographical position, individuals sampling number (N), sampling area characteristics and distances among populations
Distance (km) between populations Population Geographic coordinates N Area characteristics
AP1 AP2 PP1 PP2 IP1
AP1 03
o
41' 34.8'' S
59o 07' 24.7'' W 16 Abandoned pasture.
AP2 03
o 44' 1.90'' S
59o 07' 8.60'' W 6 Floodplain of stream. 4.57
PP1 02
o 37' 8.33'' S
56o 42' 3.70'' W 10
Pasture on the banks of an igarapé (Amazon
water stream). 293.34 294.75
PP2 02
o 41' 6.44'' S
56o 46' 9.98'' W 12 Spit area. 284.37 285.72 9.86
IP1 03
o 07' 8.11'' S
58o 27' 53.1'' W 14 Pasture next to the periphery of the forest. 97.07 99.74 202.62 194.35
IP2 03
o 02' 7,04'' S
From the fragments obtained, a binary matrix was constructed, where 0 and 1 indicate the absence and presence of fragments, respectively. The data obtained were used to construct a matrix of genetic distances among individuals, based on Jaccard similarity coefficient and among populations from Masatoshi Nei’s corrected standard genetic distance (Nei, 1978).
For visualization of the genetic differentiation among the individuals of A. bilabiata, a UPGMA-type (Unweighted Pair Group Method using Arithmetical Averages) dendrogram by cluster analysis was constructed, with the aid of the R (R Development Core Team, 2013) statistical software. The adequacy of the cluster analysis to the original data was assessed by the cophenetic correlation coefficient proposed by Sokal & Rohlf (1962). The definition of the clusters was done by the pvclust package (Suzuki & Shimodaira, 2006) of the R software. The pvclust indicates how strongly the cluster is supported by the data based on P-values, which are calculated by a multiscale bootstrap resampling. For the clusters were considered only those with P-values greater than 95%.
Nei’s corrected standard genetic distance (1978) and gene flow among the populations were estimated by software Popgene version 1.32 (Yeh et al., 1999). Additional analyzes have included the percentage of polymorphic loci, the observed number of alleles, Nei’s genetic diversity index (H) (Nei, 1973) and Shannon information index (I) (Lewontin, 1972).
Structure v. 2.4. software (Pritchard et al., 2000) was used to assign subjects to a K number of clusters based on a Bayesian approach. The number of iterations used in burn-in and MCMC (Markov Chain Monte Carlo) was 50,000 and 100,000, respectively. To perform the analyses, the mixture model with correlated frequency and clustering (K) values were considered, ranging from 1 to 8, with five repetitions for each tested K value. The determination of the most likely K value was taken according to the ΔK criterion
described by Evanno et al. (2005) from the Structure Harvester software (Earl & Vonholdt, 2011) and the IPlateau method described by Viana et al. (2013). The graphical visualization
of the association coefficients for genotypes was generated by the Distruct software (Rosenberg, 2003), using the repetition that provided the greatest value of the likelihood function logarithm.
The distribution of the genetic variation among and within populations was quantified by the analysis of molecular variance (AMOVA) done by the GenALEX v.6.5 software (Peakall & Smouse, 2012). To assess the correlation between geographic distance and genetic diversity of populations of A. bilabiata, Mantel test was done with 9,999 random permutations.
RESULTS AND DISCUSSION
The oligonucleotide combinations examined in six populations of A. bilabiata
revealed high levels of polymorphism (Table 2). A total of 309 loci were detected from four pairs of primers, and of these, 304 (98.38%) were polymorphic. There was a variation of 59-85 polymorphic loci by combining oligonucleotide, and the E+AGT/M+CCA combination was the one that produced the greatest number of countable and polymorphic fragments.
Table 2 - Polymorphism in Arrabidaea bilabiata detected by four combinations of oligonucleotides
Combinations of
oligonucleotides Total of loci
Polymorphic loci
Polymorphis m (%)
E+ATC/M+CGC 59 59 100.00 E+AGC/M+CAT 81 80 98.77 E+AAC/M+CAC 84 80 95.24 E+AGT/M+CCA 85 85 100.00
Total 309 304
The percentage of polymorphic loci found in this study is higher, but comparable to that described in other studies with weeds. Using AFLP markers, Gethi et al. (2005) found 96.8% and 84% of polymorphic loci in Striga asiatica
and Striga hermonhica, respectively. Assessing the genetic diversity in 24 populations of
The relationships of genetic similarity among individuals were characterized as a dendrogram constructed from the Jaccard similarity coefficient, based on data from 309 AFLP fragments (Figure 1). The analysis by the R software pvclust package allowed to separate the individuals into two distinct clusters. Individuals of populations sampled in the city of Autazes (AP1 and AP2) were constituted as a single group, and individuals of the populations sampled in the cities of Parintins (PP1 and PP2) and Itacoatiara (IP1 and IP2) formed a second group. In general, individuals from the same population, such as from the same municipality of sampling, were more similar to each other. The exception was for populations PP2 and IP2, which were genetically closer to each other compared to their populations sampled in
the same municipality. Importantly, the cophenetic correlation coefficient (r = 0.939) indicated a good adjustment of the simplified representation of the genetic distance matrix by means of the dendrogram.
The average genetic distance among populations was 0.268. The shortest and the longest distances were observed among populations AP1 and AP2 (0.116) and AP1 and IP2 (0.430), respectively (Table 3). According to Vidal et al. (2005), weed species often have low similarity (high genetic distances) because they develop and evolve in multiple environments.
Assuming that the gene flow can be estimated from Fst or Gst values, the average gene flow estimated among the six populations was 0.538, indicating low genetic exchange
Figure 1 - Dendrogram of 65 individuals of Arrabidaea bilabiata obtained by UPGMA method and the Jaccard similarity coefficient. Cophenetic correlation coefficient: r = 0.939. The determination of the groups in the dendrogram was performed using the R software pvclust package and taken for P values greater than 95%.
Table 3 - Gene flow estimation (above the diagonal) and Nei’s corrected genetic distance (Nei, 1978) (below the diagonal) among the populations of Arrabidaea bilabiata
Populations AP1 AP2 PP1 PP2 IP1 IP2
AP1 *** 1.741 0.704 0.724 0.816 0.510 AP2 0.116 *** 0.744 0.753 0.794 0.552 PP1 0.298 0.274 *** 1.408 1.140 0.764 PP2 0.391 0.368 0.153 *** 1.823 1.629
via pollen or seed dispersal (Table 3). Higher gene flow values were observed in populations sampled in the same city and among populations sampled in Parintins and Itacoatiara, corroborating the shortest genetic distance estimated between these sampling areas. The Mantel test showed a positive and significant association (r = 0.626; P = 0.001) among the matrices of geographic distance and genetic distance, confirming that geographical proximity affects the genetic heterogeneity of populations of A. bilabiata.In general, the geographical proximity between populations implies an upward trend in the gene flow (Bossart & Prowell, 1998).
Several factors may be responsible for the level of genetic diversity in plant species, which may be strongly affected by geographical distribution, way of life, population size and reproductive system of the species (Zhu et al., 2009). There are no references in the literature about the reproductive mechanisms in A. bilabiata. However, the presence of underground rhizomes with vegetative propagation function was seen in the sampling sites and vegetative reproduction by grafting was successful. This fact, combined with higher similarity in individuals of the same sampling area, can be partly explained by the low gene flow observed in the study populations. Additionally, the existence of a greater genetic distance among individuals in the municipalities of Autazes compared to individuals of Itacoatiara and Parintins municipalities may have geographical reasons.
The municipalities of Itacoatiara and Parintins are located in the channel of the Amazon River, while the city of Autazes is located closest to river Madeira. Floodplains and low flooded areas are interconnected by waterways that can aid in seed dispersal processes of certain species, which tend to have flower and fruit at the time of the flooding (Kubitzki & Ziburski, 1994). The dispersion with the aid of water courses (hydrocoric) occurs in species located on the banks of rivers and lakes or in flooding areas. These seeds do not germinate while they are submerged, but float and remain viable and can be taken to more distant sites (Oliveira & Piedade, 2002).
Because it is a kind of floodplain that rarely produces seeds, and when it occurs it is in the flooding season of rivers (data observed in the sampling sites and unpublished), it is likely that the seeds of
A. bilabiata, or their vegetative parts (fragments of branches or rhizomes), are carried by the river and taken to the municipalities in the channel of the Amazon river. However, it is not possible to state that hydrocoric seed dispersal occurs, for it would be necessary to observe the species phenology and carry out a buoyancy test of seeds, which was not in the scope of this paper. In addition, the morphology of A. bilabiata seeds suggests that they hardly have the ability to disperse via airborne, since they are not winged.
In the assessment of intra-population genetic diversity of A. bilabiata, it was considered that the populations were in Hardy-Weinberg equilibrium. Among these populations, lesser and greater genetic diversity was seen among the accesses in populations PP2 and IP2, respectively (Table 4). The presence of greater intra-population genetic diversity in PP2 and IP1, as demonstrated by the largest H and I values, suggested greater capacity on the part of these populations to invade areas occupied by other species of plants.
Wu et al. (2010), assessing genetic diversity from AFLP markers on V. hederifolia, an invasive weed species, found values of H and I similar to those observed in this study, ranging from 0.113 to 0.188 (H) and from 0.168 to 0.308 (I). However, the values are lower than those commonly observed in forest species (Estopa et al., 2006). They note that, for many weed species, the establishment of new populations in new habitats is done from just a few individuals, which may initially lead to decreased genetic diversity within the population. Over time, the dynamics of the genetic structure in the population is largely driven by gene flow, by environmental selection pressure and genetic drift (Ward, 2006).
To determine the genetic patterns of differentiation and population substructure, the Bayesian analysis was performed by the Structure software (Figure 2). The ΔK criterion
K = 2 as the most likely number of clusters. This result corroborates the UPGMA cluster analysis and separates the populations sampled in Autazes from the others. However, the Iplateau method (Viana et al., 2013) suggests that the most likely number of clusters is K = 6, which separated effectively all sampled populations, according to the geographical origin.
From the K = 2 analysis, it is possible to see that the populations of Autazes (AP1 and AP2) are more divergent from the others, followed by PP1 and PP2 populations sampled in the city of Parintins. These observations are possible due to an increased alignment of the graphical analysis results, according to the tested K. The Structure software separates the most disparate
individuals in more distant populations and then, when increasing the number of tested groups, it identifies the most similar populations. Thus, it was possible to have a better sense of the relationship among the populations (Viana et al., 2013).
High genetic variability was observed in the populations of A. bilabiata, suggesting the effectiveness of AFLP markers to differentiate these weeds, both in intra- and interspecific levels. The analysis of molecular variance showed that 49.29% of the genetic variability is found among individuals within populations and 50.71% among the populations analyzed (Table 5). These results show that similar strategies to control A. bilabiata may not be equally effective in all populations analyzed. In addition, a higher level of genetic variability allows the populations to quickly adapt to environmental conditions, due to the immediate availability of the beneficial allele at higher frequencies (Barrett & Schluter, 2008
)
.Despite the small difference, the fact that the greatest genetic variability is present among populations can significantly impact the selection of tillage practices for the control of the species in different areas. In addition, the existence of higher interpopulation and not intrapopulation variability suggests the existence of low reproductive rate spread and perhaps low efficiency in seed dispersal and pollen, which corroborates the low gene flow values observed; however, this needs to be verified by studies that determine the reproductive biology and the species dispersion system.
Table 4 - Genetic diversity statistics for Arrabidaea bilabiata. Na = number of observed alleles, I = Shannon information index, H = Nei’s genetic diversity index
Source of variation Na I H Polymorphism (%)
AP1 1.243 ( 0.052) 0.264 ( 0.016) 0.173 ( 0.011) 56.96
AP2 1.097 ( 0.052) 0.260 ( 0.017) 0.175 ( 0.011) 49.93
PP1 1.065 ( 0.052) 0.212 ( 0.015) 0.139 ( 0.011) 45.31
PP2 1.411 ( 0.045) 0.316 ( 0.016) 0.212 ( 0.012) 60.19
IP1 1.456 ( 0.045) 0.301 ( 0.016) 0.197 ( 0.011) 64.08
IP2 1.023 ( 0.048) 0.198 ( 0.016) 0.134 ( 0.011) 36.57
65 individuals 1.216 ( 0.020) 0.259 ( 0.007) 0.172 ( 0.005) 98.38
( ) Standard deviation.
This is the first study on the use of AFLP markers to assess genetic variability in natural populations ofA. bilabiata.The AFLP markers were an effective tool in the study of genetic diversity in the species, and the results indicate the possibility that isolated populations of A. bilabiata contain plants with different levels of toxicity.The relatively high genetic diversity found in two sampled populations is indicative of strong adaptability of the species. Probably, the populations of Parintins and Itacoatiara had long had a common origin and, over time, been suffering selection, drift, geographic isolation and mutations, which have structured in subpopulations. Genetic studies in larger areas, with populations with a greater number of individuals and with the aid of the study of phenology of species and reproductive biology can help to understand the factors influencing the genetic variation in A. bilabiata. In general, in order to ensure that much of the variability in A. bilabiata is apprehended, representative samples of each population must be obtained.
ACKNOWLEDGMENT
To Coordination of Improvement of Higher Education Personnel (CAPES) and to Multi-Institutional Program of Post-Graduation in Biotechnology (PPGBIOTEC) for granting a scholarship and funds for the development of this work.
LITERATURE CITED
BARRETT, R. D. H.; SCHLUTER, D. Adaptation from standing genetic variation. Trends Ecol. Evol., v. 23, n. 1, p. 38-44, 2008.
BONIN, A. et al. Statistical analysis of amplified fragment length polymorphism data: a toolbox for molecular ecologists and evolutionists. Molec. Ecol., v. 16, n. 18, p. 3737-3758, 2007.
BOSSART, J. L.; PROWELL, D. P. Genetic estimates of population structure and gene flow: limitations, lessons and new directions. Trends Ecol. Evol.,v. 13, n. 5, p. 202-206, 1998.
CRESTE, S. et al. Detection of single sequence repeat polymorphisms in denaturing polyacrylamide sequencing gels by silver staining. Plant Molec. Biol. Rep.,v. 19, n. 4, p. 299-306, 2001.
DOYLE, J. J.; DOYLE, J. L. Isolation of plant DNA from fresh tissue. Focus, v. 12, n. 1, p. 13-15, 1990.
EARL, D. A.; VONHOLDT, B. M. Structure Harvester: a website and program for visualizing STRUCTURE output and implementing the Evanno method. Conserv. Gen. Resour.,v. 4, n. 2, p. 359-361, 2011.
ESTOPA, R. A. et al. Diversidade genética em populações naturais de candeia (Eremanthus erythropappus (DC.) MacLeish). Sci. For., v. 70, n. 1, p. 97-106, 2006.
EVANNO, G. et al. Detecting the number of clusters of individuals using the software STRUCTURE: a simulation study. Molec. Ecol.,v. 14, n. 8, p. 2611-2620, 2005.
GETHI, J. G. et al. Genetic diversity of Striga hermonhica and Striga asiatica populations in Kenya. Weed Res., v. 4, n. 1, p. 64-73, 2005.
HOISINGTON, D. et al. Laboratory protocols: CIMMYT applied molecular genetics laboratory. 2.ed. México: CIMMYT, 1994. 51 p.
JABOUR, F. F. et al. Variação da toxidez de Arrabidaea bilabiata (Bignoniaceae) em coelhos. Pesq. Veterin. Bras., v. 26, n. 3, p. 171-176, 2006.
KARAM, D. et al. Genetic diversity among proso millet (Panicum miliaceum) biotypes assessed by AFLP technique. Planta Daninha, v. 22, n. 2, p. 167-174, 2004.
KUBITZKI, K.; ZIBURSKI, A. Seed dispersal in floodplain forest of Amazonia. Biotropica, v. 26, n. 1, p. 30-43, 1994.
LEWONTIN, R. C. The apportionment of human diversity. Evolut. Biol., v. 6, p. 381-398, 1972.
Table 5 - Analysis of molecular variance (AMOVA) of six natural populations of Arrabidaea bilabiata, by using AFLP markers
Source of variation Degree of
freedom Sum of squares Average squares
Component of
variance Total (%) p
Among populations 5 1820.573 364.115 31.474 50.71 < 0.01
Within populations 59 1804.904 30.592 30.592 49.29 < 0.01
NEI, M. Estimation of average heterozygosity and genetic distance from a small number of individuals. Genetics,v. 89, n. 3, p. 583-590, 1978.
NEI, M. Analysis of gene diversity in subdivided populations. Proc. Nat. Acad. Sci., v. 70, n. 12, p. 3321-3323, 1973.
OLIVEIRA, A. C.; PIEDADE, M. T. F. Implicações ecológicas da fenologia reprodutiva de Salix martiniana Leyb. (Salicaceae) em áreas de várzea da Amazônia Central. Acta Amaz., v. 32, n. 3, p. 377-385, 2002.
ORTIZ, E. B. Causas de muerte subita en bovinos en pastoreo en las sabanas de America Tropical. R. Colombiana Ci. Pec., v. 17, n. 2, p. 182-192, 2004.
PEAKALL, R.; SMOUSE, P. E. GenAlEx 6.5: genetic analysis in Excel. Population genetic software for teaching and research -an update. Bioinformatics,v. 28, n. 19, p. 2537-2539, 2012.
PESTER, T. A. et al. Genetic diversity of jointed goatgrass (Aegilops cylindrica) determined with RAPD and AFLP markers. Weed Sci., v. 51, n. 3, p. 287-293. 2003.
PRITCHARD, J. K. et al. Inference of population structure using multilocus genotype data. Genetics,v. 155, n. 2, p. 945-959, 2000.
R Development Core Team. R: A language and
environment for statistical computing. Vienna, Austria: R Foundation for Statistical Computing, 2013. ISBN 3-900051-07-0, URL http://www.R-project.org. 2013.
RIET-CORREA, F.; MEDEIROS, R. M. T. Intoxicações por plantas em ruminantes no Brasil e no Uruguai: importância econômica, controle e riscos para a saúde pública. Pesq. Veter. Bras., v. 21, n. 1, p. 38-42, 2001.
ROSENBERG, N. A. Distruct: a program for the graphical display of population structure. Molec. Ecol. Notes,v. 4, n. 1, p. 137-138, 2003.
SETOTAW, T. A. et al. Genetic divergence among barley accessions from Ethiopia. Crop Breed. Appl. Biotechnol., v. 10, n. 4, p. 116-123, 2010.
SLOTTA, T. A. B. What we know about weeds: insights from genetic markers. Weed Sci., v. 56, n. 2, p. 322-326, 2008.
SOKAL, R. R.; ROHLF, F. J. The comparison of dendrograms by objective methods. Taxon,v. 11, n. 2, p. 33-40, 1962.
SUZUKI, R.; SHIMODAIRA, H. Pvclust: an R package for assessing the uncertainty in hierarchical clustering.
Bioinformatics,v. 22, n. 12, p. 1540-1542, 2006.
TOKARNIA, C. H. et al. Plantas tóxicas da Amazônia a bovinos e outros herbívoros. 2.ed. Manaus: INPA, 2007. 97 p.
TOKARNIA, C. H. et al. Aspectos epidemiológicos e clínico-patológicos comparados da intoxicação por Arrabidaea bilabiata (Bignoniaceae) em búfalos e bovinos. Pesq. Veterin. Bras., v. 24, n. 2, p. 74-79, 2004.
van ANDEL, T.; HAVINGA, R. Sustainability aspects of commercial medicinal plant harvesting in Suriname. For. Ecol. Manage., v. 256, n. 8, p. 1540-1545, 2008.
VIANA, J. M. S. et al. Efficacy of population structure analysis with breeding populations and inbred lines. Genetica,v. 141, n. 7-9, p. 389-399, 2013.
VIDAL, R. A. et al. Similaridade genética entre acessos de Bidens pilosa resistentes aos herbicidas inibidores da ALS. Planta Daninha, v. 23, n. 3, p. 551-556, 2005.
WARD, S. Genetic Analysis of Invasive Plant Populations at Different Spatial Scales. Biol. Inv., v. 8, n.3, p. 541-552, 2006.
WU, H. et al.Genetic diversity in Veronica hederifolia (Plantaginaceae), an invasive weed in China, assessed using AFLP markers. Ann. Bot. Fennici, v. 47, n. 3,
p. 190-198. 2010.
YEH, F. C. et al. Popgene version 1.32. Microsoft
Windows-based freeware for population genetic analysis. Canada: University of Alberta, 1999.