On the synthesis of quinone-based BODIPY hybrids: New insights on
antitumor activity and mechanism of action in cancer cells
Talita B. Gontijo
a, Rossimiriam P. de Freitas
a, Flavio S. Emery
b, Leandro F. Pedrosa
c, José B. Vieira Neto
d,
Bruno C. Cavalcanti
d, Claudia Pessoa
d,e, Aaron King
f, Fabio de Moliner
f, Marc Vendrell
f,⇑,
Eufrânio N. da Silva Júnior
a,⇑aInstitute of Exact Sciences, Department of Chemistry, Federal University of Minas Gerais, Belo Horizonte 31270-901, MG, Brazil bFaculty of Pharmaceutical Sciences at Ribeirao Preto, University of São Paulo, CEP 14040-903, Ribeirão Preto, SP, Brazil cInstitute of Exact Sciences, Department of Chemistry, Fluminense Federal University, CEP 27213-145, Volta Redonda, RJ, Brazil dDepartment of Physiology and Pharmacology, Federal University of Ceará, CEP 60180-900 Fortaleza, CE, Brazil
eFiocruz-Ceará, CEP 60180-900 Fortaleza, CE, Brazil
fMRC/UoE Centre for Inflammation Research, The University of Edinburgh, EH16 4TJ Edinburgh, United Kingdom
a r t i c l e
i n f o
Article history:Received 2 August 2017 Accepted 3 August 2017 Available online 4 August 2017
Keywords: Quinone BODIPY Lapachone Cancer
Subcellular localization
a b s t r a c t
Fluorescent quinone-based BODIPY hybrids were synthesised and characterised by NMR analysis and mass spectrometry. We measured their cytotoxic activity against cancer and normal cell lines, performed mechanistic studies by lipid peroxidation and determination of reduced (GSH) and oxidized (GSSG) glu-tathione, and imaged their subcellular localisation by confocal microscopy. Cell imaging experiments indicated that nor-b-lapachone-based BODIPY derivatives might preferentially localise in the lysosomes of cancer cells. These results assert the potential of hybrid quinone-BODIPY derivatives as promising pro-totypes in the search of new potent lapachone antitumor drugs.
Ó2017 Elsevier Ltd. All rights reserved.
Introduction
Over the years, medicinal chemists have been improving several chemical strategies for the discovery of new drugs.1For example,
enzymatic targets have been used in molecular docking studies for computational drug design to predict the chemical structure of potential inhibitors.2Looking for new directions, late stage
func-tionalization of drug-like molecules arises as a modern and elegant strategy in drug discovery programs, as recently reviewed by Cer-nak and coworkers.3Another strategy stems from the inspiration of
natural products. Compounds isolated from diverse natural sources can be used as starting points to generate novel structures with varied biological activities.4As discussed by Newman and Cragg,5
natural products still have a major role in the design of new anti-tumor drugs.
The search for antitumor drugs is a big challenge with multiple questions.6Some of the key questions are associated to the
mech-anism of action of cytotoxic drugs and the subcellular organelles
where drugs preferentially accumulate. These questions can be generally answered by bioimaging experiments7 as well as
in vitrobiological assays.8
Lapachones are naturally occurring naphthoquinones and among the most studied quinones due their potent antitumor activity.9Lately, diverse lapachone derivatives have been reported
as potent cytotoxic drugs against different cancer cell lines.10 In
this regard, advances in the synthesis of lapachones with potent antitumor activity have been accomplished via modification of the A- and C-rings,11with recent progress being achieved by da
Silva Júnior,12 Pinto,13 Hong,14 Ferreira,15 Bonifazi,16 among
others17(Scheme 1A).
As studied by the Boothman group, the mechanism of action of mostb-lapachones is related to the destruction of cancer cells with
elevated levels of NAD(P)H:quinone oxidoreductase 1 (NQO1).18–20
Recently, Ohayon and coworkers21 have shed some light on the
possibility thatb-lapachones might act non-reversibly as inhibitors
of deubiquitinases. The therapeutic effect ofb-lapachones could be
also related to the oxidation of ubiquitin specific peptidase 2 (USP2), as a likely downstream effect of reactive oxygen species (ROS) generation.
http://dx.doi.org/10.1016/j.bmcl.2017.08.007 0960-894X/Ó2017 Elsevier Ltd. All rights reserved.
⇑Corresponding authors.
E-mail addresses:[email protected](M. Vendrell),[email protected] (E.N. da Silva Júnior).
Contents lists available atScienceDirect
Bioorganic & Medicinal Chemistry Letters
In this context, unraveling the mechanism of action of antitu-mor lapachone derivatives is a recurring challenge for the scientific community. In the last few years, our group has dedicated great efforts to prepare fluorescent lapachones by hybridization of the quinoidal moiety with fluorescent compounds, such as the ben-zothiadiazole structure (Scheme 1B).22 Fluorescent lapachones
allow us to answer critical questions related to their mechanism of pharmacological action, including subcellular localization stud-ies in live cells.23Recently, our group has described the first
fluo-rescent lapachone-BODIPY hybrid as well as biological studies, including cytotoxic activity in different cancer cell lines and cell imaging experiments (Scheme 1B).24
Herein, we have developed a new chemical platform to prepare new lapachone derivatives coupled to the fluorescent BODIPY core, which has excellent photophysical properties.24a Lapachones
exhibit potent antitumor activity due to their ability to act on multiple targets, as we have recently demonstrated.25This family
of quinoidal derivatives can be divided into
a
-lapachones (para -quinones) and b-lapachones (ortho-quinones). We have demon-strated that botha
- andb-lapachones display cytotoxic activity in cancer cells.26In the present work, we have synthesized a smallcollection of
a
- andb-lapachone derivatives (Scheme 1C) and eval-uated their cytotoxicity in human cancer and non-cancerous cell lines. Furthermore, we have also prepared fluorescent BODIPY-lapachones to examine the subcellular localization of lapachone-based compounds in cancer cells and any derived effects in their cytotoxic activity.Results and discussion
The synthesis of the quinone-based BODIPY hybrids8–11was accomplished by a convergent synthetic route,24using a classical
copper(I)-catalyzed alkyne-azide cycloaddition (CuAAC) reac-tion.27We used an alkyne-containing BODIPY and azide-containing
quinones to assemble fluorescent, hybrid quinoidal-BODIPY mole-cules. We started the preparation of quinone-containing BODIPYs by the synthesis of boron-dipyrromethene with a terminal alkyne for subsequent CuAAC reaction. There are numerous reports on synthetic approaches to generate BODIPY scaffold with bespoke spectral properties.28,29 Among them, we used the methodology
from the Dehaen group with minor modifications30for preparing
C
(A) Biologically significant lapachone derivatives:
(B) Recent attempts to prepare quinone-based luminescent hybrid compounds:
O O O N NN N S N NH N O O O O O N SN NH N Benzothiadiazole (BTD) and BODIPY
fluorophores with recognized luminescent properties O O O Neto and da Silva Júnior (ref. 22)
O O
O O
A O2N
N Br NN C O O I O I OH C O O O H N N N A O O O N N N H N N B N F F Cl Cl Emery and da Silva Júnior (ref. 24a)
Non-Fluorescent Lapachone-Based BTD
Strategy has failed
Fluorescent Lapachone-Based BODIPY
(C) This Work:New quinone-based BODIPY hybrids and their antitumor, mechanism of action and subcellular localization studies
O O O N N N H N N B N F F Cl O O O N N N H
N NB N
F F Cl O O O N N N H N N N B F F Cl n
8, n = 1 9, n = 2 O O O N N N O NB N F F N B N Cl Cl F F N H N3 Click Reaction or 10 11 15
compound3. With regards to the azides4–7, we initially prepared 3-azido-nor-
a
-lapachone (4) and 4-azido-a
-lapachone (5) from lapachol. The methodology for the synthesis of 4 and5 is well described in the literature.31,32Cyclic lapachones were obtainedby insertion of bromine atoms and nucleophilic substitution with sodium azide to afford the respective clickable analogues4and5. The synthesis of azides 6 and 7 was conducted following methodologies described by our group.25,26,33 Compound 6 was
prepared from C-allyl lawsone upon reaction with iodine to obtain the cyclized product, which underwent nucleophilic substitution with sodium azide. Finally, the last clickable derivative 7 was obtained from nor-lapachol, previously synthesized from lapachol, by the well-established Hooker oxidation method.34Nor-lapachol
was transformed into the key intermediate 3-bromo-nor-b
-lapa-chone, which was reacted with sodium azide to render 3-azide-nor-b-lapachone (7). Once the azido-quinones4–7and the alkyne BODIPY3were obtained, we readily prepared a small collection of quinone-based BODIPY hybrids (8 11) in good yields (Scheme 2). Lapachone-based BODIPYs 8–11 were evaluated for in vitro
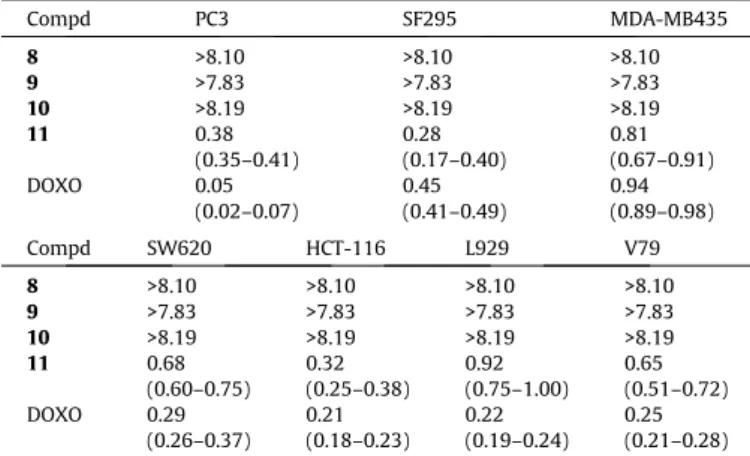
cytotoxicity using an MTT assay in five human cancer cell lines (i.e. PC3, SF295, MDA-MB435, SW620 and HCT-116) and two mur-ine non-cancer (L929 and V79) cells. As previously reported,35
compounds 8–11 were classified according to their cytotoxicity against cancer cells as highly active (IC50< 2mM), moderately
active (2mM < IC50< 10mM), or inactive (IC50> 10mM). As shown
in Table 1, no active para-quinones (8 10) were identified. We have reported
a
-lapachone derivatives with potent cytotoxicity against cancer cells prepared by C-ring modification and insertionof arylamino groups at positions C-3 (nor-
a
-lap) and C-4 (a
-lap).36In fact, molecular hybridization37between
a
-lapachones and1,2,3-triazole groups has been reported as an efficient strategy for anti-tumour compounds.22Herein, the same approach rendered hybrids
compounds (8 10) that were not active against any the tested can-cer cell lines, with IC50values round 8mM for all compounds.
On the other hand, compound11exhibited significant cytotox-icity against all human cancer cell lines with IC50values in the low
micromolar range (i.e. 0.3–0.9
l
M,Table 1). This observation is in line with previous reports of ortho-quinones (i.e. b-lapachone) being more active than the correspondingpara-quinones, such asa
-lapachone.38 Moreover, Abreu and collaborators39have shownthat the radicals generated during the reduction ofb-lapachones reduction confer more stability to reducedortho-quinone deriva-tives when compared to their reducedpara-isomers. As a result,
ortho-quinones, such as the hybrid derivative11, might present better redox cycling ability, which is the ability of a molecule to undergo repeated reduction and oxidation, producing more free radicals than compounds8–10(para-quinones), which is in agree-ment with the absence of cytotoxicity determined for8–10.
The lapachone derivative11presented high activity in all the cancer cell lines evaluated, showing the strongest effect in human glioblastoma cells (SF295) with an IC50value around 300 nM. This
result represents an improvement in the potency of previously described lapachone-based BODIPY derivatives.24 The results
against non-tumor cells showed that11presented IC50values in
V79 and L929 cells in the range 0.92–0.65mM. These results
indi-cate that11 was slightly less cytotoxic against non-tumor cells,
(A) Synthesis of the clickable BODIPY:
(B) Preparation of luminescent quinone-based BODIPY via click chemistry:
(1) (2) (3)
NH HN
NCS/THF - 78 ºC
N B N F F NH
CH3CN H2N
NH N
Cl
CuI/CH3CN CuI/CH3CN
O O
O
N N
N H
N
N B
N F F
Cl
(11,73%)
O O
O
N3
N N B F F
Cl HN
O O
O N
N N
NH N N
B F F
Cl
(9,72%)
O O
O N3
CuI/CH3CN CuI/CH3CN O
O
O N
N
N H
N N B N F F
Cl
(8,83%)
O O
O N3
O O
O
N N
N
H N N
N B F F
Cl
(10, 88%)
O O
O
N3 DDQ/THF
Cl
Et2O.BF 3 Et3N, DCM
Cl
(3)
(4) (5)
(6) (7)
with selectivity indexes (i.e. ratio of cytotoxicities between cancer and normal cells) around 3. Whereas further optimization of the lapachone structure would be needed to enhance these selectivity indexes, these values are in line with those of doxorubicin, a clin-ically used antitumor drug and one of the most potent and impor-tant antitumor quinones.
Quinones are highly redox active molecules leading to forma-tion of reactive oxygen species (ROS), which cause oxidative stress by oxidising lipids, proteins and DNA.40 Lipid peroxidation is a
well-established mechanism of cellular damage, and it can be used as an intracellular indicator of oxidative stress. The measurement of malondialdehyde (MDA), which is one of the most abundant products from lipid peroxidation, is a highly sensitive assay to quantitatively evaluate the formation of lipid peroxides in cells. We determined the levels of MDA in three cancer cell lines (pros-tate, glioma and colon) and one non-tumor cell line (murine fibroblast) 24 h after exposure of compound11, and observed that the levels of MDA in all cancer cells as well as normal fibroblasts evaluated were significantly higher than in the controls (Fig. 1). In addition, when comparing the equal concentrations of com-pound 11between cell lines used in this current study, there is no more sensitive strain than another in relation to the extent of
Table 1
Cytotoxic activity expressed by IC50(mM, 95% CI) of compounds8–11in canceraand
normal cellsb after 72 h. Values obtained by nonlinear regression from three independent experiments and compared to the antitumor drug doxorubicin (DOXO).
Compd PC3 SF295 MDA-MB435
8 >8.10 >8.10 >8.10
9 >7.83 >7.83 >7.83
10 >8.19 >8.19 >8.19
11 0.38
(0.35–0.41)
0.28 (0.17–0.40)
0.81 (0.67–0.91)
DOXO 0.05
(0.02–0.07)
0.45 (0.41–0.49)
0.94 (0.89–0.98)
Compd SW620 HCT-116 L929 V79
8 >8.10 >8.10 >8.10 >8.10 9 >7.83 >7.83 >7.83 >7.83 10 >8.19 >8.19 >8.19 >8.19
11 0.68
(0.60–0.75) 0.32 (0.25–0.38)
0.92 (0.75–1.00)
0.65 (0.51–0.72) DOXO 0.29
(0.26–0.37) 0.21 (0.18–0.23)
0.22 (0.19–0.24)
0.25 (0.21–0.28) a PC3 prostate carcinoma, SF295 glioblastoma, MDA-MB435 melanoma, and SW620 and HCT-116 colon carcinomas cell lines.
b Chinese hamster V79 and mouse L929 cells.
Fig. 1.Determination of MDA levels (TBARS assay) in human cancer cells (PC3, SF295 and HCT-116) and in non-cancer mouse fibroblasts (L929) after 24 h-incubation with compound11or 10mM H2O2(positive control) in the presence or absence of NAC (5 mM).*p < 0.05 as compared to control by ANOVA followed by Tukey’s test. Values as means ± s.e.m. for three independent experiments in triplicate.
byproduct of lipid peroxidation, thiobarbituric acid reactive sub-stances (TBARS) formation. Moreover, the pretreatment of the cells withN-acetylcysteine (NAC) showed a strong protective effect by preventing lipid peroxidation mainly by promoting GSH synthesis by NAC, and by its ROS scavenger ability41highlighting the
proox-idant mechanism linked to cancer and non-cancer cells death. The role of ROS as an important collaborative factor in cell death was well correlated by variation of thiols content after tested com-pound exposure. Oxidative stress burden usually correlates with cellular thiol levels or vice versa cellular thiol/disulfide ratio is a well-accepted indicator of the redox state of a cell.42
Naphtho-quinones with higher redox potential showed stronger cytotoxic-ity, presumably because of stronger electrophilicity against thiols and because their GSH conjugates are more readily reduced to semiquinones which activate oxygen.43 To determine whether
oxidative stress induced by compound 11 is accompanied by changes in total glutathione, the reduced (GSH), oxidized glu-tathione (GSSG) and GSH/GSSG ratio were measured. After 24 h exposure, compound 11 significantly reduced (p<0.05) the total content of glutathione of all cell cultures (Table 2) The decrease in total amount of glutathione after compound11exposure was accompanied by an increase in GSSG levels (p < 0.05) in relation to non-treated cultures. Due to observed compound11exposure effects on both reduced and oxidized glutathione the ratio of GSH/GSSG was decreased. On the other hand, in all cultures pre-exposed to NAC before quinone treatment the level of total glu-tathione was kept nearly or slightly above at the control value.
However, the neutralization of ROS by pretreatment with NAC suggests that an alternative mechanism different from ROS gener-ation might be involved in the cytotoxic effect of compound11, as stated inTable 3, in co-treated (GSH-OEt + naphthoquinones) can-cer and non-cancan-cer cells, GSH-OEt only reduced the sensitivity of compound11exposure but not abrogated it, which pointed that another mechanism differently of ROS generation capacity may be involved in its cytotoxic effects. Quinonoid compounds can potentially damage multiple macromolecules in cells, such as DNA, resulting in single or double strand breaks or the formation of oxidative nucleobases such as 8-oxo-7,8-dihydroguanine, thy-mine and uracil glycol.44In order to assess this possibility, we
per-formed comet assays, which are consistent with the reported DNA damage potential attributed to quinonoid molecules.45,46
Com-pound11caused DNA strand breaks after 24 h exposure in all three cancer cell lines as well as in murine fibroblasts. In relation to the antioxidant potential of NAC, it is known that NAC can regulate of oxidative stress related gene expression, having an antagonistic effect on oxidative injuries.47 However, as shown inFig. 2, NAC
pretreatment did not prevent DNA damage but only resulted in slightly lower levels of fragmented DNA. Altogether, these results suggest that the high cytotoxicity of compound11 is not exclu-sively limited to the generation of ROS generation. The results of ongoing studies in our laboratories will be reported in due course. Finally, in order to analyse the subcellular localization studies of the lapachone-BODIPY hybrid11, we measured its photophysical properties. However, compound 11 presents a very low
Table 2
Effects of compound11on intracellular thiols after 24 h with or without NAC pretreatment.
Cell line Treatment Concentration Intracellular thiols (mg/mg protein)
Total GSH GSSG GSH/GSSG
PC3 Controla 0.1% DMSO 4.23 ± 0.75 3.04 ± 0.51 1.11 ± 0.12 2.69 ± 0.21
NAC 5 mM 4.74 ± 0.50 3.53 ± 0.33 1.18 ± 0.21 2.87 ± 0.55
11 5mM 3.53 ± 0.81* 1.35 ± 0.10* 2.16 ± 0.15* 0.37 ± 0.11*
11 plus NACb 5
mM 4.26 ± 0.55 3.13 ± 0.22 1.07 ± 0.15 2.88 ± 0.33
SF295 Control 0.1% DMSO 4.51 ± 0.83 3.16 ± 0.21 1.31 ± 0.55 2.34 ± 0.56
NAC 5 mM 4.86 ± 0.71 3.81 ± 0.55 1.02 ± 0.10 3.61 ± 0.81
11 5mM 3.44 ± 0.10* 1.31 ± 0.16* 2.09 ± 0.21* 0.39 ± 0.20*
11 plus NAC 5mM 4.72 ± 0.22 3.47 ± 0.55 1.21 ± 0.10 2.82 ± 0.10
HCT-116 Control 0.1% DMSO 5.02 ± 0.91 3.74 ± 0.55 1.19 ± 0.37 3.09 ± 0.33
NAC 5 mM 5.38 ± 0.45 4.09 ± 0.61 1.23 ± 0.33 3.26 ± 0.21
11 5mM 3.81 ± 0.56* 1.78 ± 0.25* 2.01 ± 0.22* 0.56 ± 0.10*
11 plus NAC 5mM 5.12 ± 0.11 3.71 ± 0.25 1.38 ± 0.33 2.63 ± 0.22
L929 Control 0.1% DMSO 4.87 ± 0.25 3.76 ± 0.51 1.05 ± 0.33 3.55 ± 0.51
NAC 5 mM 5.43 ± 0.81 3.89 ± 0.75 1.52 ± 0.10 2.52 ± 0.33
11 5mM 3.50 ± 0.15* 1.15 ± 0.21* 2.27 ± 0.33* 0.33 ± 0.10*
11 plus NAC 5mM 5.21 ± 0.33 3.89 ± 0.21 1.24 ± 0.25 3.08 ± 0.50
aNegative controls treated with vehicle (0.1% DMSO); b cells were pretreated for 24 h with NAC (5 mM);
*p < 0.05 as compared to control by ANOVA followed by Tukey’s test. Values as means ± s.e.m. for three independent experiments in triplicate.
Table 3
IC50values (lM) for compounds8–11after 24 h of exposure in different cells in the presence or absence of reduced GSH.
Compound GSH-OEta PC3 SF295 HCT-116 L929
+ >40 >40 >40 >40
8 – >40 >40 >40 >40
+ >40 >40 >40 >40
9 – >40 >40 >40 >40
+ >40 >40 >40 >40
10 – >40 >40 >40 >40
+ >40 >40 >40 >40
11 – 4.47 ± 0.73 1.96 ± 0.21 5.28 ± 0.55 5.91 ± 0.10
+ 15.83 ± 1.15 9.81 ± 0.10 14.25 ± 2.10 12.41 ± 1.75
fluorescence quantum yield, which limits its capabilities for fluo-rescence cell imaging (Table 4and Figs. S16 and S17 in ESI). As reported for other BODIPY dyes,47a the amino group in the
position5of the BODIPY core can cause significant quenching of the fluorophore via photoinduced electron transfer (PeT), making it unsuitable for imaging studies. Whereas the quenching effect is highly pronounced in compound 11, the extent of PeT quenching is dependent on the structure of the quinone-based BODIPY core and the amino substituents. In view of these results, we synthesized the BODIPY-alkyne 14 as described in the literature and conjugated it to the quinone7by CuAAC reaction to render the hybrid BODIPY-quinone15(seeScheme 3).48,49We
measured the photophysical properties of compound15, and as expected, determined its excitation and emission maxima in the green visible range, with high extinction coefficients and fluores-cence quantum yields (Table 4andFig. S1 in ESI), being a suitable fluorescent probe for live-cell imaging.
With compound15in hands, we tested its cytotoxicity in the same five cancer cell and non-cancer cell lines. Compound15
dis-played antiproliferative effects only in PC3 prostate and HCT-116 colon cell lines with IC50 values equal to 2.39 (2.14–2.65) and
2.85 (2.65–3.07) mM, respectively. For cancer cells (SF295,
MDA-MB435 and SW620) and normal cells (L929 and V79) IC50values
were determined to be >7.72mM. Given the differences in
cytotox-icity, we assessed the subcellular localization of compound15in PC3 cancer cells. Fluorescence confocal microscopy experiments revealed the preferential accumulation of 15 in the subcellular lysosomal compartments, showing strong co-localization with commercially available LysoTracker Red but not with MitoTracker Red dyes (Fig. 3). Under these conditions, compound11was not detectable under the fluorescence microscope due to its low quan-tum yield (Fig. S18 in ESI).
Mefloquine, a known antimalarial and antitumoral molecule, has been reported to accumulate in the subcellular lysosomes of acute myeloid leukemia cells, where it exhibits high cytotoxicity due to lysosomal disruption.50This observation led us to evaluate
the compound15in 2 leukemia cancer cell lines (HL-60 and Jurkat cells). Notably,15presented high activity in these cell lines with IC50 values in the low micromolar range [for HL-60 cells,
IC50= 0.92 (0.90–1.05) and for Jurkat cells, IC50= 0.94 (0.86–0.98) mM]. Furthermore, because compound15showed very low
cyto-toxicity in non-cancer cells (i.e. L929 and V79), its selectivity index was over 8.5 (i.e.7-fold higher than compound11). Finally, we
also assessed the effect of compound15on intracellular thiols in HL-60 and Jurkat cancer cell lines (Table 5). Remarkably, a weaker protective effect was observed for cells pretreated with NAC,
Fig. 2.Effects of compound11on DNA strand breaks index after 24 h of exposure using alkaline comet assay exposure in the presence or absence of NAC (5 mM).*p < 0.05 as compared to control by ANOVA followed by Tukey’s test. Data are presented as mean values ± SEMs for three independent experiments in triplicate.
Table 4
Photophysical data for compounds11and15.
Compound kabs.(nm) kabs.(nm) e(M1cm1) QYa
11 495 530 30,300 0.03
15 498 511 68,800 0.82
a Determined as relative to fluorescein in basic EtOH (QY: 0.97).49a
suggesting a different mechanism of action between both lapa-chone-BODIPY hybrids. The ROS-independent cytotoxic effect of compound 15is in line with the subcellular localization studies and its potential activity in lysosomal disruption of leukemia can-cer cells.
Conclusions
We have synthesized and characterized a small collection of novel quinone-based BODIPY hybrids of the natural products
lapa-chol and lawsone. All compounds were evaluated in cancerous and non-cancerous cell lines, and we identified two nor-b-lapachone
hybrids (11 and 15) with potent cytotoxic activity. Mechanistic studies for both compounds suggest that the action of compound
11may be related to the generation of reactive oxygen species whereas the fluorescent lapachone 15 may exert its cytotoxic action in subcellular lysosomal organelles. This study provides new structure-activity relationships in the preparation of biologi-cally active lapachone derivatives as well as new insights in the potential mechanism of action for their cytotoxic activity.
O O
O
N3
N B N O
F F
O O
O
N N N
O
NB N
F F
(15, 70%) +
CH3CN CuI
(A) Synthesis of the clickable BODIPY:
(B) Preparation of luminescent quinone-based BODIPY via click chemistry: (12)
(13) (14)
NH HN N
BN F F
K2CO3, acetone
Br DDQ/THF
Et2O.BF3 Et3N, DCM
OH OH
N BN O
F F
(14) (7)
Scheme 3.Synthesis of the quinone-based BODIPY derivative15.
Experimental section
Chemistry
Melting points were obtained on Thomas Hoover and are uncor-rected. Analytical grade solvents were used. Column chromatogra-phy was performed on silica gel (SilicaFlash G60 UltraPure 60– 200mm, 60 Å).1H and13C NMR were recorded at room
tempera-ture using a Bruker AVANCE DRX400, in the solvents indicated, with TMS as internal reference. Chemical shifts (d) are given in ppm. Electron-impact mass spectra (70 eV) were obtained using a VG Autospec apparatus (Micromass, Manchester, UK). Absorption spectra were obtained on a Varian Cary 100 spectrophotometer at room temperature in the solvents described above. Fluorescence spectra were obtained on a Varian Cary Eclipse spectrofluorimeter with a xenon arc lamp as the light source while using an excitation wavelength (kexc) corresponding to a higher absorption band. In all
experiments, a quartz cuvette was employed with a 1 cm optical path length. Azide derivatives4–7 and BODIPY14 were synthe-sized as previously reported in the literature.25,26,30–33Structures
of the novel compounds3,8–11and15were determined by1H
and 13C NMR. Electrospray ionization mass spectra were also
obtained to confirm compound identities.
Procedure for the synthesis of BODIPY 3
To a solution of dichlorinated BODIPY (215 mg, 0.639 mmol) in acetonitrile (15 mL) under stirring at room temperature, propargy-lamine (102mL, 1.6 mmol, 2.5 eq) was added. After 1 h under
stir-ring at room temperature TLC control showed full conversion of the starting material. Solvent was evaporated under reduced pres-sure and, after purification via silica column chromatography (C6H14/DCM, 3:2–1:3), the desired product3(201 mg, 0.56 mmol,
89% yield) was obtained.1H NMR (400 MHz, CDCl
3)d: 7.49–7.43
(m, 5H), 6.93 (d, 1H,J= 4 Hz), 6.49 (br, 1H), 6.39 (d, 1H,J= 4 Hz), 6.28 (d, 1H,J= 4 Hz), 6.21 (d, 1H,J= 4 Hz), 4.17 (dd, 2H, J= 2.4 and 3.6 Hz), 2.38 (t, 1H,J= 2.4 Hz).13C NMR (100 MHz, CDCl
3)d:
169.3, 135.9, 133.7, 133.2, 132.0, 131.2, 130.3, 129.5, 128.3, 121.6, 113.2, 110.9, 78.8, 34.1. EI/MS (m/z) [M+H]+: 356.0. Calcd
for [C18H14BClF2N3]+: 356.0.
General procedure to prepare quinone-based BODIPY hybrids8–11
and15
In a round bottom flask, the respective azide derivatives (0.6 mmol), alkyne BODIPYs (0.5 mmol), and 10 mL of CH3CN were
added. The reaction mixture was stirred until complete solubiliza-tion of the reagents after which, CuI (10% per mole) was added. The system was kept under inert atmosphere (Ar) until complete con-sumption of BODIPY and monitored by TLC until its completion.
The solvent from the crude was evaporated under reduced pres-sure and it was purified by column chromatography on silica-gel, using eluents with an increasing polarity gradient mixture of hex-ane and ethyl acetate.
Nor-
a
-lapachone-based BODIPY (8)Compound8was obtained as a brown solid after 18 h of reac-tion (258 mg, 83% yield); mp 173–175°C. 1H NMR (400 MHz,
CDCl3) d: 8.16–8.14 (m, 1 H), 8.05–8.03 (m, 1H), 7.75–7.73 (m,
2H), 7.59 (s, 1H), 7.48–7.44 (m, 5H), 6.86 (d, 1H,J= 4.8 Hz), 6.82 (br, 1H), 6.35 (d, 1 H,J= 3.8 Hz), 6.29 (d, 1 H,J= 4.8 Hz), 6.18 (d, 1H, J= 3.8 Hz), 6.00 (s, 1H), 4.73 (d, 2H,J= 6.1 Hz), 1.74 (s, 3H), 1.16 (s, 3H). 13C NMR (100 MHz, CDCl
3) d: 180.9, 179.8, 177.8,
144.6, 135.9, 134.8, 135.9, 134.8, 133.6, 133.5, 131.9, 131.7, 130.5, 130.3, 129.3, 128.2, 127.2, 126.8, 126.5, 121.9, 121.1, 118.1, 94.3, 67.8, 40.4, 27.5, 21.0. EI/HRMS (m/z) [M+Na]+:
647.1551. Calcd for [C32H24BClF2N6O3Na]+: 647.1557.
a
-Lapachone-based BODIPY (9)Compound9was obtained as a brown solid after 18 h of reac-tion (229 mg, 72% yield); mp 171–173°C. 1H NMR (400 MHz,
CDCl3) d: 8.12–8.10 (m, 1H), 7.95–7.93 (m, 1H), 7.69–7.67 (m,
3H), 7.47–7.42 (m, 5H), 6.87 (d, 1H, J= 4.4 Hz), 6.81 (br, 1H), 6.35–6.32 (m, 2H), 6.17 (d, 1H,J= 3.6 Hz), 5.78 (t, 1H,J= 6.6 Hz), 4.74 (d, 2H,J= 6 Hz), 2.72 (dd, 1H,J= 14.6 and 6.8 Hz), 2.40 (dd, 1H, J= 14.6 and 6.8 Hz), 1.50 (s, 3 H), 1.35 (s, 3 H). 13C NMR
(100 MHz, CDCl3) d: 182.8, 179.3, 161.9, 156.2, 143.8, 135.9,
134.5, 133.7, 133.5, 132.7, 131.9, 131.8, 131.1, 131.3, 129.4, 128.3, 126.7, 126.4, 122.3, 120.9, 115.1, 112.9, 111.2, 79.3, 50.2, 40.5, 39.3, 26.9, 26.2. EI/HRMS (m/z) [M+Na]+: 661.1704. Calcd
for [C33H26BClF2N6O3Na]+: 661.1714.
Nor-
a
-lapachone-based BODIPY derivative (10)Compound10was obtained as a brown solid after 18 h of reac-tion (268 mg, 88% yield); mp 165–168°C. 1H NMR (400 MHz,
CDCl3)d: 7.94 (d, 1H,J= 7.6 Hz), 7.91 (d, 1H, J= 7.6 Hz), 7.84 (s,
1H), 7.61 (t, 1H,J= 7.6 Hz), 7.55 (t, 1H,J= 7.6 Hz), 7.48–7.45 (m, 5H), 7.09 (br, 1H), 6.85 (d, 1H,J= 4,8 Hz), 6.41 (d, 1 H,J= 4.8 Hz), 6.33 (d, 1H, J= 4 Hz), 6.16 (d, 1H, J= 4.0 Hz), 5.40 (m, 1H), 4.82 (d, 2H, J= 5.2 Hz), 4.78 (d, 2 H, J= 6.4 Hz), 3.41–3.34 (m, 1H), 3.04–2.97 (m, 1H). 13C NMR (100 MHz, CDCl
3) d: 181.7, 177.3,
161.9, 159.1, 144.7, 135.9, 134.2, 133.7, 133.4, 133.1, 132.6, 132.2, 131.9, 131.3, 130.3, 129.8, 129.3, 128.3, 126.2, 125.2, 124.2, 123.7, 120.4, 112.8, 111.4, 83.2, 53.0, 40.0, 30.2. EI/HRMS (m/z) [M+Na]+: 633.1386. Calcd for [C
31H22BClF2N6O3Na]+:
633.1401.
Table 5
Effects of compound15on intracellular thiols after 24 h of cell exposure with or without NAC pretreatment.
Cell line Treatment Concentration Intracelular thiols (mg/mg protein)
Total GSH GSSG GSH/GSSG
HL-60 Controla 0.1% DMSO 3.61 ± 0.22 3.01 ± 0.11 0.66 ± 0.17 4.53 ± 0.55
NACb 5 mM 3.85 ± 0.81 3.03 ± 0.25 0.75 ± 0.90 4.02 ± 0.61
15 5mM 3.01 ± 0.44* 0.72 ± 0.20* 2.18 ± 0.10* 0.31 ± 0.05*
15 plus NACc 5mM 2.83 ± 0.71* 1.19 ± 0.10* 1.47 ± 0.33* 0.76 ± 0.10* Jurkat Controla 0.1% DMSO 3.87 ± 0.55 3.02 ± 0.21 0.78 ± 0.33 3.81 ± 0.22
NACb 5 mM 4.13 ± 0.25 3.25 ± 0.17 0.81 ± 0.55 3.97 ± 1.17
15 5mM 3.28 ± 0.60* 0.60 ± 0.33* 2.57 ± 0.10* 0.21 ± 0.11*
15 plus NACc 5mM 3.11 ± 0.05* 1.58 ± 0.55* 1.44 ± 0.51* 1.08 ± 0.33*
a Negative controls treated with vehicle (0.1% DMSO); b cells were pretreated for 24 h with NAC (5 mM). c N-acetylcysteine.
Nor-b-lapachone-based BODIPY (11)
Compound11was obtained as a brown solid after 48 h of reac-tion (227 mg, 73% yield); mp 190–193°C. 1H NMR (400 MHz,
CDCl3)d: 7.96 (d, 1H, J= 7.2 Hz), 7.83–7.79 (m, 2H), 7.73 (t, 1H, J= 8.9 Hz), 7.65 (t, 1H, J= 7.8 Hz), 7.46–7.42 (m, 5H), 6.89 (br, 1H), 6.84 (d, 1H,J= 4 Hz), 6.34 (br, 2H), 6.14 (br, 1H), 6.00 (br, 1H), 4.74 (d, 2H,J= 4.4 Hz), 1.77 (s, 3H), 1.17 (s, 3H). 13C NMR
(100 MHz, CDCl3) d: 180.2, 174.9, 171.4, 161.8, 144.3, 136.0,
134.6, 133.7, 133.2, 132.4, 131.9, 131.6, 130.3, 120.8, 129.3, 128.3, 126.8, 125.6, 122.3, 120.5, 112.8, 111.4, 111.4, 95.9, 67.1, 40.4, 27.7, 21.2. EI/HRMS (m/z) [M+Na]+: 647.1521. Calcd for [C
32
-H24BClF2N6O3Na]+: 647.1557.
Fluorescent nor-b-lapachone-based BODIPY (15)
Compound15was obtained as a red solid after 48 h of reaction (226 mg, 70% yield); mp 176–179°C.1H NMR (400 MHz, CDCl3)d:
8.21 (d, 1H,J= 7.2 Hz), 7.83 (t, 1H,J= 7.2 Hz), 7.79–7.73 (m, 2H), 7.64 (s, 1H), 7.18 (d, 2H,J= 8.0 Hz), 7.09 (d, 2 H,J= 8.0 Hz), 6.03 (s, 1H), 5.98 (s, 2H), 5.24 (d, 2H,J= 4.0 Hz), 2.56 (s, 6H), 1.80 (s, 3H), 1.41 (s, 6H), 1.22 (s, 3H). 13C NMR (100 MHz, CDCl
3) d:
180.1, 174.6, 171.4, 158.9, 155.5, 143.9, 143.2, 141.7, 135.0, 133.6, 131.9, 131.7, 130.2, 129.4, 127.9, 126.7, 125.7, 122.5, 121.3, 115.6, 111.2, 96.0, 67.2, 62.3, 27.8, 21.3, 14.6. EI/HRMS (m/
z) [M+Na]+: 670.2401. Calcd for [C
36H32BF2N5O4Na]+: 670.2413.
Biological data
Inhibition of cell proliferation – MTT tests
Cell growth was quantified by the ability of living cells to reduce the yellow dye MTT to a purple formazan product. Cytotox-icity was checked on different human cancer cell lines (HL-60 and Jurkat leukemias, PC3 prostate carcinoma, SF295 glioblastoma, MDA-MB435 melanoma, SW620 and HCT-116 colon carcinomas cell lines), and two non-cancer murine fibroblasts (Chinese ham-ster V79 and mouse L929 cells). All cancer cells were obtained from the National Cancer Institute in Bethesda, MD, USA. The V79 cells were kindly provided by Dr. Henriques JAP (Federal University of Rio Grande do Sul, Porto Alegre, Brazil), and L929 cells were pur-chased from Rio de Janeiro Cell Bank (BCRJ, Rio de Janeiro, Brazil). For the experiments, cells were plated in 96-well plates (0.7105–
0.3106 cells/well for cancer cells and 0.5105 cells/well for
murine fibroblasts), and tested compounds, dissolved in DMSO (0.1%), was then added to each well, followed by incubation for 24 h at concentrations ranging from 0.04 to 40.92
l
M or 72 h at concentrations ranging from 0.04 to 8.19l
M. In some experi-ments, the contribution of ROS to the cytotoxicity of tested qui-nones was assessed by cells co-treated with GSH-OEt (15 mM). Our preliminary experiments showed that the ethyl ester of GSH was not cytotoxic and provided a more efficient protection than GSH at the same concentration (15 mM). In fact, GSH is not readily transported into most cells. Thus, in the MTT experiments, we used GSH ethyl ester, which is more lipophilic, readily taken up by cells and hydrolyzed to GSH by cellular nonspecific esterases.51After-ward, the plates were centrifuged and the medium replaced by fresh medium (150
l
L) containing 0.5 mg/mL MTT. Three hours later, the MTT formazan product was dissolved in 150mL DMSO,and absorbance was measured using a multiplate reader (Spectra Count, Packard, Ontario, Canada). Drug effect was quantified as the percentage of control absorbance of the reduced dye at 595 nm. Doxorubicin (0.001–1.06
l
M) was used as positive con-trol. Experiments were carried out in triplicate and repeated at least three times.Lipid peroxidation (TBARS assay)
The extent of tested compound-induced lipid peroxidation was determined by the reaction of thiobarbituric acid (TBA) with
malondialdehyde (MDA), a product formed by lipid peroxidation.52
The assays were performed according to Salgo and Pryor,53with
minor modifications. Cells were incubated with compound for 24 h, and after lysis with Tris-HCl (15 mM for 1 h). Two milliliters 0.4 mg/mL trichloroacetic acid, 0.25 M HCl were added to the lysate, which was then incubated with 6.7 mg/mL TBA for 15 min at 100°C. The mixture was centrifuged at 750gfor 10 min. As TBA reacts with other products of lipid peroxidation in addition to MDA, results are expressed in terms of thiobarbituric reactive species (TBARS), which are determined by absorbance at 532 nm. Hydrolyzed 1,1,3,3-tetramethoxypropan was used as the standard. The results were normalized by protein content.54In order to
eval-uate the contribution of ROS on lipid peroxidation extent, cells were pre-treated for 24 h with NAC (5 mM), and after they were exposed to tested compound during 24 hH2O2(10
l
M) was usedas positive control. All experiments were performed in triplicate in three independent experiments.
Determination of reduced (GSH), oxidized (GSSG) glutathione, and GSG/GSSG ratios
Total glutathione (GSH + GSSG) was determined by spectropho-tometer determination of 5-thio-2-nitrobenzoate (TNB), which was produced from DTNB, according to Akerboom and Sies55with
minor modification. Briefly, cells were exposed with tested com-pound (5
l
M) during 24 h. Then, cells were washed with ice-cold PBS, and resuspended in 0.1 sodium phosphate (5 mM EDTA, pH 8.0), and sonicated to obtain the cell homogenate. An equal volume of 2 M HClO4-4 mM EDTA was added to the cell extract, and theprecipitated proteins were sedimented by centrifugation at 8000gfor 15 min at 4°C. The supernatant was neutralized with
2 M KOH, and the insoluble residue was removed by centrifugation under the same conditions. For the spectrophotometric determina-tion 910
l
L of the cell extract supernatant or of the standard glu-tathione solution, in the same phosphate-EDTA buffer, were mixed with 50l
L of 4 mg/mL NADPH in 0.5% (w/v) NaHCO3,20
l
L of 6 U/mL glutathione reductase in phosphate-EDTA buffer, and 20l
L of 1.5 mg/mL DTNB in 0.5% NaHCO3. The increase inabsorbance was measured at 412 nm. The results were normalized by protein content.54Total glutathione content was determined as
l
g/mg protein. For GSSG determination, 4-vinypyridine was added to a final concentration of 0.1% (v/v), and then incubated for 1 h at room temperature. At this concentration, 4-vinypyridine is able to react with all GSH without interfering with GSSG determination. GSH was determined based on the total glutathione and GSSG con-centration results. In order to evaluate the contribution of ROS on glutathione modulation content, cells were pre-treated for 24 h with NAC (5 mM), and after they were exposed to tested com-pound during 24 h. All experiments were performed in triplicate in three independent experiments.Alkaline comet assay (Single cell gel electrophoresis)
The alkaline comet assay was performed as described by Singh et al.56with minor modifications,57and following the
recommen-dations of the International Workshop on Genotoxicity Test Proce-dures.58 At the end of the treatment with
11 (2.5, 5, and 10mM
during 24 h) exposure in the presence or absence of 5 mM NAC (pre-treated for 24 h), cells were washed with ice-cold PBS, detached with 100
l
L trypsin (0.15%) and resuspended in complete RPMI medium. Next, 20l
L of cell suspension (106cells/mL) weremixed with 0.75% low melting point agarose and immediately spread onto a glass microscope slide precoated with a layer of 1% normal melting point agarose. The agarose was allowed to set at 4°C for 5 min. The slides were incubated in ice-cold lysis solution
(2.5 M NaCl, 10 mM Tris, 100 mM EDTA, 1% Triton X-100 and 10% DMSO, pH 10.0) at 4°C for a minimum of 1 h to remove cellular
the slides were placed on a horizontal electrophoresis unit. The unit was filled with fresh buffer (300 mM NaOH and 1 mM EDTA, pH > 13.0) to cover the slides for 20 min at 4°C to allow DNA
unwinding and expression of alkali-labile sites. Electrophoresis was conducted for 20 min at 25 V and 300 mA (0.86 V/cm). After electrophoresis, the slides were neutralized (0.4 M Tris, pH 7.5), stained with ethidium bromide (20
l
g/mL) and analyzed using a fluorescence microscope. All the above steps were conducted under yellow light or in the dark to prevent additional DNA dam-age. Images of 100 randomly selected cells (50 cells from each of two replicate slides) were analyzed for each concentration of test substance. Cells were scored visually and assigned to one of five classes, according to tail size (from undamaged-0, to maximally damaged-4), and a DNA strand breaks index value was calculated for each sample of cells. DNA strand breaks index thus ranged from 0 (completely undamaged: 100 cells0) to 400 (with maximumdamage: 100 cells4).59
Spectral characterization
Spectral characterization of BODIPY-prodrug conjugates. Spec-troscopic and quantum yield data were recorded on a Synergy HT spectrophotometer (Biotek). Compounds were dissolved at the indicated concentrations and spectra were recorded at r.t. Spectra are represented as means from at least two independent experiments with n = 3. Quantum yields were calculated by mea-suring the integrated emission area of the fluorescence spectra and comparing it to the area measured for fluorescein in basic EtOH.
Fluorescence confocal microscopy
PC3 cells were grown in DMEM cell culture media supple-mented with 10% FBS, antibiotics (100 U mL 1 penicillin and
100 mg mL 1streptomycin) and 2 mM
L-glutamine in a humidified
atmosphere at 37°C with 5% CO2. Cells were plated on glass
cham-ber slides Lab-TekTMII (Nunc), incubated with compounds11or15
(5
l
M) with or without Tracker dyes at 37°C for 10 min. Cells wereimaged in phenol red-free DMEM under a Zeiss LSM 510 META flu-orescence confocal microscope equipped with a live cell imaging stage. Fluorescence and brightfield images were acquired using a 40X oil objective. Fluorophores were excited with 488 nm (com-pound 15) or 543 nm (Lysotracker Red, Mititarcker Red) lasers. All images were analysed and processed with ImageJ.
Acknowledgements
This research was funded by grants from the Conselho Nacional de Desenvolvimento Científico e Tecnológico (CNPq 305385/2014-3, PVE 401193/2014-4, 477346/2013-8 and Edital Universal MCTI/ CNPq N° 01/2016), FAPEMIG (APQ-02478-14), FAPESP
(2014/22451-7) and Programa Pesquisador Mineiro (PPM-00638-16), INCT-Catálise, CAPES/DAAD 99999.008126/2015-01 and CAPES. M. V. acknowledges the Medical Research Council, the Marie Curie Integration Grant (333847), and the Biotechnology and Biological Sciences Research Council (BB/M025160/1). The authors acknowledge Dr. Bin-Zhi Qian (Univ. Edinburgh) for the supply of PC3 cancer cells for imaging studies.
A. Supplementary data
Supplementary data associated with this article can be found, in the online version, at http://dx.doi.org/10.1016/j.bmcl.2017.08. 007.
References
1. Lombardino JG, Lowe JA.Nat Rev Drug Discov. 2004;3:853–862.
2. (a) Meng XY, Zhang HX, Mezei M, Cui M. Curr Comput Aided Drug Des. 2011;7:146–157;
(b) Moitessier N, Pottel J, Therrien E, et al.Acc Chem Res. 2016;49:1646–1657. 3. Cernak T, Dykstra KD, Tyagarajan S, Vachal P, Krska SW. Chem Soc Rev.
2016;45:546–576.
4. (a) Kingston DGI.J Nat Prod. 2011;74:496–511;
(b) Yraola F, Ventura R, Vendrell M, et al.QSAR Comb Sci. 2004;23:145–152; (c) Vendrell M, Angulo E, Casadó V, et al.J Med Chem. 2007;50:3062–3069; (d) Vendrell M, Soriano A, Casadó V, et al.ChemMedChem. 2009;4:1514–1522. 5. Newman DJ, Cragg GM.J Nat Prod. 2016;79:629–661.
6. Brentjens RJ.Blood. 2012;119:3872–3873.
7. (a) Rudin M, Weissleder R.Nat Rev Drug Discov. 2003;2:123–131; (b) Sittampalam G, Westmore M.Anal Bioanal Chem. 2003;377:953–954. 8. (a) Araújo AJ, de Souza AA, da Silva Júnior EN, et al. Toxicol In Vitro.
2012;26:585–594;
(b) Park SJ, Yeo HC, Kang NY, et al.Stem Cell Res. 2014;12:730–741. 9. (a) Hillard EA, de Abreu FC, Ferreira DCM, Jaouen G, Goulart MOF, Amatore C.
Chem Commun. 2008;2612–2628;
(b) Parkinson EI, Hergenrother PJ.Acc Chem Res. 2015;48:2715–2723; (c) de Paiva YG, Ferreira FR, Silva TL, et al. Curr Top Med Chem. 2015;15:136–162.
10. (a) Ma J, Lim C, Sacher JR, Houten BV, Qian W, Wipf P.Bioorg Med Chem Lett. 2015;25:4828–4833;
(b) Inagaki R, Ninomiya M, Tanaka K, Koketsu M. ChemMedChem. 2015;10:1413–1423;
(c) Ding Q, Zhang Y, Shen Z, Song C, Chang J.Helv Chim Acta. 2015;98:128–134. 11. de Castro SL, Emery FS, da Silva Júnior EN.Eur J Med Chem. 2013;69:678–700. 12. (a) da Silva Júnior EN, Cavalcanti BC, Guimarães TT, et al.Eur J Med Chem.
2011;46:399–410;
(b) Jardim GAM, Guimarães TT, Pinto MCFR, et al. Med Chem Commun. 2015;6:120–130;
(c) Vieira AA, Brandão IR, Valença WO, et al. Eur J Med Chem. 2015;101:254–265.
13. da Silva Júnior EN, de Deus CF, Cavalcanti BC, et al. J Med Chem. 2010;53:504–508.
14. Lim SM, Jeong Y, Lee S, et al.J Med Chem. 2015;58:8491–8502.
15. Cardoso MFC, da Silva IMCB, dos Santos Júnior HM, et al.J Braz Chem Soc. 2013;24:12–16.
16. Bonifazi EL, Ríos-Luci C, León LG, Burton G, Padrón JM, Misico RI.Bioorg Med Chem. 2010;18:2621–2630.
17. (a) Jiménez-Alonso S, Orellana HC, Estévez-Braun A, Ravelo AG, Pérez-Sacau E, Machín F.J Med Chem. 2008;51:6761–6772;
(b) Kongkathip N, Kongkathip B, Siripong P, et al. Bioorg Med Chem. 2003;11:3179–3191;
(c) Netto CD, da Silva AJM, Salustiano EJS, et al. Bioorg Med Chem. 2010;18:1610–1616.
18. Bey EA, Bentle MS, Reinicke KE, et al. Proc Natl Acad Sci USA. 2007;104:11832–11837.
19. Bey EA, Wuerzberger-Davis SM, Pink JJ, et al.J Cell Physiol. 2006;209:604–610. 20. Bentle MS, Reinicke KE, Dong Y, Bey EA, Boothman DA. Cancer Res.
2007;67:6936–6945.
21. Ohayon S, Refua M, Hendler A, Aharoni A, Brik A. Angew Chem Int Ed. 2014;54:599–603.
22. da Cruz EHG, Carvalho PHPR, Corrêa JR, et al.New J Chem. 2014;38:2569–2580. 23. Shaul P, Frenkel M, Goldstein EB, et al.ACS Med Chem Lett. 2013;4:323–328. 24. (a) Gontijo TB, de Freitas RR, de Lima GF, et al. Chem Commun.
2016;52:13281–13284;
(b) Lee JS, Vendrell M, Chang YT.Curr Opin Chem Biol. 2011;15:760–767; (c) Vendrell M, Zhai D, Er JC, Chang YT.Chem Rev. 2012;112:4391–4420; (d) Kowada T, Maeda H, Kikuchi K.Chem Soc Rev. 2015;44:4953–4972. 25. Bahia SBBB, Reis WJ, Jardim GAM, et al. Med Chem Commun.
2016;7:1555–1563.
26. da Cruz EHG, Silvers MA, Jardim GAM, et al.Eur J Med Chem. 2016;122:1–16. 27. (a) Kolb HC, Sharpless KB.Drug Discovery Today. 2003;8:1128–1137;
(b) Kolb HC, Finn MG, Sharpless KB.Angew Chem Int Ed. 2001;40:2004–2021; (c) Tornøe CW, Christensen C, Meldal M.J Org Chem. 2002;67:3057–3064; (d) Rostovtsev VV, Green LG, Fokin VV, Sharpless KB. Angew Chem Int Ed. 2002;41:2596–2599;
(e) Meldal M, Tornøe CW.Chem Rev. 2008;108:2952–3015.
28. (a) Lee JS, Kang NY, Kim YK, et al.J Am Chem Soc. 2009;131:10077–10082; (b) Vázquez-Romero A, Kielland N, Arévalo MJ, et al. J Am Chem Soc. 2013;135:16018–16021;
(c) Rezende LCD, Vaidergorn MM, Moraes JCB, Emery FS. J Fluoresc. 2014;24:257–266;
(d) Vendrell M, Krishna GG, Ghosh KK, et al. Chem Commun. 2011;47:8424–8426;
(e) Er JC, Vendrell M, Tang MK, Zhai D, Chang YT. ACS Comb Sci. 2013;15:452–457;
(f) Mendive-Tapia L, Zhao C, Akram AR, et al.Nat Commun. 2016;7:10940. 29. For review articles in fluorescent probe development, see: (a) Bessette A, Hanan
GS.Chem Soc Rev. 2014;43:3342–3405;
(b) Boens N, Leen V, Dehaen W.Chem Soc Rev. 2012;41:1130–1172; (c) Loudet A, Burgess K.Chem Rev. 2007;107:4891–4932; (d) Fernandez A, Vendrell M.Chem Soc Rev. 2016;45:1182–1196;
(e) De Moliner F, Kielland N, Lavilla R, Vendrell M. Angew Chem Int Ed. 2017;56:3758–3769.
30. (a) Rohand T, Dolusic E, Ngo TH, Maes W, Dehaen W. Arkivoc. 2007;10:307–324;
(b) Rohand T, Baruah M, Qin W, Boens N, Dehaen W. Chem Commun. 2006;266–268.
31. da Silva Júnior EN, de Souza MCBV, Fernandes MC, et al.Bioorg Med Chem. 2008;16:5030–5038.
32. Guimarães TT, Pinto MCFR, Lanza JS, Melo MN, et al. Eur J Med Chem. 2013;63:523–530.
33. da Silva Júnior EN, Menna-Barreto RFS, Pinto MCFR, et al.Eur J Med Chem. 2008;43:1774–1780.
34. Fieser LF, Fieser M.J Am Chem Soc. 1948;70:3215–3222.
35. Pérez-Sacau E, Díaz-Peñate RG, Estévez-Braun A, et al. J Med Chem. 2007;50:696–706.
36. da Cruz EHG, Hussene CMB, Dias GG, et al. Bioorg Med Chem. 2014;22:1608–1619.
37. Viegas Júnior C, Danuello A, Bolzani VS, Barreiro EJ, Fraga CAM.Curr Med Chem. 2007;14:1829–1852.
38. (a) Monks TJ, Hanzlik RP, Cohen GM, Ross D, Graham DG. Toxicol Appl Pharmacol. 1992;112:2–16;
(b) Portela MPM, Stoppani AOM.Biochem Pharmacol. 1996;51:275–283. 39. Abreu FC, Goulart MOF, Brett AMO.Electroanalysis. 2002;14:29–34. 40. Bolton JL, Trush MA, Penning TM, Dryhurst G, Monks TJ.Chem Res Toxicol.
2000;13:135–160.
41. Zafarullah M, Li WQ, Sylvester J, Ahmad M.Cell Mol Life Sci. 2003;60:6–20. 42. Mikhed Y, Daiber A, Steven S.Int J Mol Sci. 2015;16:15918–15953. 43. O’Brien PJ.Chem Biol Interact. 1991;80:1–41.
44. (a) Gros L, Saparbaev MK, Laval J.Oncogene. 2002;21:8905–8925;
(b) Feng D, Huang H, Yang Y, et al.Mutat Res Genet Toxicol Environ Mutagen. 2015;792:35–45.
45. (a) Begleiter A, Blair GW.Cancer Res. 1984;44:78–82; (a) Begleiter A, Walles SA.Cancer Lett. 1992;63:47–52;
(c) Saibu M, Sagar S, Green I, Ameer F, Meyer M. Anticancer Res. 2014;34:4077–4086.
46. (a) Speit G, Schütz P, Bonzheim I, Trenz K, Hoffmann H. Toxicol Lett. 2004;146:151–158;
(b) Kushwaha S, Vikram A, Trivedi PP, Jena GB.Mutat Res. 2011;726:242–250. 47. (a) Meister A.Pharmacol Ther. 1991;51:155–194;
(b) Er JC, Tang MK, Chia CG, Liew H, Vendrell M, Chang YT.Chem Sci. 2013;4:2168–2176;
(c) Zhang L, Er JC, Jiang H, et al.Chem Commun. 2016;52:9093–9096. 48. Patil NG, Basutkar NB, Ambade AV.Chem Commun. 2015;51:17708–17711. 49. (a) Zhang C, Zhao J, Wu S, et al.J Am Chem Soc. 2013;135:10566–10578;
(b) Magde D, Wong R, Seybold PG.Photochem Photobiol. 2007;75:327–334. 50.Sukhai MA, Prabha S, Hurren R, et al.J Clin Invest. 2012;123:315–328. 51. Baglole C, Bushinsky SM, Garcia TM, et al.Am J Physiol Lung Cell Mol Physiol.
2006;291:19–29.
52. Draper HH, Hadley M.Methods Enzymol. 1990;186:421–431. 53. Salgo MG, Pryor WA.Arch Biochem Biophys. 1996;333:482–488.
54. Lowry OH, Rosebrough NJ, Farr AL, Randall RJ.J Biol Chem. 1951;193:265–275. 55. Akerboom TP, Sies H.Methods Enzymol. 1981;77:373–382.
56. Singh NP, McCoy MT, Tice RR, Schneider EL.Exp Cell Res. 1988;175:184–191. 57. Hartmann A, Speit G.Toxicol Lett. 1997;90:183–188.