http://dx.doi.org/10.1590/2317-6431-2016-1728 ISSN 2317-6431
Fricative Phonemes Identification Index: proposal for
frequency compression evaluation
Índice Percentual de Identificação de Fonemas Fricativos:
proposta para avaliação da compressão de frequências
Letícia Pimenta Costa-Guarisco1, Francisco José Fraga2, Maria Cecília Martinelli Iório3
ABSTRACT
Purpose: Develop a test to evaluate frequency compression by identifying and applying fricative phonemes. Methods: A speech material was composed of 24 monosyllabic words, containing the phonemes /s, z, f, v, ∫, /. Eight subjects recorded words, for a total sample of 192 recordings. Low-pass filters were applied to words with cutoff points values of 1,5 kHz; 2 kHz e 3 kHz, in order to prevent sound detection in the filtered frequency bands, simulating hearing loss at high frequencies. The test was applied to ten normal hearing individuals, who had to listen to the word and identify it on a computer screen. Twelve response options were offered, fixing the vowel and varying the initial fricative phoneme and the presence of the final fricative /s/. The test consisted of 384 word repetitions, 192 with frequency compression. Responses were computed and compared using statistical tests. Results:
The identification of the phonemes was favored by the increase of the cutoff frequency, except in 3 kHz. There was improvement in the identification of fricative phonemes /∫, / with the use of frequency compression, however, for the other assessed phonemes (/f, v/ e /s, z/) no differences were found. Conclusion: The identification test of fricative phonemes was efficient and reliable. For the cutoff frequencies in 1,5 kHz e 2 kHz, the frequency compression was effective for the identification of the fricative phonemes /∫, /, however the identification of /s/ at the end was affected by the algorithm.
Keywords: Hearing loss, High-frequency; Speech discrimination tests; Hearing aids; Hearing loss, Sensorineural; Speech perception
RESUMO
Objetivo: Desenvolver um teste para avaliar a compressão de fre-quências por meio da identificação de fonemas fricativos e aplicá-lo.
Métodos: Organizou-se um material de fala composto por 24 palavras monossilábicas, contendo os fonemas /s, z, f, v, ∫, /. As palavras foram gravadas por oito sujeitos, totalizando uma amostra de 192 gravações. Aplicaram-se filtros passa-baixas nas palavras com frequências de cortes em 1,5 kHz; 2 kHz e 3 kHz, a fim de impedir a detecção sonora nas faixas de frequências filtradas, simulando perdas auditivas em frequ-ências altas. Aplicou-se o teste em dez indivíduos normo-ouvintes, que deveriam ouvir a palavra e identificá-la na tela de um computador. Foram oferecidas 12 opções de resposta, fixando a vogal e variando o fonema fricativo inicial e a presença da fricativa final /s/. O teste foi composto por 384 repetições de palavras, sendo 192 com compressão de frequên-cias. As respostas foram computadas e comparadas por meio de testes estatísticos. Resultados: A identificação dos fonemas foi favorecida pelo aumento da frequência de corte, exceto em 3 kHz. Houve melhora na identificação dos fonemas fricativos /∫, / com o uso da compressão de frequências, porém, para os demais fonemas avaliados (/f, v/ e /s, z/) não houve diferenças. Conclusão: O teste de identificação de fonemas fricativos se mostrou eficiente e confiável. Para as frequências de corte em 1,5 kHz e 2 kHz, a compressão de frequências foi eficaz para a iden-tificação dos fonemas fricativos /∫, /, porém, a identificação do /s/ final mostrou-se comprometida pelo algoritmo.
Descritores: Perda auditiva de alta frequência; Testes de discriminação da fala; Auxiliares de audição; Perda auditiva neurossensorial; Percepção da fala
Study carried out in the Postgraduate Course in Speech-Language Pathology and Audiology (Doctorate), Universidade Federal de São Paulo – UNIFESP – São Paulo (SP), Brazil.
(1) Course of Speech-Language Pathology and Audiology, Faculty of Medicine, Universidade Federal de Minas Gerais – UFMG – Belo Horizonte (MG), Brazil. (2) Engineering, Modeling and Applied Social Sciences Center (CECS), Universidade Federal do ABC – UFABC – Santo André (SP), Brazil.
(3) Course of Speech-Language Pathology and Audiology, Universidade Federal de São Paulo – UNIFESP – São Paulo (SP), Brazil.
Conflict of interests: No
Authors’ contribution: LPCGdesigning and delineating the study, collecting, analyzing and interpreting the data and writing the article; FJF conception and study design, analysis and interpretation of the data and revision of the article; MCMI conception and design of the study, analysis and interpretation of data.
Corresponding author: Letícia Pimenta Costa-Guarisco. E-mail: [email protected]
INTRODUCTION
Descending sensorineural hearing loss is often associated with words recognition difficulties, especially related to the detection and discrimination of fricative sounds, even with the use of hearing aids. In recent years, researchers have attributed this difficulty to the presence of dead regions in the cochlea, which makes certain cochlear regions unresponsive to sound stimulation due to the absence of inner hair cells or functional adjacent neurons(1). The description of the dead regions in the cochlea, put under new light the study of the algorithms for lowering frequency, such as compression, transposition, translation and composition, in an attempt to offer important speech cues contained in the high frequencies. By means of these techniques, the components of high frequencies are shifter towards lower frequencies, changing the sound spectrum of the sounds of high frequencies(2).
Because of their spectral characteristics, fricative sounds are the most impaired in descending sensorineural hearing loss, but also those that benefit most from frequency lowering techniques(3,4,5,6,7). However, sometimes the use of these resour-ces generates distortion, making it difficult to identify these phonemes(8,9). Acoustic information for speech recognition present itself in several ways such as changes in the perception of sound pressure level contained in the “temporal envelope” speech. This information makes it possible to differentiate voiced sounds from voiceless ones, as well as to provide cues regarding the articulatory mode (e.g. fricatives X plosives). However, for better performance in speech tasks, it is impor-tant to perceive the mode and articulatory point of the sounds, requiring good hearing at high frequencies(10).
Acoustic analysis of sounds has provided important infor-mation about sound perception and speech cues(11,12,13,14). The highest concentration of acoustic energy of the vowels is in the range of low frequencies (0.4 kHz a 0.5 kHz), located in the best region of the human audibility curve. Although vowels are naturally more intense than consonants, speech intelligibility depends on consonant sounds, whose energy distribution is small and reaches frequencies above 2 kHz. The speech energy concentrated in the high sounds is approximately, 20 dB to 35 dB weaker than the concentrated speech energy in 0.5 kHz. This may explain the difficulty that individuals with hearing loss at high frequencies present in speech recognition(14).
The consonants can be classified according to the point and mode of articulation, as well as sonority. The voiced pho-nemes present higher intensity, are more severe and shorter in duration, compared to their unvoiced pairs, which contributes to the discrimination of the sonority trait. Fricative sounds are characterized by passage of airflow through a narrowing in the mouth, sufficient to produce air turbulence. In Brazilian Portuguese, fricatives are o /f, v, s, z, ∫,/, which differ in ar-ticulatory point and sonority, maintaining the mode of sound production. The /f, v/ have the lowest pressure level of all
Portuguese consonants and their frequency range is quite broad, ranging from 1.2 kHz to 7 kHz. The medium ones /s, z/ are stronger, treble sounds with a frequency range above 4.5 kHz, reaching in Portuguese 8 kHz. The posterior ones, /∫, / also have a wide frequency range, similar to /s, z/, but with lower frequency range, between 2.5 kHz e 6 kHz(14).
Many variables may interfere with speech perception and discrimination, such as the phonemes involved (low and high frequency spectrum), the speaker’s voice (bass X treble) and the extent of hearing loss, or the degree of preservation of the high frequencies. In general, the fricative sounds are less intense and have important spectral tracks of high frequencies, above 2 kHz, which put them in an unfavorable situation in sloping descending hearing losses.
To control these variables and evaluate the perception of fricatives in hearing loss, this study aimed to develop a test of identification of fricative phonemes and to apply it.
METHODS
This research was developed after having been approved by the Research Ethics Committee of the Universidade Federal de São Paulo under the protocol number 0150/07. The participants signed the Informed Consent Form, with all the information before performing the proposed task. We present here an eva-luation tool to verify the Percentage Index of Identification of Fricative Phonemes (IPIFF in Portuguese) and, for that, an experimental comparative study was proposed.
Casuistry
The study was performed in normal hearing subjects with simulated hearing loss, and the identification of the words was analyzed and compared in two different listening situations: filtered speech and compressed speech.
In order to exclude cognitive and intellectual bias for inclu-sion in the sample, the individuals were selected, considering: - age between 18 and 40 years;
- minimum level of education compatible with complete high school education;
- familiarity with computer use; - Brazilian born;
- having no prior experience with the frequency compression algorithm.
GSI 38 Acoustic immittance meter. The normal hearing was considered when the air conduction thresholds were lower than 20 dB HL in the frequencies of 250 kHz to 8 kHz and type A tympanogram contralateral acoustic reflex present bilaterally ; while in Speech Audiometry, a speech recognition threshold (SRT) equal to or lower than 20 dB HL and Word Recognition Score (WR) of 92% or more, bilaterally.
Speech material and signal processing
For this evaluation, the following fricative phonemes were combined /s/, /z/, /f/, /v/, /∫/, //, in the initial position, with vowel phonemes /a/ e /i/, followed or not by the fricative phoneme /s/, in the final position, composing a sample of 24 monosyllables (Chart 1).
The phonetic combinations were made up of 18 existing words in the Portuguese language spoken in Brazil and six non--words (Houaiss, online1), marked with an asterisk in Chart 1. However, all these phonetic combinations were existing sylla-bles in the Portuguese vocabulary.
The original recording of the speech material and the editing were done in an engineering laboratory of a university. In a quiet room, an omnidirectional leadership headphone multimidia 3969 microphone was used, positioned in front of the speaker and at mouth level, connected to a HP®, special edition, model L2205nr portable computer. Words were recorded by eight na-tive Brazilian announcers, four of them women and four men, coming from different regions of Brazil. They were directed to speak clearly and maintain a constant level of voice throughout the recording. All 24 words were read by each speaker, with an approximate interval of two seconds between them. Recordings considered to be of unsatisfactory quality, such as changes in speech speed or distortions, were repeated. An original sample of 192 words (24 different words repeated by eight speakers) was gathered. The recorded speech material was scanned by the Matlab program at a rate of 16,000 samples per second. For each word, the cutoff points of the beginning and end were identified, removing the pauses. After the digitalization of the speech signals, a normalization of the sound pressure level was done in order to standardize the entire sample. Afterwards,
the speech signals were divided into frames with 75% over-lap between one frame and the next, to capture the transition dynamics between the different phonemes, in order to ensure greater trustworthiness of the digitized signals. For the analysis and processing the speech signals were passed from the time domain to the frequency domain.
Low-pass filters were applied to monosyllable words con-taining fricative phonemes in the speech samples processed by the frequency and original speech compression algorithm at three different cutoff frequencies, namely 1.5 kHz, 2 kHz and 3 kHz, in order to prevent noise in the filtered frequency bands, such as found in severe to profound descending hearing loss, suggestive of dead regions in the cochlea. For the appli-cation of the filters, the speech samples were processed in the frequency domain, zeroing the frequency ranges higher than the established cut point. A new normalization of the synthe-sized speech signals was necessary after the application of the frequency filters, due to the loss of acoustic information. To find out how the amplitude correction should be applied to the filtered signals, in order to restore the sound pressure level of the speech signal prior to filtering, we used a sound pressure level meter from the manufacturer Radio Shack, model 33-2055. The meter was placed in the position equivalent to the midpoint between the two ears, at a distance of one meter from the speaker and at zero degree azimuth. The A scale was used, with rapid responses to the measurements. For the measure-ment of sound pressure levels of the words, it was necessary to determine a mean reference value, obtained from the mean of the highest amplitude peak values of the words. A sample of 30 words used in the test, repeated three times, was selected to register the peak sound pressure. From the mean of the 90 repeated words, the mean reference value of the sound pres-sure level was determined. This procedure was applied in all listening situations. It was found that the synthesized signals required an additional amplification of 5 dB and 4 dB, for the application of filters with cut point frequencies at 1.5 kHz and 2 kHz, respectively.
A specific softwareprogram was developed to apply the Fricative Phoneme Identification Test (IPIFF), which contained all the processed speech material. The test consisted of 384
1Dicionário Eletrônico – dicionariohouaiss.com.br, 20 fev 2009.
Chart 1. Monosyllable words formed from the combination of the fricative phonemes / s /, / z /, / f /, / v /, / ∫ /, / /, in the initial position with the vowel phonemes / a / I /, followed or not by the fricative phoneme / s /, in the final position
Articulation point Labiodentals Group /f, v/
Palate Group /∫, /
Alveolar Group /s, z/
With /s/ end Faz Vás Chás Jaz Sás* Zás
Fiz Vis Xis Giz Sis* Zis*
Without /s/ end Fá Vá Chá Já Sá Zá*
Fi Vi Xi Gi* Si Zi*
words, the 24 monosyllables being spoken by eight speakers. Due to the fact that the study was performed in normal hearing subjects, it was needed to apply low-pass filters in all speech material in order to simulate the hearing loss. In this way the speech sample was composed by 192 records of low-pass filter modified speech and 192 records of frequency-compressed speech associated to filters.
Through the software, it was possible to file together subject data and test results obtained by session, containing the number of words heard, the correct answers and the time spent to com-plete the session. The percentage indexes of identification of fricative phonemes were presented in tables by the program for data analysis, considering the extent of hearing loss (simulated by low pass filters) and signal processing (using a frequency compression algorithm).
Test environment, equipment and calibration
The procedures of this research were carried out in an acous-tically treated room, containing a computer table and a comfor-table chair, located in front of the computer, to accommodate the listener. In order to calibrate and control the sound pressure level of the speech stimuli, the GSI-61 Grason-Statler® au-diometer was coupled to a Toshiba® portable computer type Pentium 4, Windows XP, with 512 of ram memory, containing the test, and a mouse to control the test.
The evaluation was done in free field, requiring a sound box Ventura® 400 W, model TNS. The audiometer was set to output on one channel, set up and calibrated for speaker. Thel 70 dB (A) was used, and it was verified the auditory comfort for subjects. The calibration procedure was performed in the environment in which the test was applied. For the calibration of speech signals, the Radio Shack sound pressure level meter, model 33-2055, was positioned at a midpoint between the two ears, at a distance of one meter from the loudspeaker and Zero degree azimuth, using the A scale, with rapid responses to the measurements. The audiometer dial was varied at 1 dB intervals to establish 65 dB (A) as the average reference value of the sound pressure level due to the fact that it is a listening level considered comfortable for normal listeners. In the two listening situations, there were variations of plus or minus 6 dB of the mean value. These variations were considered adequate since a difference of 30 dB can be observed in speech, between the more and the less intense sounds(15). There was similarity between the average values of the sound pressure level obtained in the two listening situations. For calibration of the audiometer, the calibration tone available in the program was used, adjusting the volume unit (VU) in the zero position in order to guarantee the reproducibility of the presentation conditions.
Procedures - Fricative Phoneme Identification Test
After the audiological evaluation, the subjects performed
the IPIFF test in the three listening conditions (in relation to the cutoff frequency), in the following order of execution: 2 kHz, 1.5 kHz and 3 kHz. This order was defined, considering the level of difficulty in understanding the words and offering, in the first session, an intermediate condition of intelligibility. The test was applied in three different sessions, on different days to avoid fatigue.
Before the test was started, training was offered so that the listeners could become familiar with the program and also prepare themselves, ensuring an understanding of the procedure. The training consisted of ten words, selected ran-domly by the program and worked exactly like the test, being performed before starting any session. The words were offered in a randomized way by the program, without any logical or predictable order, so as not to offer cues, characterizing a double-blind study, since neither the subjects evaluated nor the researcher knew what kind of signal processing was applied in each word.
The test was elaborated with multiple-choice responses, in which the listeners should identify the word heard, on the screen. This strategy was applied as a way to guarantee reliabi-lity in the analysis of the answers, due to the presence of some nonsense words and other unusual words. In such situations the oral reproduction of the word heard could be estimated by a previously known word and not by recognition of sounds. In addition, the word repetition strategy could generate confusion in the response, due to articulatory distortion or imprecision, compromising the analysis of the responses. Thus, we opted for the task of reading and visual identification of items as response. For each word pronounced, 12 response options were offered. As fricative sounds were the objects of analysis of this study, the monosyllables offered on the screen were formed by the same vowel (“a” or “i”), so that listeners could decide which initial fricative they were listening to and whether there was presence or absence of fricative / s / final. The distribution of words written on the screen also occurred randomly, so that listeners were not guided in making their choices. For this task, listeners would have to be skilled at detecting, recognizing the sound in an audible form and identifying the written form of the word heard so as to mark their choices.
The subjects were free to stop the test as many times as they wished, at any time for rest, for as long as they thought necessary. An interval was suggested every 20 minutes.
All words found were automatically filed by the program at time of testing. Thus, after the conclusion of each session, all 384 words were computed, allowing the visualization of correctly identified phonemes and changes and omissions or deletions occurred (in the case of the final fricative / s /).
Each phoneme was repeated 32 times in each listening condition, that is, the phonemic groups / f, v /, / ∫, / and / s, z / were presented 64 times in the filtered speech and 64 times in the compressed speech. These numbers were calculated in order to guarantee statistical significance. The fricative / s / final presented a rate of 96 occurrences, in each listening condition.
In order to neutralize the effect of random hits, with a chance of 1/6 (16.66%) for the initial fricatives and 1/2 (50%) for the fricative / s / final, the correct percentages were corrected by means of the following formula:
( – )
100
(100 – )
accident corrected
accident
PA A PA
A
= ×
Being, PA = Percentage of hits; PA corrected = Corrected hit percentage; A accident= Hits by accident
Statistical method
The results were described for the ability to correctly identi-fy the fricative phonemes, considering the following variables: signal processing (low-pass filter X frequency compression), cutoff frequency (1.5 kHz X 2 kHz X 3 kHz), Speaker (male X female) and phonemic group (/ f-v /, / ∫- /, / s-z / and / s / final). Corrected PAs were used in all analyzes. To evaluate the effect and interaction of the variables “signal processing” and “cutoff frequency”, the Anova Two-way statistical test was used and a 95% confidence level was adopted.
RESULTS
The mean duration of sessions was 75 minutes at 2 kHz, 60 minutes at 1.5 kHz and 40 minutes at 3 kHz. It is believed that because the tests started at 2 kHz, more time was spent in this session because of the unfamiliarity with the procedure.
The graphical visualization of the mean IPIFFs and stan-dard errors, for each cutoff frequency, considering the sex of the speakers both in compressed speech and filtered speech, is presented in Figure 1.
By applying the Anova Two-way statistical test, it was pos-sible to analyze the isolated effect of frequency compression and low-pass filters on the identification of fricative phonemes. It was also possible to evaluate if these two variables interact, that is, if they are dependent on each other. To study IPIFF, the individual corrected values were used (n=10). Considering the
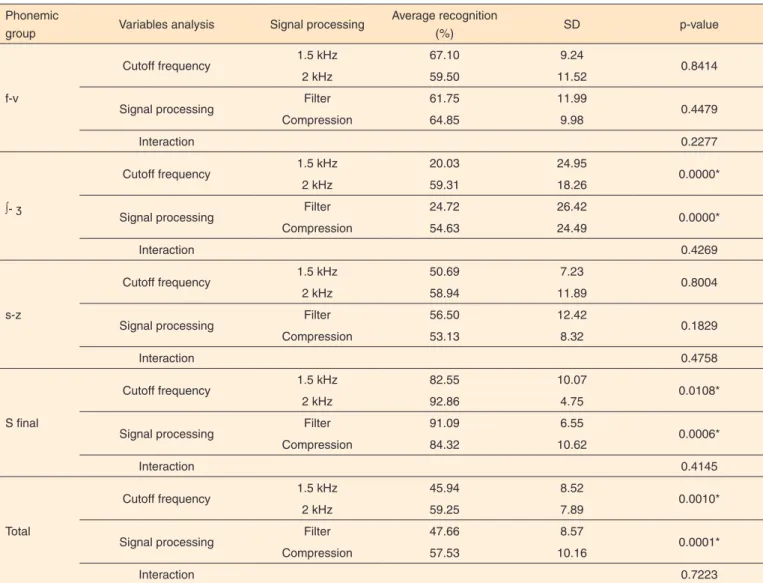
good performance in the identification of the fricative phonemes in the filtered speech, at 3 kHz, and the systematic worsening in all the analyzes with the frequency compression in this same cut, it was chosen to exclude this frequency from the study of effect and interaction between the variables. The mean values, standard deviations and p-value of the IPIFFs in each phonemic group according to the variables “signal processing” (filter X compression) and “cutoff frequency” (1.5 kHz and 2 kHz) are given in Table 1 (Table 1).
DISCUSSION
The simulation of hearing loss in normal hearing subjects is a common methodological practice in the researched literature, either through frequency filters(3,6,16,17,18), or by other resources, such as noise band vocoder or noiseband vocoder, to simulate cochlear implants(19,20). This type of experiment with normal--hearing individuals is advantageous, since it allows a specific evaluation of the algorithm, without influences of any other factors associated to sensorineural hearing loss.
A specific softwareprogram was developed to apply the Fricative Phoneme Identification Test IPIFF) test. Due to the presence of some nonsense words and other unusual words, the test was elaborated with multiple-choice answers, in which the listener had to identify the word heard on the computer screen. This type of task was also used in other studies(9,20).
In Brazilian Portuguese (BP), the affricate sounds appear only as allophones, that is, they do not generate phonological oppositions that lead to the distinction of meanings(14). Thus, only the BP fricative sounds were included in the word sample applied in this study.
It was considered that the methodology developed for the evaluation of the identification of fricative phonemes was effi-cient, providing reliable answers to the objectives proposed in this research. However, computer use and the need for good literacy may limit its use in clinical practice and research, since Brazil still deals with schooling deficits and poor access to computing, especially in the adult population.
In the audiological practice, the use of the computer may not be a good strategy, since it makes the evaluation long and complicated for patients that are unfamiliar with this technolo-gy. However, for the purpose of research, it is believed that the task of identifying words, rather than recognition, in which the individual must repeat the words heard, avoids bias in capturing the responses resulting from distorted speech, or in the proper marking of the results by the examiner.
Subtitle: IPIFF = Fricative Phonemes Identification Test
the phonemic identification (>80%), there was a marked dete-rioration in the identification of some phonemes whenever the frequency compression was used. This is due to the fact that for hearing loss starting from 3.5 kHz, frequency compression is not indicated, since frequencies above 3.5 kHz are not abso-lutely necessary for good speech intelligibility(6).
Therefore, in order to study the cutoff frequency, fre-quency compression and the interaction of these two variables (Table 1), the cutoff frequency at 3 kHz was neglected, since when the hearing impaired have good speech recognition rates, frequency compression will not probably improve their performance(16).
The analysis of the filter variable showed that the 2 kHz cutoff frequency favored phonemic identification, except for fricatives / f, v / and / s, z /, which did not present differences. It can be said that the variable has a significant effect on the average IPIFF, and in general, the greater the extension of the dead zone, the worse the results in the identification of the fricative phonemes. This reinforces the idea that the more
frequency information available, the better the IPIFF, even using frequency compression (this analysis refers only to the cut-off frequencies of 1.5 and 2 kHz).
These results have already been obtained in previous studies that evaluated the identification of consonants in the hearing impaired with moderate to severe losses at high frequencies using low pass filters, thus demonstrating that speech recogni-tion improves with available increasing range(21). In a study that simulated normal cochlear dead zones of different sizes and regions, the greater the extent of the dead zone, the worse the speech recognition, especially if it occurred in the frequency range from 1 kHz to 2 kHz(20).
In relation to the variable “signal processing”, the results showed an improvement in the identification of fricative phonemes / ∫, / with the use of frequency compression. This means that the use of this algorithm had a positive effect on the identification of this phonemic group when 1.5 kHz and 2 kHz filters were applied. For the other phonemes evaluated (/ f, v / e / s, z /), there were no differences between the two
Table 1. Interaction and effect of the variables “signal processing” (filter x compression) and “cutoff frequency” (1.5 kHz x 2 kHz)
Phonemic
group Variables analysis Signal processing
Average recognition
(%) SD p-value
f-v
Cutoff frequency 1.5 kHz 67.10 9.24 0.8414
2 kHz 59.50 11.52
Signal processing Filter 61.75 11.99 0.4479
Compression 64.85 9.98
Interaction 0.2277
∫-
Cutoff frequency 1.5 kHz 20.03 24.95 0.0000*
2 kHz 59.31 18.26
Signal processing Filter 24.72 26.42 0.0000*
Compression 54.63 24.49
Interaction 0.4269
s-z
Cutoff frequency 1.5 kHz 50.69 7.23 0.8004
2 kHz 58.94 11.89
Signal processing Filter 56.50 12.42 0.1829
Compression 53.13 8.32
Interaction 0.4758
S final
Cutoff frequency 1.5 kHz 82.55 10.07 0.0108*
2 kHz 92.86 4.75
Signal processing Filter 91.09 6.55 0.0006*
Compression 84.32 10.62
Interaction 0.4145
Total
Cutoff frequency 1.5 kHz 45.94 8.52 0.0010*
2 kHz 59.25 7.89
Signal processing Filter 47.66 8.57 0.0001*
Compression 57.53 10.16
Interaction 0.7223
* Significant values (p<0.05) - Anova Two-way test
variables. However, due to the evident improvement of the phonemes / ∫, /, the total IPIFF was influenced, presenting better results with the use of frequency compression.
The results demonstrated that the frequency compression helped the fricative perception / ∫, /, due to the fact that applying low pass filters with frequencies of cuts at 1.5 kHz and 2 kHz the necessary tracks for the correct identification of these sounds were lost. Thus, as the energy of these phonemes is concentrated at higher frequencies (approximately 3 kHz to 4.5 kHz), the frequency compression algorithm has brought this information to a lower frequency range, contributing to the identification of these sounds(6).
Due to the flatter spectral distribution of the fricatives / f, v /, the displacement of the spectral content of this region did not affect the perception of these consonants. In spite of the average spectral distribution of the phonemes / s, z / show that there are already some cues of these fricatives in the range of 3 kHz to 4.5 kHz, they are still insufficient to aid in the identi-fication of these phonemes, when there is the displacement of this frequency band to the audible area of the sound spectrum.
These results concur with the researched literature(9,22,23,24,25). In one study, the use of a frequency transposition algorithm in hearing impaired individuals with presence of dead regions in the cochlea, from 1.5 kHz, was efficient in the identification of the phoneme / ∫ / and, in general, there was no Identification of the other phonemes of the English language. In this same study, the authors demonstrated that the applied algorithm was effective to help in the detection of final fricatives / s, z /, when comparing the results obtained with the filtered speech (con-trol)(9). In Brazil, a recent study demonstrated that frequency compression in adults resulted in improved hearing, detection of phonemes / s, ∫ / and speech recognition, with progressive improvement over 12 months(22).
The present study found results that diverge from the aforementioned literature. The identification of the final /s/ demonstrated worsening of the compressed speech, showing the confusion of the listener in the detection of the final frica-tives. However, average percent hit rates remained above 84%. There was no interaction between the variables “signal processing” (use of frequency compression) and “cutoff fre-quencies” (dead zone extension), that is, they are both indepen-dent. Therefore, it can be said that the effect of the frequency compression is the same in the two simulated dead regions, 1.5 kHz and 2 kHz.
CONCLUSION
The Fricative Phoneme Identification Test (IPIFF) was effi-cient, reliable and practical to be used in researches that intend to evaluate the identification of fricative phonemes, as it allows a double-blind evaluation, with a significant sampling rate and easy results due to the processing of the data by the software. In addition, it allowed comparing the results obtained in different
listening situations, as in the case of the use of frequency com-pression. For clinical practice, the test was limited because it required a good level of literacy and patient familiarity with computers. In addition, the average time of application was 60 minutes, which may hamper its clinical use.
The test, under the conditions in which it was applied, sho-wed that the identification of phonemes was generally favored by increased cutoff frequency, both in filtered and compressed speech, except for 3 kHz, where there was a marked worsening in the Identification of phonemes by frequency compression. For the cut point frequencies at 1.5 kHz and 2 kHz, the fre-quency compression was efficient for the identification of the fricative phonemes, mainly of / ∫, /. However, the identification of the final /s/ was compromised by the algorithm.
REFERENCES
1. Moore BCJ. Dead regions in the cochlea: diagnosis, perceptual consequences and implications for the fitting of hearing aids. Trends Amplify. 2001;5(1):1-34. http://dx.doi. org/10.1177/108471380100500102
2. Vickers DA, Moore BCJ, Baer T. Effects of low-pass filtering on the intelligibility of speech in quiet for people with and without dead regions at high frequencies. J Acoust Soc Am. 2001;110(2):1164-75. http://dx.doi.org/10.1121/1.1381534
3. Hicks BL, Braida LD, Durlach NI. Pitch invariant frequency lowering with non–uniform spectral compression. Proceedings of the IEEE International Conference on Acoustics, Speech, and Signal Processing - ICASSP 81; 1981 Mar 30-Apr 1; Atlanta, Georgia. p. 121-4.
4. Muñoz CMA, Peggy BN, Rutledge JC, Gago A. Frequency lowering processing for listeners with significant hearing loss. Proceedings of the 6th IEEE International Conference on Electronics, Circuits and Systems - ICECS’99. 1999 Sep 5-8; Pafos, Cyprus. p. 741-4. 5. Wendy DE. Proportional frequency compression in hearing
instruments. Hear Rev. 2001 Feb 4 [citado 2 mar 2008]. Disponível em: http://www.hearingreview.com/issues/articles/2001-02_04.asp 6. Silva FJF, Marotta AM. Rebaixamento de frequências para
portadores de deficiência auditiva com perdas profundas em altas frequências. Rev Fonoaudiol Brasil. 2005;3:1-3.
7. Simpson A, Hersbach AA, McDermott HJ. Improvements in speech perception with an experimental nonlinear frequency compression hearing device. Int J Audiol. 2005;44(5):281-92. http://dx.doi. org/10.1080/14992020500060636
8. Simpson A, Hersbach AA, McDermott HJ. Frequency-compression outcomes in listeners with steeply sloping audiograms. Int J Audiol. 2006;45(11):619-29. http://dx.doi.org/10.1080/14992020600825508 9. Robinson JD, Baer T, Moore BCJ. Using transposition to improve
consonant discrimination and detection for listeners with severe high-frequency hearing loss. Int J Audiol. 2007;46(6):293-308. http:// dx.doi.org/10.1080/14992020601188591
11. Manrique AM, Massone MI. Acoustic analysis and perception of Spanish fricative consonants. J Acoust Soc Am. 1981;69(4):1145-53. 12. Behlau M. Uma análise das vogais do português brasileiro
falado em São Paulo: perceptual, espectrográfica de formantes e computadorizada de frequência fundamental [tese]. São Paulo: Universidade Federal de São Paulo; 1984.
13. Santos MTM. Uma análise espectrográfica dos sons fricativos surdos e sonoros do português brasileiro [monografia]. São Paulo: Universidade Federal de São Paulo; 1987.
14. Russo I, Behlau M. Percepção da fala: análise acústica do português brasileiro. São Paulo: Lovise; 1993.
15. Costa MJ. Desenvolvimento de sentenças em português: apresentação e estratégias de aplicação na audiologia. Santa Maria: Pallotti; 1998.
16. Turner CW, Hurtig RR. Proportional frequency compression of speech for listeners with sensorineural hearing loss. J Acoust Soc Am. 1999;106(2):877-86. http://dx.doi.org/10.1121/1.427103 17. McDermott HJ, Dean MR. Speech perception with steeply sloping
hearing loss: effects of frequency transposition. Br J Audiol. 2000;34(6):353-61. http://dx.doi.org/10.3109/03005364000000151 18. Silva FJF, Marotta AM. Frequency compression and frequency
shifting for the hearing impaired. Biomed Engineer. 2004;2. http:// dx.doi.org/10.2316/Journal.216.2004.2.417-808
19. Baskent D, Shannon RV. Speech recognition under conditions of frequency-place compression and expansion. J Acoust Soc Am. 2003;113(4):2064-76. http://dx.doi.org/10.1121/1.1558357
20. Baskent D, Shannon RV. Frequency transposition around dead regions simulated with a noiseband vocoder. J Acoust Soc Am. 2006;119(2):1156-63. http://dx.doi.org/10.1121/1.2151825 21. Simpson A, McDermott HJ, Dowell RC. Benefits of audibility for
listeners with severe high-frequency hearing loss. Hearing Res. 2005;210(1-2):42-52. http://dx.doi.org/10.1016/j.heares.2005.07.001 22. Marchesin VC, Iório MCM. Estudo dos efeitos de longo prazo da
compressão de frequências por meio de testes comportamentais verbais em adultos. CoDAS. 2015;27(1):37-43. http://dx.doi. org/10.1590/2317-1782/20152014165
23. Gresele ADP, Costa MJ, Garcia MV. Compressão de frequências no reconhecimento de fala de idosos com possíveis zonas mortas na cóclea. Rev CEFAC. 2015;17(1):223-37. http://dx.doi. org/10.1590/1982-021620155414
24. Robinson JD, Stainsby TH, Baer T, Moore BCJ. Evaluation of a frequency transposition algorithm using wearable hearing aids. Int J Audiol. 2009;48(6):384-93. http://dx.doi. org/10.1080/14992020902803138