*e-mail: [email protected]
Effect of Mixing Time on the Bed Density, and Microstructure of Selective
Laser Sintered (SLS) Aluminium Powders
Eyitayo Olatunde Olakanmi*
Institute for Materials Research, University of Leeds, Leeds, LS2 9JT, UK Present address: Department of Mechanical Engineering, Federal University of Technology, P. M. B. 65, Minna, Niger State, Nigeria
Received: June 2, 2010; Revised: October 26, 2011
The effect of mixing time on the homogeneity of aluminium powder blends and its SLS processed density and microstructure has been explored with a view to providing a basis for quality control. The degree of mixing of the powder particles was quantified in terms of the standard deviation of the bed density of the blended powder. The accuracy of the degree of mixing of aluminium powder’s blends obtained at the optimum blending time of 10 minutes is determined by the powder properties and this significantly influenced the powder’s bed density. By increasing the mixing time above 10 minutes, particulate agglomeration which inhibit good packing of powdered particles occurs, thus, sintered density decreases and porosity increases. Therefore, high porosity in the powder bed hinders effective thermal conductivity between aluminium particles, thereby, leading to deterioration of the sintered density and microstructure of the SLS processed samples.
Keywords: selective laser sintering (SLS), microstructure, thermal conductivity, agglomeration
1. Introduction
The challenge of delivering new customised products more quickly to meet customer’s demand in order to avoid delayed delivery has led to the emergence of the direct selective laser sintering process (SLS) or selective laser melting (SLM)1-4. SLS/SLM process was developed at the University of Texas in Austin in 1987. It allows generation of complex 3D multilayer parts by sintering together successive layers of powder materials on top of each other2. Comparison of the direct SLS process with the conventional powder metallurgy (P/M) and the spark plasma sintering (SPS) techniques reveals that SLS is preferable because it does not require moulds to produce intricate geometries and eliminates the post-processing steps thereby resulting in the shortening of the production cycle as well as the reduction of production costs5-8. Moreover, SLS has been applied to the production of patterns for investment casting, automotive and aerospace components9.
However, it had been reported that the manufacturing of engineering components in aluminium and its alloy powders via SLS process was bedevilled with problems such as balling, microstructural agglomeration, layer distortion, and surface roughness9. However, various SLS researchers had identified causes of and proffered solutions to these processing problems10-12. For instance, oxidation was identified as a barrier to the SLS processing of aluminium and its alloy powders10. To overcome the barrier that oxidation constitutes to SLS processing of aluminium powders, the effects of elemental Mg, Sn and Pb additions on the disruption of thermodynamically stable oxide films of unpressed prealloyed 2124 and 6061
Meanwhile, the importance of controlling individual powder properties (particle size and shape) and the bulk properties (packing density and flowability) to achieve increased efficiency during powder handling, packing and compaction had been emphasised13-14. This is with a view to obtaining substantial improvements in the density, microstructural, and mechanical properties of the laser sintered components. Moreover, the customisation of these properties can lead to changes in melt pool behaviour, sintering kinetics and laser absorptivity during selective laser sintering process15-16. Consequently, these necessitate that the effects of mixing time on the bed density, and microstructure of SLS processed aluminium powders are explored with a view to providing a basis for quality control. However, this study also describes the outcome of the measurement of the bulk powder properties as well as its effects on its physical properties which influence the powder’s bed density. Thereafter, in order to establish a reliable degree of consistency within and between the deposited layers of powders, calibration of the mixing time to obtain a homogeneous particle distribution in the powder following storage and before deposition was undertaken. The implications of the calibration of the mixing time for the bed density and microstructure of SLS processed powders are hereby analysed in regards to circumventing the challenge of agglomeration in the SLS processed microstructure of aluminium powders.
2. Experimental Approach
2.1.
Determination of the physical properties of
the as-received properties
The starting materials were aluminium powders AL-1 (air atomised), AL-2 and AL-5 (inert gas atomised), and AL-3 and AL-4 (water atomised) supplied by ALPOCO Limited. A Philips XL30 ESEM Scanning Electron Microscope (SEM) with link Systems EDX and image capture accessories was employed to observe the particle shape, chemical composition and homogeneity, surface morphology and microstructure of the starting powders. The particle size and distribution of each powdered sample as given by the supplier and confirmed by the sieve analysis is 45-75 µm. Prior to powder mixing, the particle size and distribution, loose apparent density, tap density, and flowability of the powders were determined according to the MPIF standard tests 05, 01, 46, and 03 methods as described in Olakanmi9.Each measurement was repeated three times with no significant variation in the apparent, and tapping densities and flowability observed between the repetitions, and it is the average of the three measurements which is reported9.
2.2.
Powder mixing procedure calibration of the
mixing time
Powder mixing procedure calibration of the mixing time was carried out according to Olakanmi9 by using a V-cone mixing device fabricated and described by Hauser17. The procedure adopted for the determination of the appropriate time for optimal blending of the powders was to compare the variation in the powder bed density with the mixing time17.
Each batch of powder was sub-sampled into a total of twelve samples according to Olakanmi9. Each of the twelve sub-samples drawn from one of the initial main samples was placed into separate v-cone mixers and blended for 10, 20, 30, 40, 50, and 60 minutes at a fixed rotational speed of 125 rpm. The times taken for the blending process was cumulative, therefore, at the termination of each time segment, the mixer was stopped and a small quantity of powder was taken for density measurements. It was ensured that the volume of the powder remaining in each of the five mixers at the end of one hour was more than the minimum mixing efficiency of 20% of the overall mixing volume. At the end of each mixing stage, a small quantity of powder taken from each cone-mixer was deposited into a machined nylon cup, 44.75 mm deep and 26.66 mm inner diameter. The nylon cup was placed in the build zone within the process chamber of the Leeds sinter station machine. Thereafter, powder sample was poured into the hopper and the powder shot placed in front of the wiper blade was spread across the build zone thereby filling the nylon cup. The mass of the powder, M, and its volume V, were measured. The bed density (ρbed) of each shot of powder was calculated as follows (Equations 1 and 2):
ρbed= M
V (1)
1– 2
M=m m (2)
where M is the mass of powder in the density cup, m1 is the mass of the density cup and the powder shot and m2 is the mass of the cup. The procedure for determining bed densities of each powdered sample was repeated three times and the average value was calculated.
2.3.
Fabrication of multiple layers
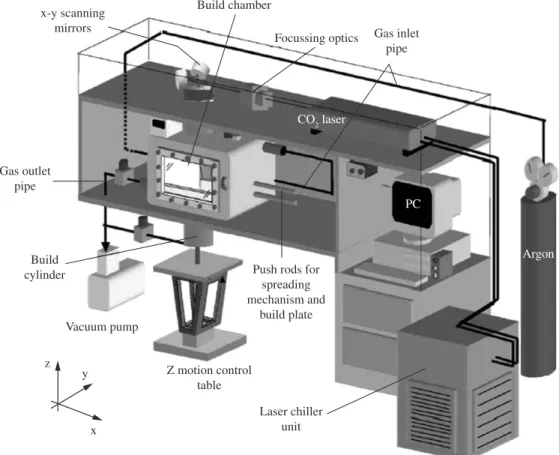
Multiple layer samples of 15 × 15 × 3 mm were produced in powders AL-2, AL-4, and AL-5 by a Synrad 240 W continuous wave (CW) CO2 laser of 0.6 mm beam diameter having Gaussian profile (Figure 1). These powders were chosen because they possessed the most desirable bed densities and other physical properties which determine the nature of microstructure obtainable in SLS processed metal powders9. Moreover, processing parameters consisting of laser power (150 W), scan rate (80 mm/s), scan spacing 0.1 mm, and layer thickness 0.25 mm were employed for testing because agglomerate development was minimal during single layer processing, thus providing for strongest metallurgical bonding between multiple layers18.
Figure 1. Schematic diagram of Leeds Sinter station SLS experimental machine.
3. Results and Discussion
3.1.
Properties of the as-received powders
3.1.1. Scanning electron microscopy (SEM) observation of aluminium powders particle shape
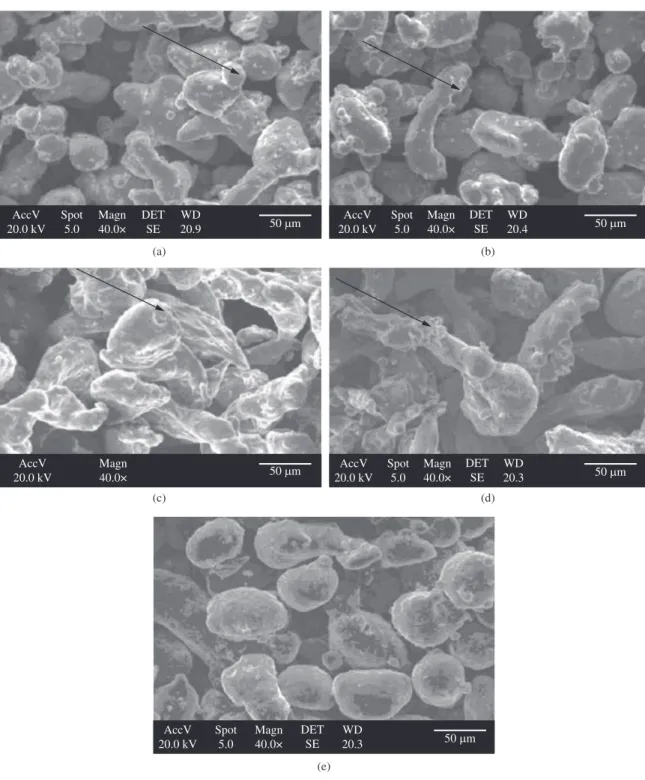
SEM images of the aluminium powders are presented in Figure 2. It can be seen that samples AL-1, AL-3, and AL-4 (Figure 2a, c and d) have irregular particle shapes, AL-2 powder has near spherical particles (Figure 2b) while sample AL-5 (Figure 2e) consists mainly of spherically shaped particles. Moreover, a careful observation of samples AL-1, AL-2, AL-3 and AL-4 suggests the presence of oxide clumps or islands on the surfaces of the particles of these powders (see the arrows in Figure 2a to d). In contrast, the surfaces of the particles of AL-5 are noted to be smooth. It is hereby speculated that the thickness of the oxide films present on the AL-5 powder is more uniform and is likely to have lesser content of oxygen than other powders.
3.1.2. Chemical composition of the as-received powders
Only elemental aluminium (Al) and oxygen (O) were detected in samples AL-1 and AL-2; Al, magnesium (Mg) and O were detected in samples AL-3 and AL-4 while Al, silicon (Si) and O were detected in sample AL-5. Due to ZAF (where –Z represents atomic number, –A absorption, and –F
for fluorescence), correction factor of ± 16 wt. (%), great caution needs to be exercised in interpreting the quantitative oxygen values reported in this study. Meanwhile, Table 1 confirms the earlier speculation (section 3.1.1) that the presence of oxide clumps or islands on the particles of AL-1, AL-2, AL-3 and AL-4 suggests the tendency for higher oxide contents in these powders than in AL-5 particles observed to have smooth surface. The presence of a much higher amount of oxygen in sample AL-1 than that found in the other samples should be noted, as the amount of oxygen present in the powders is expected to be one of the factors that influence the bed density, and flowability of the powders21.
3.1.3. Flowability of the as-received powders
Flowability results for the aluminium powders AL-1 through AL-5 are presented in Figure 3.
All the powders, with the exception of AL-1, could be described as free flowing since their flowability is 5 s/50 g or less.
3.1.4. Apparent and tap densities of the as-received powders
(a) (b)
(c)
(e)
(d)
Figure 2. SEM images showing the particle shape of the as-received monosized aluminium powders: a) AL-1; b) AL-2; c) AL-3; d) AL-4; and e) AL-5. Oxide islands on the surfaces of particles of AL-1, AL-2, AL-3 and AL-4 are identified by the arrows.
Table 1. Elemental composition of the powdered samples by EDS analysis (weight %).
Powdered samples
Aluminium Magnesium Silicon Oxygen
AL-1 84.1 – – 15.9
AL-2 93.5 – – 6.5
AL-3 89.3 5.7 – 5.0
AL-4 89.4 6.0 – 4.6
AL-5 85.1 – 12.1 2.8
3.1.5. Effect of powders’ characteristics on the physical properties of as-received aluminium powders
said to have contributed significantly to its poor flowability (30.0 s/50 g, see Figure 3). Since these should increase inter-particulate friction resulting in the formation of clusters that hamper free movement of particles when powders are flowing.
In contrast to the poor flowability of AL-1, the excellent flowability of samples AL-2, AL-3, AL-4 and AL-5 could be explained as a consequence of lower amount of surface oxide film (Table 1) present on the surfaces of the particles and of their degree of sphericity. For example, samples AL-2, AL-3, and AL-4 have irregularly shaped powder particles (Figures 2b-d), and very low surface oxide present (6.5, 4.6 and 5.0 wt. (%) respectively as presented in Table 1). Perhaps, the rationale is that only the low surface oxide content in each of these powders is likely to be the favourable factor that could have promoted improved flowability recorded for these powders. Moreover, since AL-3 has lower apparent density than other powders, it may be reasoned that irregularity of particle shape alone cannot explain the low flowability of AL-1 and that the influence of oxide content may be more significant. The spherical particle shape (Figure 3e) and fairly low surface oxide content (2.8 wt. (%) as recorded in Table 1) of sample AL-5 indicate that all these properties favour the excellent flowability reported for it (Figure 3).
The production techniques of each of these powders (section 2.1) could be said to have influenced their flow behaviour because they determine the particle shape as well as the degree of surface oxidation of the powder’s particles22-24. Therefore, it may be deduced that air atomisation technique employed for the production of AL-1 imparted the highest amount of oxidic contamination on its particles when compared with water (AL-3 and AL-4) and gas (AL-2 and AL-5) atomisation techniques. In conclusion, these findings suggest the most predominant factor controlling the flowability of aluminium powders is the amount of surface oxide present on the particle’s surface in the powder. The potential influence of environmental factors as a result of exposure of powders to humidity may be discounted because the powders were carefully handled to minimise this effect.
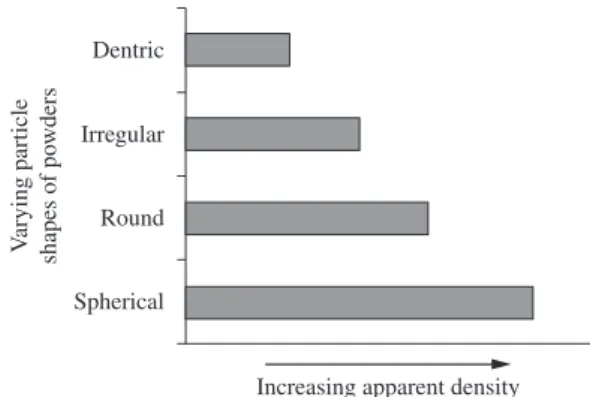
Examination of the results obtained for the apparent densities (Figure 4) of these powders suggests that they are influenced mainly by the particle shape, with AL-5, having spherical particles giving the highest value of 1.42 g.cm–3 (52.7% of the density of wrought aluminium)21. Therefore, it may be deduced that the higher the apparent density of a powder, the higher the degree of its sphericity (Figures 2, 4, and 6).
Moreover, the tapping densities should depend on the powder characteristics such as particle shape, particle porosity and particle size distribution. The particle size distribution and average particle size of all the powders are comparable and falls within the same range of +45 to –75 µm, as reported in section 2.1, so this may be excluded. Figure 7 reveals that as the apparent density increases, tapping density also increases whereas Table 2 shows that the lower the apparent density, the higher the percentage increases in density on tapping. These findings imply that irregularly shaped powder particles found in samples AL-1
Figure 3. Flowability of the original aluminium powders.
Figure 4. Apparent density of the original aluminium powders.
Figure 5. Tapping density of the original aluminium powders.
to AL-4 which have lower apparent and tapping densities do bridge or arch during loose packing. Upon tapping, re-arrangement of particles can overcome this, leading to a significant reduction in porosity. In the case of sample AL-5, a smaller percentage increase in density was obtained upon tapping. This is easily explained by the fact that its spherical particles pack more closely, without bridging or arching, as the particles move easily past each other because of their smooth surfaces as observed in the high flowability values.
3.2.
Effect of mixing time calibration on the bed
density of aluminium powders
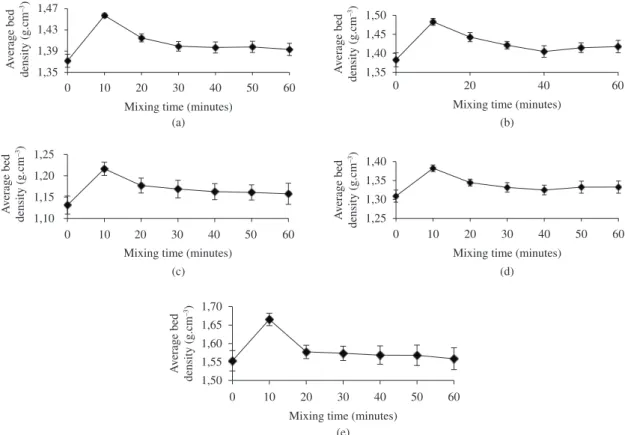
The results showing the variation in the average bed density with the duration of mixing for each of the five monosized as-received aluminium powders are shown in Figure 8. The length of the error bars represents the variability in the results for all samples, including those taken from different depths within the storage container. It is clear from Figure 8 that the results for each of the as-received aluminium powder batches are similar, revealing a peak in the average powder bed density, and a minimum in density variation, after 10 minutes of mixing. Although, the powder bed density decreases as the mixing time increases beyond the peak, this fall is not as sudden as the initial increment between the starting time and the peak time. The maximum variation in bed density occurs in as-received samples and generally rises with mixing time for the monosized powders. The maximum noted for the unmixed powders could be attributed to particle segregation as a consequence of transportation and prolonged storage. The continuing increase in variation up to 60 minutes could be ascribed to over mixing, which triggers particle re-segregation. These findings are strongly supported by and Hauser17 and German25 who both claimed that, provided the mobility
and density of powder particles vary as a consequence of their forms and sizes, the influence of external forces may cause segregation.
In addition, Figure 8 shows that the average powder bed density recorded at each mixing time interval decreases as the particle shape of the powder becomes less spherical, but the variation decreases. According to Hauser17, the variation in powder bed density increases as the average powder bed density decreases for corresponding mixing time as the batch powder sizes decreases.
The discrepancy between the relationship of the variation in the powder bed density with average powder bed density for powders of varying particle shapes employed in this research, and that of Hauser17 could be attributed to problems of powder deposition. A careful observation of Figure 8 shows that values obtained for powder bed density at some instances for all the powders are only slightly higher than their reported apparent densities. In these cases, it is suspected that the powder deposition mechanism might have not properly delivered the powder to enable efficient packing across the powder bed. Therefore, it may be suggested that the improper and inconsistent delivery and packing of powder’s particles across the powder bed appears to have affected the variations obtained in the powder bed density such that no definite relationship could be established between the variation in the powder bed density and the average powder bed density of the experimental powders.
Meanwhile, it is now evident that the discrepancy between the relationships of the variation in the powder bed density with average powder bed density for powders may also be explained by the differences in the powder packing behaviour in the bed as a consequence of lesser degree of powder’s particle sphericity and increasing surface oxide content of the powders. For AL-1, the combined effects of lower degree of particle sphericity and highest oxide content are responsible for non-existence of a relationship of the variation in the powder bed density with its average powder bed density. In the case of AL-3, its lowest degree of particle sphericity as evident by its apparent density could also explain the same behaviour it had displayed as AL-1. It is now clear that the higher the sphericity of the particle shape of a powder, the higher the likelihood of the increased variation in the powder bed density with average powder bed density as seen in the case of AL-2, AL-3 and AL-4. This is because higher degree of sphericity of powder’s particle provides for close packing of the particles in bed without arching or bridging, during powder deposition. Moreover, the choice of 10 minutes before processing in the sinter station was made for powdered samples AL-2, AL-4, and AL-5 in order to give the least variability between the deposited powder layers. The choice of these powder mixing durations was not made on the premise of the highest bed density because this is largely indeterminate during the SLS/ SLM process, as pointed out by Hauser17.
3.3.
Effect of mixing time on the density and
microstructure of laser sintered aluminium
powders
Figure 9 provides insight into the effect of the mixing time calibration on the degree of densification experienced
Table 2. Comparison of density increases for the original powders.
Powder designation
Apparent density (g.cm–3)
Tap density (g.cm–3)
% Increase
AL-1 1.22 1.59 30.20
AL-2 1.32 1.66 25.42
AL-3 1.04 1.30 24.26
AL-4 1.28 1.61 25.53
AL-5 1.42 1.73 21.75
Figure 8. Average powder bed density as a function of mixing time for monosized powder batches: a) AL-1; b) AL-2; c) AL-3; d) AL-4; and e) AL-5.
Figure 9. Effect of mixing time on the sintered density of the blended aluminium powders.
Figure 10. Correlational relationship between the average sintered density and the powder bed density.
by laser sintered aluminium powders AL-2, AL-4, and AL-5. It is clear that sintered density is optimised at the instance each of the powders was mixed for 10 minutes. The reduction in the sintered density observed for mixing times of 0, 20, 30, 40, 50, and 60 minutes could be attributed to the possibility of the occurrence of particle segregation as a consequence of transportation and prolonged storage
(at 0 minutes) and the continuing increase in particle re-segregation as the mixing time reaches 60 minutes due to over mixing. This is suggestive that the occurrence or the absence of particle segregation in the powder bed influences the particle packing arrangement in the powder bed. Possible explanation for this is that particle segregation reduces the bed density of powders, thus, inhibiting effective particle contact upon which powder bed thermal conductivity depends26.
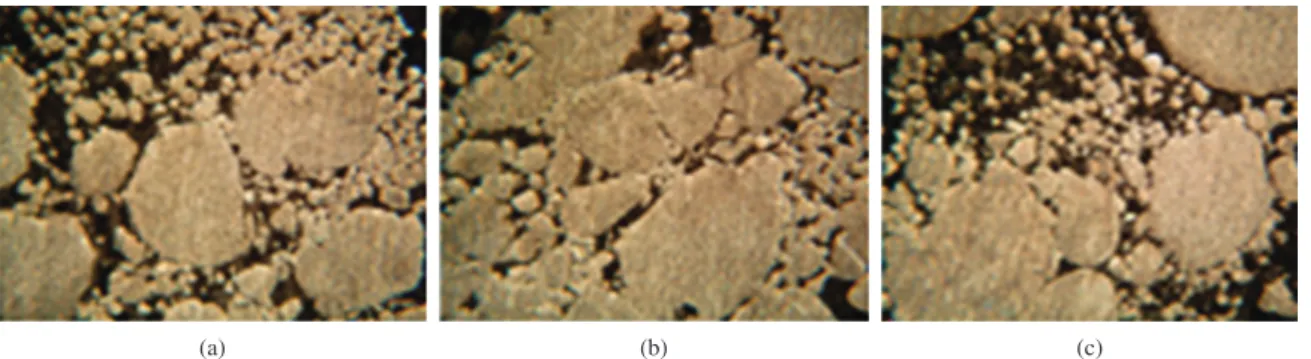
Figure 11. Microstructure of AL-2 powder blended at a) 0; b) 10; and c) 60 minutes.
Figure 13. Microstructure of AL-5 powder blended at a) 0; b) 10; and c) 60 minutes.
Figure 12. Microstructure of AL-4 powder blended at a) 0; b) 10; and c) 60 minutes. that the sintered density of the blended samples increases
as the bed density increases. This claim is supported by the correlation co-efficient of 0.957 obtained for Figure 10 which suggests a strong co-relationship between the sintered density and the bed density. Furthermore, the occurrence of voids on the powder bed as a consequence of particle segregation at 0, 20, 30, 40, 50, and 60 minutes duration of mixing is noted to have resulted in the sintering of particles as evident by lower values of sintered density recorded at these instances (Figures 8 and 9). In contrast to 10 minutes mixing duration, it is clear that there is a significant reduction in the formation of voids on the powder beds of each of the powders as illustrated by increased sintered density recorded at this instance (Figures 8 and 9).
Figures 11, 12, and 13 lend credence to the earlier speculation that particulate segregation resulting in the formation of voids on the powder bed caused reduced sintered density and deteriorate the microstructures of the laser sintered samples at mixing time other than 10 minutes27-28. It is clear that the microstructures of AL-2, AL-4, and AL-5 are optimised only when they were mixed for only 10 minutes. Most improved microstructures correlating to the most improved sintered density at the instance each powder was mixed for only 10 minutes confirm this (Figures 9, 11b, 12b, and 13b).
cause variation in its powder bed density is also influential on the nature of the sintered density and microstructure obtained after SLS processing (Figures 7-13). Variation in apparent, tapping, and bed densities of these powders suggests the possibility of variation in the degree of sphericity of the particles of each of the monosized powders21,29. Meanwhile, it is hereby envisaged that differential sintered densities and microstructure obtained for the powders at the instance they were mixed for 10 minutes could not only be accounted for by the variation in the degree of sphericity of the particles of each monosized powder. Therefore, further analysis will be carried out in future study with a view to gaining a detail understanding of the effect of the oxide contents and chemical constitution of each of the powder on their laser sintered microstructure as well as densification mechanism.
4. Conclusions
•The flow behaviour of the monosized aluminium powders are found to be primarily influenced by differences in the amount of surface oxide present on the particle’s surface in the powder.
•It is now clear that the relationships of the variation in the powder bed density with average powder bed density for powders may be explained by the differences in the powder packing behaviour in the bed as a consequence of degree of powder’s particle sphericity and surface oxide content of the powders. •It was discovered that by increasing the mixing time, particulate agglomeration which inhibit good packing of powders occurs, thus, sintered density decreases and porosity increases.
•The correlational relationship between the sintered density and bed density of powders and microstructural evidences support the inference that high porosity in the powder bed hinders its effective thermal conductivity properties as the voids become a barrier to the heat conduction from one particle to another particle, thereby, leading to deterioration of the sintered density and microstructure of the SLS processed samples.
Acknowledgement
The author would like to thank the Commonwealth Scholarship Commission in the UK for the sponsorship of this study at the Institute for Materials Research, University of Leeds. I am also grateful to both Dr Bob Cochrane (Institute for Materials Research, University of Leeds) and Professor Kenny Dalgarno (School of Manufacturing and Systems Engineering, Newcastle University) for their insightful guidance and suggestion in carrying out this study.
References
1. Wang CY. Rapid Manufacturing: Overview. 2002. Available from: <http://www.csa1.co.uk/discoveryguides/rapidman/ overview.php>. Access in: 23/04/2010.
2. Tang Y, Loh HT, Wong YS, Fuh JYH, Lu L and Wang X. Direct laser sintering of a copper-based alloy for creating three-dimensional metal parts. Journal of Materials
Processing Technology. 2003; 140(1-3):368-372. http://dx.doi. org/10.1016/S0924-0136(03)00766-0
3. Gu D and Shen Y, Balling phenomena in direct laser sintering of stainless steel powder: Metallurgical mechanisms and control methods. Materials & Design. 2009; 30(8):2903-2910. http://dx.doi.org/10.1016/j.matdes.2009.01.013
4. Dong L, Makradi A, Ahzi S and Remond Y. Three-dimensional transient finite element analysis of the selective laser sintering process. Journal of Materials Processing Technology. 2009; 2009(2):700-706. http://dx.doi. org/10.1016/j.jmatprotec.2008.02.040
5. Mumtaz KA, Erasenthiran P and Hopkinson N. High density selective laser melting of Waspaloy. Journal of Materials Processing Technology. 2008; 195(1-3):77-87. http://dx.doi. org/10.1016/j.jmatprotec.2007.04.117
6. Bertol LS, Kindlein Júnior W, Da Silva FP and Aumund-Kopp C Medical design: Direct metal laser sintering of Ti-6Al-4V. Materials & Design. 2010; 31:3982-3988. http://dx.doi. org/10.1016/j.matdes.2010.02.050
7. Mol’enat G, Durand L, Galy J and Couret A. Temperature Control in Spark Plasma Sintering: An FEM Approach. Hindawi Journal of Metallurgy. 2010. http://dx.doi. org/10.1155/2010/145431
8. Seeber A, Klein AN, Speller CV, Egert P, Weber FA and Lago A. Sintering unalloyed titanium in DC electrical abnormal glow discharge. Materials Research. 2010:13(1):99-106. http://dx.doi.org/10.1590/S1516-14392010000100020 9. Olakanmi EO. Direct selective laser sintering of aluminium
alloy powders. [Tese]. Leeds: Institute for Materials Research, University of Leeds; 2008.
10. Sercombe TB. On the sintering of uncompacted, pre-alloyed Al powder alloys. Materials Science and Engineering. 2003; A341:163-168.
11. Louvis E, Fox P and Sutcliffe CJ. Selective laser melting of aluminium components. Journal of Materials Processing Technology. 2011; 211:275-284. http://dx.doi.org/10.1016/j. jmatprotec.2010.09.019
12. Buchbinder D, Schleifenbaum H, Heidrich S, Meiners W and Bültmann J. High Power Selective Laser Melting (HP SLM) of Aluminium Parts. Physics Procedia. 2011; 12:271-278. http:// dx.doi.org/10.1016/j.phpro.2011.03.035
13. German RM. Metal Powder Injection Moulding. In: Jenkins I and Wood JV. Powder Metallurgy: An Overview. London: The Institute of Metals; 1991. 102 p.
14. Thummler F and Oberacker R. Introduction to Powder Metallurgy. London: The Institute of Materials; 1993. 332 p. 15. Van der Schueren B and Kruth JP. Powder deposition in selective metal powder sintering. Rapid Prototyping Journal. 1995; 1(3):23-31. http://dx.doi.org/10.1108/13552549510094241 16. Niu HJ and Chang ITH. Liquid phase sintering of M3/2
high speed steel by selective laser sintering. Scripta Materialia. 1998; 39(1):67-72. http://dx.doi.org/10.1016/ S1359-6462(98)00126-2
17. Hauser C. Selective Laser Sintering of a stainless steel poder. [Tese]. Leeds: School of Mechanical Engineering Leeds, University of Leeds; 2003.
Properties (Materials Issues in Additive Powder-Based Manufacturing Processes Symposium).
19. Dewidar MM, Dalgarno KW and Wright CS. Processing conditions and mechanical properties of high-speed steel parts fabricated using direct selective laser sintering. Journal of Engineering Manufacture. 2003; 217 (part B):1651-1662. 20. Olakanmi EO, Cochrane RF and Dalgarno KW. Densification
mechanism and microstructural evolution in selective laser sintering of Al-12Si Powders. Journal of Materials Processing Technology. 2011; 211(1):113-121. http://dx.doi. org/10.1016/j.jmatprotec.2010.09.003
21. Carson JW and Pittenger BH. Bulk properties of powders. In: Eisen WB. ASM handbook. Materials Park: ASM International; 1998. p. 287. v. 7: powder metal technologies and applications.
22. German RM. The importance of particle characteristics in powder injection moulding. Reviews in Particulate Materials. 1993; 1:109-160.
23. German RM. Powder Metallurgy Science. 2nd. ed. Princeton: Metal Powder Industries Federation; 1994. 472 p.
24. German RM. Sintering Theory and Practice. New York: Wiley-Interscience; 1996. 558 p.
25. German RM. Powder Metallurgy of Iron and Steel. Chichester: John Wiley & Sons Inc; 1998. 496 p.
26. Gusarov AV, Laoui T, Froyen L and Titov VI. Contact thermal conductivity of a powder bed in selective laser sintering. International Journal of Heat and Mass Transfer. 2003; 46(6):1103-1109. http://dx.doi.org/10.1016/ S0017-9310(02)00370-8
27. Oh S-T, Sekino T and Niihara K. Effect of particle size distribution and mixing homogeneity on microstructure and strength of alumina/copper composites. Nanostructured Materials. 1998; 10(2):327-332. http://dx.doi.org/10.1016/ S0965-9773(98)00072-5
28. Yi CR. Effect of particle size and milling process on the microstructure and thermal properties of copper silicon carbide (CuSiC) composites for electronic packing application, Bachelor of Engineering thesis, School of Materials Engineering Universiti, Malaysia Perlis, 2008.