Inluence of Surface Crystalline Structures on DSC Analysis of PTFE
Vinicius Fiocco Sciutia*, Caiuã Caldeira Meloa, Leonardo Bresciani Cantoa, Rodrigo Bresciani Cantoa
Received: March 28, 2017; Revised: June 21, 2017; Accepted: July 03, 2017
The physical and mechanical properties of polytetraluorethylene (PTFE) are greatly dependent on the degree of crystallinity and this is extremely important for the modeling of PTFE processing which is complex and costly. Diferential scanning calorimetry (DSC) is one of the most important techniques for the determination of the degree of crystallinity and powder granules of the sample are generally used in the analysis. This procedure provides samples with a high surface-to-volume ratio, resulting in the formation of a considerable number of surface crystalline structures, called warts, along with the bulk crystallization, as shown by scanning electron microscopy. The presence of warts has a signiicant efect on the PTFE melting enthalpy and thus hinders the correct estimation of the degree of crystallinity of industrial PTFE parts, in which bulk crystallization prevails. In this study, we propose a procedure which does not lead to the formation of warts in the DSC sample and thus allows a more accurate determination of the melting enthalpy (or the degree of crystallinity) of industrial PTFE parts. We demonstrate that samples must be extracted from the core of dense (well-pressed) parts previously sintered in an oven, and the use of powder granules and/or sintering in DSC is not recommended.
Keywords: PTFE, DSC, degree of crystallinity, surface crystallization, warts.
* e-mail: [email protected]
1. Introduction
Components and parts made of polytetraluorethylene (PTFE) are expensive due to the high cost associated with this polymer and its processing. Because of its high melt viscosity (109 to 1011 Pa s-1 at 360 oC1), PTFE parts are not manufactured via the traditional melt processing routes for thermoplastic polymers. Instead, PTFE powder granules are cold pressed followed by hot sintering1-5. Sintering is
usually carried out at temperatures up to 375 oC (i.e., above the PTFE melting temperature) for between 10 and 10,000 min depending on the size of the specimen, followed by cooling at slow rates, typically in the range of 0.1 to 0.8 oC
min-1, to avoid the formation of microcracks in the specimen.
As-received PTFE has a high melting temperature (Tm) of
around 342 oC and high degree of crystallinity, in the range
of 89 to 98%2,3. After sintering, T
m is reduced to ≈ 327 oC and the degree of crystallinity decreases to values between 38 and 53% depending on the conditions6. This is attributed to the high degree of conformational constraint of the PTFE chain during cooling from the melt, which hinders the crystallization7.
The outstanding properties of this polymer allow PTFE parts to be used under critical service conditions. In the automotive industry, bearings and bushings made of PTFE are used without additional lubrication because of the good mechanical properties of the polymer along with its low friction coeicient when in contact with a range
of surfaces8. The high electrical resistivity and thermal
stability of PTFE make it suitable for use in electrical wire and cable insulations2. In the chemical industry, gaskets, vessels, valves and pipes are made of PTFE because of its chemical inertness and high thermal stability, among other properties. All of these PTFE properties are signiicantly afected by the degree of crystallinity after sintering6,9,10. The performance of PTFE specimens in mechanical testing is also inluenced by the degree of crystallinity6,9-12. Rae and
Dattelbaum9, for instance, observed an increase of 18% in the yield stress of PTFE in compression tests with an increase in the degree of crystallinity from 32 to 48%. The tensile behavior of PTFE has also been found to be afected by the degree of crystallinity6. Samples with a low degree of crystallinity present higher stifness and larger deformations than those with a high degree of crystallinity. In the early stages of tensile loading, the PTFE chains in the amorphous phase align in the tensile loading direction. After reaching a certain amount of deformation, the PTFE crystals can
slide, stretch and orientate in the direction of the tensile
axis6. With regard to the fracture behavior, PTFE undergoes localized plastic deformation in the vicinity of microvoids above 19 oC, leading to the formation of ibrils, which results in the dissipation of energy11. An increase in the degree of crystallinity of PTFE reduces the ibrillation, thus decreasing the fracture toughness of the material13. In this regard, the crack surface displacement mode plays an important role, that is, the formation of ibrils is more pronounced in mode-I than mode-II (shear)14. The creep behavior of PTFE are also afected by the degree of crystallinity15, along with the
aDepartamento de Engenharia de Materiais, Programa de Pós-Graduação em Ciência e Engenharia de
coeicient of thermal expansion3. All of the above-mentioned properties are relevant for the design of PTFE components and parts, which emphasizes the importance of the accurate estimation of the crystallinity degree of PTFE as a function of the heat cycle imposed during sintering. The fact that PTFE processing is complex and costly, along with the signiicant dependence of the mechanical properties on the degree of
crystallinity, has motivated researchers to carry out studies
on the characterization and computational modeling of cold pressing16,17 and sintering3,18,19.
In several studies reported in the literature diferential scanning calorimetry (DSC) was used to investigate the melting3-5,7,16,20-23 and crystallization3-5,15,16,19-26 of PTFE.
Lau and co-workers24 used DSC to measure the heat capacity and phase-change enthalpies of two sets of PTFE samples with diferent degrees of crystallinity in the temperature interval of -103 oC to 427 oC. The authors do not mention any processing involving pressing or sintering before the analysis, suggesting that as-received powder granules were used. The as-received samples were considered to be 100% crystalline and a less crystalline sample was obtained through heat treatment at 352oC for 15 min followed by cooling at
43 oC min-1 prior to the analysis. The authors suggested that the data reported could be used to update and expand the information on the thermodynamic properties of PTFE available in the literature.
Mantuano and Gomes5 studied the efects of cold
pressing and sintering time on the microstructure of PTFE parts. They obtained cylinder-shaped specimens by isostatic pressing and disc-shaped samples were extracted from these cylinders. To simulate the sintering, the discs were heat-treated by DSC at temperatures between 365 and 380 oC for time intervals of 5 to 60 min. Thereafter, the crystallization enthalpy was measured by DSC to estimate the dependence of the degree of crystallinity on these sintering conditions. The degree of crystallinity of PTFE was found to decrease with an increase in the sintering time. However, this trend could not be explained by the authors.
Canto and co-workers3 subjected PTFE powder granules to a nonstandard cyclic DSC test consisting of successive heating and cooling cycles at between 240 and 360 °C with diferent cooling rates. The degree of crystallinity of PTFE was estimated from the ratio between the enthalpies of crystallization and subsequent melting. This strategy allowed the degree of crystallinity to be estimated as a logarithmic function of the cooling rate from a single sample. A slight nonlinearity was obtained but the authors did not address this and applied a linear itting.
Strabelli and co-workers4 investigated the inluence of sintering variables on the microstructure and degree of crystallinity of isostatically cold-pressed PTFE parts. Sintering was carried out in an air-circulating oven at three diferent temperatures (360, 375, 390 oC) for times ranging from 10 to 10,000 min. The degree of crystallinity was estimated by
density measurements and DSC using samples taken from the core of the parts. Data obtained from these two techniques showed good agreement. For these time intervals, the degree of crystallinity was found to increase during the sintering for samples heat-treated at 360 and 375 oC, while the sample
sintered at 390 oC showed a maximum at 1,000 min.
Ganguly and Lesser23 investigated the crystallization of PTFE subjected to cyclic thermal loading and isothermal treatment by DSC. Samples were cold pressed in two steps until reaching 2.15 g cm-3. Sintering was performed by
DSC applying a relatively long time interval (up to 2,000 min). It was found that the melting enthalpy of the PTFE samples increased with sintering time. Moreover, the melting enthalpies of the samples subjected to cyclic thermal loading were equivalent to those of the samples subjected to an isothermal condition, for the same sintering time.
Glaris and co-workers25, using scanning electron microscopy
(SEM), observed the presence of aspherical structures, referred to as warts, on the external surface of PTFE samples subjected to heat treatment in an oven. The heat treatment was replicated in a DSC instrument and the melting enthalpy was measured. The degree of crystallinity was estimated from the ratio between the enthalpies of two subsequent melting events. The authors found that an increase in the degree of
crystallinity was associated with an increase in the formation
of warts, suggesting that these structures are highly crystalline. Moreover, the number of warts formed and their size were dependent on the thermal history of the samples. The authors concluded that the warts are formed by stress relaxation as a result of the very low surface energy of PTFE.
Gamboni and co-workers26 showed that the warts are formed on free surfaces of the PTFE samples, whether external or internal, in the latter case arising from the presence of
microvoids inside sintered parts that were not fully dense
during isostatically cold pressing. In fact, warts have not been observed in fully dense sintered PTFE parts obtained by multiple-step cold isostatic pressing. Furthermore, the observations of Ganguly and Lesser23, that is, that the melting enthalpy of PTFE samples increases with the sintering time applied in the DSC, could be attributed to the formation of warts on the free surfaces of the samples.
preparation and analytical conditions, to determine accurately
the degree of crystallinity of industrial PTFE parts.
2. Experimental
2.1 Material
The PTFE used is a commercial grade Telon 807-N
supplied by DuPont. This grade is presently commercialized by Chemours under the code Telon 807N X. This resin is pelletized after polymerization to form free lowing rounded aggregates called powder granules, with an average size of
≈ 600 µm and degree of crystallinity of ≈ 90%3. The free-lowing powder has a porosity of ≈ 60%.
2.2 Experimental approach
Surface crystalline structures called warts are formed during heat treatment on the free surfaces of PTFE parts, both external25 and internal in the case of poorly compacted parts26. Such conditions are frequently found in the DSC analysis of PTFE powder granules, but not in dense industrial parts sintered in an oven. Thus, we assumed that the simulation of the sintering (including the subsequent crystallization) of PTFE by DSC using powder granules may not accurately represent the processing of technical PTFE parts, since it takes into account the surface crystallization as well as the bulk crystallization, the latter being the most relevant in terms of the properties of industrial PTFE parts. To verify
our assumption, we compared the responses of two types of
specially designed PTFE samples in DSC analysis. One set of samples was taken from the core of specimens which had been cold pressed (CP) and then sintered. Cold pressing was performed under isostatic loading in
multiple-steps26 to produce specimens in the shape of bars, as described in section 2.3. These bars were sintered (and then cooled) in an oven using a standard temperature program for PTFE, as described in section 2.4. They were then cut into small pieces with a size similar to that of powder granules (≈ 600
µm) and placed in DSC pans.
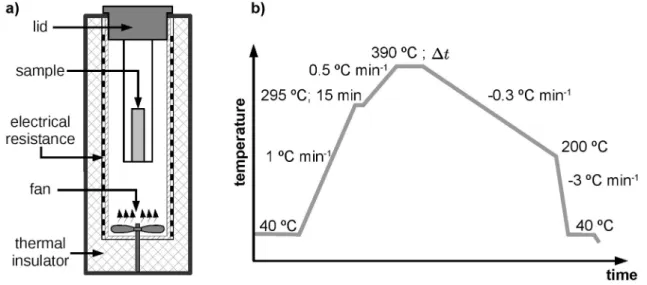
The other set of samples was comprised of as-received (non-pressed but heat-treated, referred to herein as sintered) powder granules (PG). To ensure that the powder granules were thermally treated in a similar manner to the bars, the PG were placed in DSC pans, inserted into a specially designed sample holder made of PTFE (to provide similar conditions of heat exchange; see Figure 1) and then sintered using the same temperature program.
All samples were analyzed by DSC to investigate the efect of the formation of warts on the overall crystallization. Additionally, some selected samples were examined by SEM before and after the DSC analysis to assess the formation of warts. The procedure is shown schematically in Figures 1a-b.
2.3 Cold Pressing
Bars with dimensions of 20 x 10 x 75 mm3 were isostatically cold pressed in three steps with maximum pressures of 2, 10 and 35 MPa, respectively, which allowed the gradual extraction of the air trapped in the particles and interstices, resulting in a dense part with very low porosity (≈ 1.4%)26.
2.4 Sintering
Samples in the form of powder granules (PG) and cold pressed (CP) bars were sintered in a specially designed home-made tubular oven (shown schematically in Figure 2a). The oven contains an electrical resistor coupled to a PID controller and an air circulating device positioned at the bottom of the tube, which allowed a homogeneous distribution of the inside temperature, with a maximum
discrepancy of ± 1 oC. The temperature program used for
the sintering is shown in Figure 2b. Samples were heated
up to 390 oC and held at this temperature for time intervals ranging from ∆t = 120 to 8,000 min and then cooled to 40
oC at 0.3 oC mim-116.
2.5 Diferential Scanning Calorimetry - DSC
DSC experiments were performed using a TA Instruments calorimeter (model Q2000) with hermetic aluminum pans under nitrogen atmosphere (50 mL min-1). Three replicate
samples (7.5 ± 0.1 mg) were analyzed for each sintering condition. The calorimeter was previously calibrated with indium at the same heating/cooling rates employed in the analysis. Samples were subjected to two consecutive thermal cycles with the following program: isothermal
at 180oC for 5 min; heating to 380 oC at 10 oC min-1; and cooling to 180 oC at 10 oC min-1. The irst melting event provided the enthalpy of the crystals formed during the cooling after sintering (∆H1
melt), while the second melting
event is relative to the crystals formed during the cooling in the DSC (∆H2
melt). Melting enthalpies were determined
by integration of the endothermic peaks between the limits
Tmelt,onset = 200 oC and T
melt,endset = 375
oC and were used to estimate the degree of crystallinity, since melting enthalpy data of 100% crystalline PTFE (∆H100%
melt) available in
literature are controversial.
2.6 Scanning Electron Microscopy - SEM
The occurrence of warts on the surface of some selected
Figure 1. Schematics showing procedures involving DSC and SEM analyses. a) samples composed of small pieces extracted from the core of isostatically cold pressed (CP) and sintered bars. DSC was performed immediately after sintering, while SEM was performed before and after the DSC analysis; b) as-received (non-pressed but sintered) powder granules (PG). DSC was performed immediately after sintering and SEM was performed before sintering and before and after the DSC analysis.
Figure 2. a) Scheme of the oven used for the sintering of the PTFE samples and b) heat treatment program
3. Results and Discussion
Figure 3 shows typical DSC thermograms of the powder granules (PG) and cold pressed (CP) samples, which were previously sintered in an oven for 8,000 min. Both samples show single melting and crystallization events in the same
Figure 3. Typical DSC thermograms of cold pressed (CP) and
powder granule (PG) samples previously sintered at 390 oC for
8000 min, with details of the melting and crystallization events and the baselines (dashed lines) used in the integration of the peaks
Therefore, the wart crystallization cannot be distinguished from the bulk crystallization and thus cannot be identiied in the DSC analysis. This emphasizes the importance of developing a speciic DSC procedure in order to determine and quantify the occurrence of these two crystallization phenomena. Moreover, the procedure should allow the accurate determination of the degree of crystallinity of PTFE parts heat-treated using the typical industrial sintering process, this being the aim of this study.
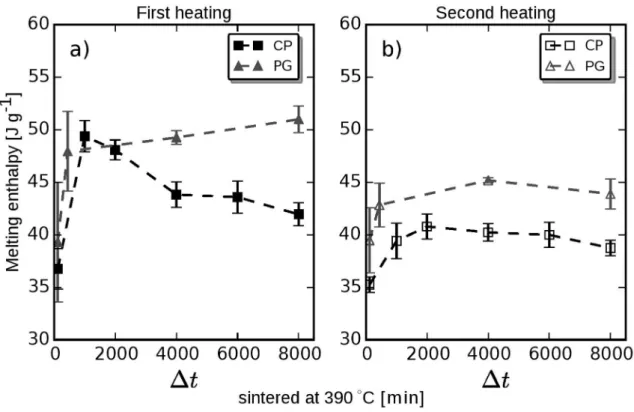
The melting enthalpies recorded by DSC for PG and CP samples are shown in Figure 4. The data in Figure 4a
Figure 4. Melting enthalpy values ΔH1
meltand ΔH
2
melt measured during the irst (a) and second (b) heating steps, respectively, for CP and
PG samples previously sintered at 390oC with diferent time intervals (Δt). Dashed lines are included for visual guidance.
were collected during the irst heating step in the DSC and relate to the melting enthalpy (∆H1
melt) of the crystals formed
during cooling after the sintering performed at diferent time intervals, while Figure 4b shows the melting enthalpies (∆H2
melt) of analogous samples that were further cooled and
re-heated (labeled as second heating) in the DSC.
∆H1
melt (Figure 4a) of both PG and CP samples increases
abruptly up to ∆t ≈ 1,000 min. For longer sintering times, that is, 1,000 min < ∆t < 8,000 min, the ∆H1
melt of PG samples
tends to level of but there is a slight increase up to ∆t = 8,000
min reaching 51 J g-1, whereas the ∆H1
melt of the CP samples
decreases continuously reaching 42 J g-1 (≈ 18% lesser) at ∆t = 8,000 min. This shows that the sample source, that is, PG or CP, plays a key role in the post-sintering PTFE degree of crystallinity. The dependence of ∆H1
melt on the sintering
time can be attributed to an interplay of three main factors: i) chain scission due to thermal degradation, which favors the PTFE crystallization resulting in higher melting enthalpy
values27; ii) disappearance of a remaining “mother phase”, which serves as a nucleus for PTFE crystallization and thus leads to an increase in the melting enthalpy22; and iii) the
formation of crystalline structures called warts on the free
surfaces, which increases the resulting melting enthalpy25,26,28.
For both samples, the abrupt increase in enthalpy up to ∆t =
1,000 min is mainly attributed to chain scission due to the thermal degradation of PTFE during sintering, which appears to prevail over the another two factors for short sintering
noted in the nonstandard experiment carried out by Canto and co-workers3. The nonlinearity observed in the degree of crystallinity as a logarithmic function of the cooling rate can be attributed to the sum of the chain scission and the decrease in the cooling rates during the cycles, since both efects favor the crystallization. For the CP samples the decrease in
∆H1
melt and thus in the degree of crystallinity thereafter, that
is, at 1,000 min < ∆t < 8,000 min, is mainly attributed to the
gradual disappearance of a remaining “mother phase”. The presence of the “mother phase” is assigned to an additional crystallization peak that appears in the range of 340 to 350oC
for samples sintered up to ∆t = 1,000 min22. This “mother phase” acts as a nucleus, which grows during the cooling and further nucleates the post-sintering crystallization of PTFE, which in turn occurs in the range of 310 to 320 oC, as shown in Figure 3. As this “mother phase” also appears in the PG samples, the increase in enthalpy observed at 1,000
min < ∆t < 8,000 min for this sample must be a consequence
of another phenomenon, which has a greater inluence than the irst two. This is associated with the formation of
crystalline structures called warts25,26,28 on the free surfaces
of PG samples. In comparison, CP samples have virtually no free surfaces for the formation of warts during sintering, since they are located in the core of dense bars.
The ∆H2
melt (Figure 4b) values for both samples (PG and
CP) are lower than the corresponding ∆H1
melt values, which is
ascribed to the diference between the cooling rates applied in the oven (0.3 oC min-1) and in the DSC (10 oC min-1). The
∆H1
melt of both samples increases suddenly and then tends to
level of at ∆t > 1,000 min. Clearly, the PG samples show higher ∆H1
melt values at a given sintering time as compared
to the CP sample, which can be ascribed, as will be shown later, to the higher number of warts formed on the former. This occurs because the PG samples have larger free surfaces, owing to the porosity inside the granules (since they were not previously cold pressed) as well as on the external surface, whereas the free surfaces of CP samples are only external.
The diference between the ∆H1
melt and ∆H
2
melt values
for the CP and PG samples sintered for given time intervals (∆t) motivated the SEM study on the formation of warts. As-received PTFE powder granules and some selected samples taken after sintering, along with the corresponding samples subjected additionally to the DSC analysis, were investigated.
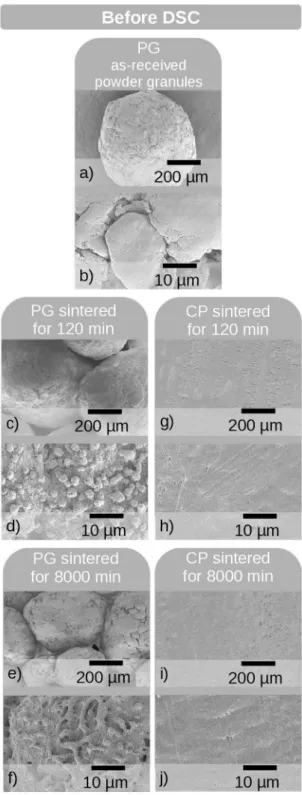
Figures 5 shows typical SEM micrographs of the PG (Figures 5 c-f) and CP (Figures 5 g-j) samples taken immediately after sintering at ∆t = 120 and 8,000 min. As-received PG samples (Figures 5 a-b) were also analyzed for comparison. The PG samples have warts on their surfaces after sintering for any time interval, which are characterized by an aspherical shape and a size of approximately 3 µm. In contrast, the CP samples did not show the presence of warts, whether they were sintered or not. This corroborates our previous assumption that after sintering warts are formed only on the PG samples, which have large free surfaces owing
Figure 5. Typical SEM micrographs of PG and CP samples before being subjected to DSC analysis: (a-b) non-pressed but sintered PG samples; (c-f) sintered PG samples; (g-j) cold pressed (CP);
and sintered samples
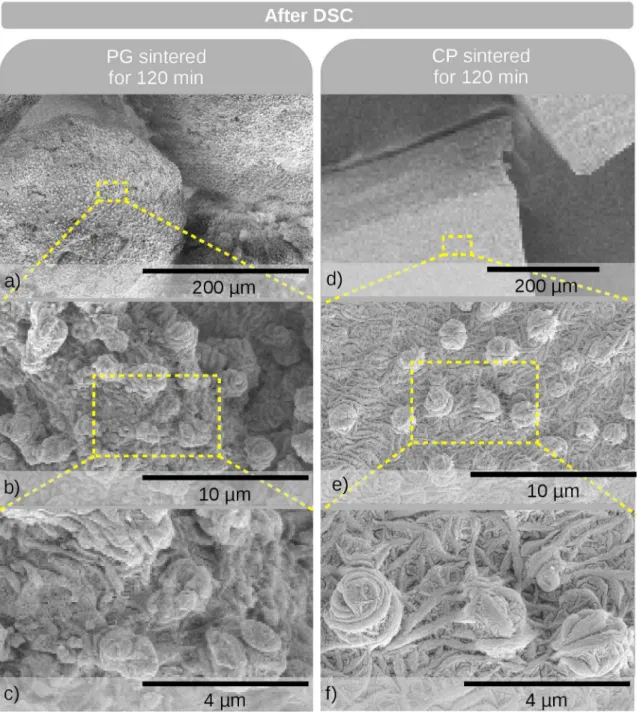
Figure 6. Typical SEM micrographs of PG (a-c) and CP (d-f) samples sintered for 120 min after being subjected to DSC analysis
formed by the coalescence of the warts. The formation of a higher number of highly crystalline warts with an increase in the sintering time corroborates the slightly ascending
∆H1
melt values for the PG samples, as shown in Figure 4a.
SEM was also applied to the PG and CP samples that
were sintered at 390 oC for 120 min and further subjected to DSC analysis (Figure 6). Both the PG and CP samples have the presence of warts on their surfaces. This demonstrates that even if a sample did not previously contain warts (as in the case of sintered CP samples), they are formed during the irst cooling step in the DSC. This explains why the
behavior of the ∆H2
melt values for the CP samples difers
from that of the ∆H1
melt values (Figure 4b). Accordingly, the
PG samples for which the warts were formed in an earlier step are expected to have a greater number of them after the DSC analysis. This corroborates our previous explanation regarding the ∆H2
melt values for the PG and CP samples.
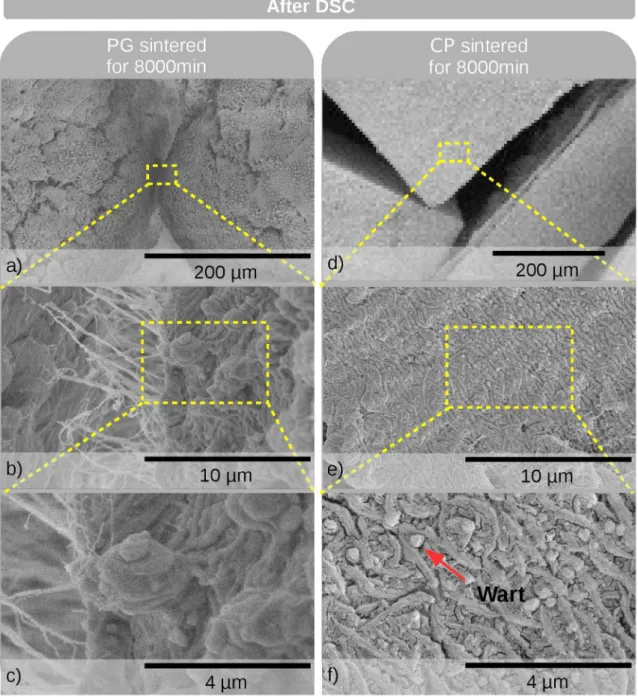
Figure 7 shows the SEM images for the PG and CP
samples that were sintered at 390oC for the longest time
interval, ∆t = 8,000 min, and then subjected to further
Figure 7. Typical SEM micrographs of PG (a-c) and CP (d-f) samples sintered for 8,000 min and then subjected to further DSC analysis
samples that were sintered for a short time interval, ∆t =
120 min (Figure 6).
A reduction in the average size of the warts was observed for the PG samples analyzed via DSC (Figures 6 and 7) with respect to the samples immediately after sintering (Figure 5). This diference can be attributed to the faster cooling rates in DSC analysis (10 °C min-1) compared with the oven (3
°C min-1). This indicates that not only the sintering time (as
observed by Glaris and co-workers25) but also the cooling
rate afects the formation of warts. This can be observed in
the case of the PG samples sintered at 8,000 min, where the network of warts (Figure 5f) is not formed during the cooling in the DSC (Figure 7 a-c). In these samples, a larger number of small warts, that did not coalesce, was observed.
5. Conclusions
taken from the core of isostatically cold pressed (CP) parts subjected to the same sintering program. The diferences in the melting enthalpy measured during the irst heating step in the DSC indicated that sintering afects the crystallization of samples with greater or lesser free surface areas, that is, PG and CP, respectively, in diferent ways. SEM analysis performed on these samples showed that this diference is caused by the formation of crystalline surface structures called warts on the PG samples, which have large surface-to-volume ratios. These wart-like structures do not form
within the core of isostatically cold pressed dense parts
(CP) subjected to analogous sintering, but are formed on the surfaces of samples extracted from such specimens and further subjected to thermal cycling in DSC. Since the surfaces of industrial parts are generally removed during the inish machining operation, on estimating the degree of crystallinity of industrial parts the samples should be free of warts. However, with regard to crystallization and melting events, the crystalline structures (warts) formed on the surface cannot be distinguished from bulk crystals using DSC analysis, since both occur within the same temperature intervals. Therefore, the determination of the degree of crystallinity via a typical DSC routine may result in erroneous results. Based on these observations, we were motivated to develop a DSC procedure for the accurate determination of the degree of crystallinity of cold pressed and sintered industrial parts. For this analysis, samples must be extracted from the core of dense (well-pressed) parts previously sintered in an oven. The use of powder granules and/or sintering by DSC is strongly discouraged as this may result in misleading values. Under the recommended conditions of analysis, the melting enthalpy measured during the irst heating step of the DSC is representative of the melting of crystalline structures formed in the whole part as a function of the sintering conditions (temperature, time interval and cooling rate). In the case of other procedures, the PTFE degree of crystallinity could be overestimated by the formation of warts on the surface of the sample.
6. Acknowledgments
The authors would like to thank CNPq (the National Council of Technological and Scientiic Development – process numbers 476215/2013-7 and 130970/2014-0) and FAPESP (São Paulo Research Foundation – process numbers 2010/20925-0, 2012/10319-1, 2013/00256-5 and 2012/25374-8) for the partial inancial support of this research.
7. References
1. Bonnet JF. Polymères Fluorés. no. AM 3 390. Saint Dennis:
Techniques de l’Ingénieur; 2004.
2. Ebnesajjad S. Fluoroplastics Volume 1: Non-Melt Processible
Fluoroplastics. 1st ed. Norwich: William Andrew Publishing; 2000.
3. Canto RB, Schmitt N, de Carvalho J, Billardon R. Experimental identiication of the deformation mechanisms during sintering
of cold compacted polytetraluoroethylene powders. Polymer
Engineering & Science. 2011;51(11):2220-2235. DOI: 10.1002/ pen.21994
4. Strabelli PG, Sciuti VF, Montilha FS, Canto LB, Canto RB. Efects of sintering variables on the microstructure of isostatically
pressed PTFE parts. Polímeros. 2014;24(5):612-619. DOI:
10.1590/0104-1428.1660
5. Mantuano TRA, Gomes AS. Efeito das Condições do Processo de Moldagem e Sinterização para o Politetraluoroetileno (PTFE) e Polietileno de Ultra Alto Peso Molecular (UHMWPE). Polímeros. 1994;4(1):15-21.
6. Rae PJ, Brown EN. The properties of poly (tetraluoroethylene)
(PTFE) in tension. Polymer. 2005;46(19):8128-8140.
7. Bassett DC, Davitt R. On crystallization phenomena in
polytetraluoroethylene. Polymer. 1974;15(11):721-728.
8. Ashby MF, Johnson K. Materials and Design: The Art and Science
of Material Selection in Product Design. Oxford: Butterworth-Heinemann; 2013.
9. Rae PJ, Dattelbaum DM. The properties of poly(tetraluoroethylene)
(PTFE) in compression. Polymer. 2004;45(22):7615-7625.
10. Dusunceli N, Colak OU. Modelling efects of degree of crystallinity on mechanical behavior of semicrystalline polymers. International Journal of Plasticity. 2008;24(7):1224-1242.
11. Brown EN, Dattelbaum DM. The role of crystalline phase on fracture and microstructure evolution of polytetraluoroethylene
(PTFE). Polymer. 2005;46(9):3056-3068. DOI: 10.1016/j.
polymer.2005.01.061.
12. Brown EN, Dattelbaum DM, Brown DW, Rae PJ, Clausen B. A new strain path to inducing phase transitions in semi-crystalline
polymers. Polymer. 2007;48(9):2531-2536.
13. Brown EN, Rae PJ, Orler EB, Gray GT III, Dattelbaum DM. The efect of crystallinity on the fracture of polytetraluoroethylene
(PTFE). Materials Science and Engineering: C.
2006;26(8):1338-1343.
14. Brown EN, Rae PJ, Liu C. Mixed-mode-I/II fracture of
polytetraluoroethylene. Materials Science and Engineering:
A. 2007;468-470:253-258.
15. Sun H, Cooke RS, Bates WD, Wynne KJ. Supercritical CO2
processing and annealing of polytetraluoroethylene (PTFE) and modiied PTFE for enhancement of crystallinity and creep
resistance. Polymer. 2005;46(20):8872-8882.
16. Canto RB. Theoretical and experimental study of the compaction
and sintering processes of polytetraluoroethylene (PTFE). [Ph.D. thesis]. São Carlos: São Paulo State University – USP / Cachan: École Normale Supérieure de Cachan; 2007.
17. Frédy C, Canto RB, Schmitt N, Roux S, Billardon R. Modelling of the mechanical behaviour of two pure PTFE powders
during their compaction at room temperature. AIP Conference
Proceedings. 2013;1542(1):1246-1249.
18. Andena L, Rink M, Polastri F. Simulation of PTFE sintering:
Thermal stresses and deformation behavior. Polymer Engineering
19. Cochez AC, Canto RB, Canto LB, Schmitt N, Billardon R. A crystallization kinetics model for polytetraluoroethylene (PTFE)
based on two coupled KJMA models. In: 27th Annual Meeting
Polymer Processing Society; 2011 May 11; Marrakech, Morocco.
20. Sparnacci K, Antonioli D, Deregibus S, Laus M, Poggio T, Kapeliouchko V, et al. PTFE-Based Core-Soft Shell
Nanospheres and Soft Matrix Nanocomposites. Macromolecules.
2009;42(10):3518-3524.
21. Laus M, Sparnacci K, Antonioli D, Deregibus S, Kapeliouchko V, Palamone G, et al. On the multiple crystallization behavior of PTFE in PMMA/PTFE nanocomposites from core-shell
nanoparticles. Journal of Polymer Science Part B: Polymer
Physics. 2010;48(5):548-554.
22. Strabelli PG. Efects of sintering variables on the microstructure
and mechanical properties of isostatically pressed PTFE parts. [Master’s dissertation]. São Carlos: Federal University of São Carlos; 2014.
23. Ganguly R, Lesser AJ. Mechanism and kinetics of ultra-high
molecular weight polytetraluoroethylene sintering. Journal of
Applied Polymer Science. 2014;131(21).
24. Lau SF, Suzuki H, Wunderlich B. The thermodynamic properties
of polytetraluoroethylene. Journal of Polymer Science Part
B: Polymer Physics. 1984;22(3):379-405.
25. Glaris P, Coulon JF, Dorget M, Poncin-Epaillard F. Thermal
annealing as a new simple method for PTFE texturing. Polymer.
2013;54(21):5858-5864.
26. Gamboni OO, Riul C, Billardon R, Bose Filho WW, Schmitt N, Canto RB. On the formation of defects induced by air trapping
during cold pressing of PTFE powder. Polymer. 2016;82:75-86.
DOI: 10.1016/j.polymer.2015.11.014
27. Suwa T, Seguchi T, Takehisa M, Machi S. Efect of molecular weight on the crystalline structure of polytetraluoroethylene
as-polymerized. Journal of Polymer Science Part B: Polymer
Physics. 1975;13(11):2183-2194.
28. Jiang C, Hou W, Wang Q, Wang T. Facile fabrication of superhydrophobic polytetraluoroethylene surface by cold pressing
and sintering. Applied Surface Science.