ISSN 0104-6632 Printed in Brazil
www.abeq.org.br/bjche
Vol. 25, No. 03, pp. 461 - 471, July - September, 2008
*To whom correspondence should be addressed
Brazilian Journal
of Chemical
Engineering
RHEOLOGICAL CHARACTERIZATION OF
CHICORY ROOT (
CICHORIUM INTYBUS
L.)
INULIN SOLUTION
J. T. C. L. Toneli
1,2*, K. J. Park
1, J. R. P. Ramalho
3, F. E. X. Murr
3and I. M. D. Fabbro
11
School of Agricultural Engineering, State University of Campinas, UNICAMP, Phone: +(55) (19) 3521-1104, Fax: +(55) (19) 3521-1005, P. O. Box 6011, CEP: 13084-971, Campinas - SP, Brazil.
E-mail: [email protected], E-mail: [email protected], E-mail: [email protected]. 2Center of Engineering, Modeling and Applied Social Sciences, Federal University of ABC,
UFABC, Rua Catequese 242, CEP: 09090-400, Santo André - SP, Brazil. 3
School of Food Engineering, State University of Campinas UNICAMP, P. O. Box 6121, CEP: 13083-970, Campinas - SP, Brazil.
(Received: March 1, 2007 ; Accepted: September 3, 2007)
Abstract - Inulin is a polysaccharide frequently used as a sugar or fat replacer in the food industry, which
offers the advantage of a functional effect similar to those of dietary fibers. By cooling or freezing an inulin concentrated solution, a more concentrated solution precipitates as a paste-like substance, while the liquid phase forms a diluted solution. In this work, the effect of storage temperature of inulin concentrated solution as well as temperature on the rheological behavior of liquid and precipitated phases obtained from a process of phase separation were evaluated. The precipitated phase of inulin was evaluated under two conditions: pure and formulated with encapsulating agents. It was observed that a reduction in storage temperature resulted in a higher inulin precipitation, which produced higher apparent viscosity values for the precipitated phase. All the samples analyzed had a shear-thinning rheological behavior.
Keywords:Extraction; Cooling; Encapsulation; Viscosity; Mathematical model.
INTRODUCTION
Inulin is a polysaccharide found in more than 30,000 plants, which is composed of a chain of fructose units with a terminal glucose unit (Silva, 1996). One of these vegetable species, chicory roots, has been used for commercial production of inulin in Belgium, Holland and France. The reasons for choosing chicory are related to the production of stable long-chain glucose and fructose as well as its ready availability throughout the year, even in moderate climates.
Inulin is largely used by food industries in Europe, USA and Canada due to its capacity to substitute for sugar and fat to lower the calories count. For this reason, inulin has been used as an ingredient of light, diet and low-fat products. Besides
inulin’s ability to substitute for fat and sugar with no caloric contribution during the digestive process, it affects digestive physiological parameters in a way similar to dietary fibers. The ingestion of inulin results in a significant increase in beneficial bifido bacteria (Silva, 1996). Due to these properties, inulin can be classified as a functional ingredient.
462 J. T. C. L. Toneli, K. J. Park, J. R. P. Ramalho, F. E. X. Murr and I. M. D. Fabbro
(precipitated phase), the other phase remains in suspension as a diluted solution (liquid phase).
Berghofer et al. (1993) observed that when an unstirred concentrated inulin solution (40% by weight) was cooled from 95 to 4ºC over 30 hours, some of the inulin precipitated or crystallized as a pasty substance that could be removed by filtration. Hébette et al. (1998) reported that when concentrated solutions (30-45% by weight) of inulin are cooled at 1ºC/min or 0.25ºC/min from 96ºC to 20ºC, suspensions of semicrystalline material are formed in water.
Kim et al. (2001) reported that an inulin gel could be made by shearing or heating/cooling an inulin suspension. According to these authors, heating of inulin suspension solubilized inulin and cooling caused precipitation of dissolved inulin. For gel made with this heating-cooling process, the ratio of gel to total volume is a function of heating temperature, inulin concentration, pH and solvent added.
Inulin is generally sold in powder form due to its easier handling, transportation and storage. Park et al. (2000) proposed a method for obtaining inulin concentrated solution by hot water extraction followed by concentration under reduced pressure with subsequent precipitation by cooling or freezing the inulin concentrated extract. To obtain the inulin in powder form, the concentrate obtained from the precipitation process is spray-dried.
The spray-drying of inulin can be carried out with two forms of the product: pure or formulated with encapsulating agents, which have the function of improving inulin’s shelf life and some of its physical properties, such as hygroscopicity, solubility and flow.
Knowledge of the rheological behavior of liquid foods is essential for equipment projects as well as for evaluation of process conditions. Besides these, viscosity is a very important parameter in quality control and for consumer acceptance of the product.
According to Zimeri and Kokini (2003), although the nutritional properties of inulin have been thoroughly studied, its physicochemical properties and interactions with other food biopolymers have just begun to be characterized. These authors studied the rheological properties of mixed systems of inulin and waxy maize starch and observed the existence of a yield stress from steady shear data for concentrated inulin samples (30 and 40% by weight) through fitting the data to the Herschel-Bulkley equation. Nogueira (2001), Paoletti et al. (2001) and Bishay (1998) also studied the rheological behavior of solutions prepared with inulin and other polysaccharides.
Bot et al. (2004) studied the large-deformation rheology of inulin gels in terms of solubility, crystallization and aggregation data and observed
that more concentrated inulin gels tend to be firmer, but also less plastic. A strong overshoot peak in the stress-strain curve, characteristic of work-softening behavior, characterizes the inulin gels. The authors hypothesized that the inulin molecules deposited during the later stages of the crystallization/gelation process contribute most to the overshoot peak in the stress-strain curve.
The main objective of this work was to evaluate the effect of storage temperature (8, -11 and –15ºC) of an inulin concentrated solution extracted from chicory roots on the flow curves of the liquid and precipitated phases obtained from the separation process. The precipitated inulin was evaluated under two conditions: pure and formulated with encapsulating agents (hydrolyzed starch and modified starch). The flow curves were determined at three temperatures: 25, 40 and 50ºC.
METHODS AND MATERIAL
Inulin Extraction and Precipitation Procedures
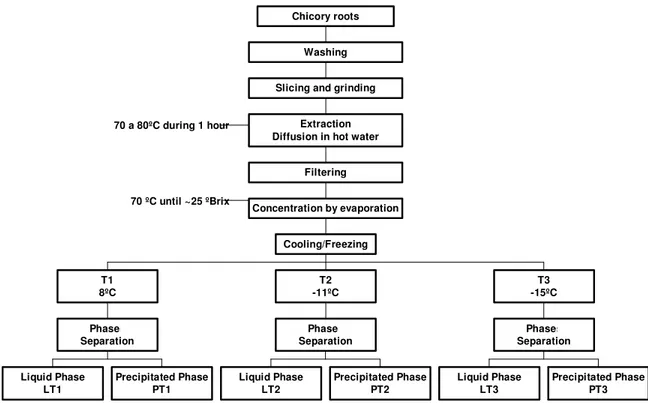
The steps involved in the inulin extraction and precipitation process are specified on Figure 1. The procedure is according to the method proposed by Park et al. (2000).
After harvest, chicory roots were washed with high-pressure water jet, sliced, milled and conducted to the extraction process. Inulin was extracted from chicory roots (Cichorium intybus) by diffusion in hot water at 80ºC during 1 hour, with constant agitation. The obtained solution was concentrated until 24ºBrix through an evaporation process at 70ºC with a vacuum of 57.6kPa. The concentrated solution was then submitted to a lowering temperature process, with the objective of obtaining phases separation. Three storage temperatures were evaluated:
8ºC (T1), corresponding to a common domestical refrigerator temperature;
–11ºC (T2), corresponding to a freezing temperature of a domestical freezer;
–15ºC (T3), corresponding to a freezing temperature of a professional horizontal freezer.
Rheological Characterization of Chicory Root (Cichorium Intybus L.) Inulin Solution 463
Brazilian Journal of Chemical Engineering Vol. 25, No. 03, pp. 461 - 471, July - September, 2008
70 a 80ºC during 1 hour
70 ºC until ~25 ºBrix
Liquid Phase LT1
Precipitated Phase PT1 Phases Separation
T1 8ºC
Liquid Phase LT2
Precipitated Phase PT2 Phases Separation
T2 -11ºC
Liquid Phase LT3
Precipitated Phase PT3 Phases Separation
T3 -15ºC Cooling/Freezing
Concentration by evaporation Filtering
Extraction Diffusion in hot water
Slicing and grinding Washing Chicory roots
Figure 1: Inulin’s extraction and precipitation processes.
Formulation with Encapsulating Agents
The precipitated phase obtained from the phases separation process was formulated with encapsulating agents for the evaluation of the rheological behavior of the resultant suspension. The encapsulating agents applied were: Loremalt 2002, a hydrolyzed starch, and Dextrina 17, a modified starch, both supplied by Cia. Lorenz. The applications were made at the ratio of 7.5% (in weight) of each ingredient, in accordance with the recommendations of Nogueira (2001).
Determination of Soluble and Total Solids Concentration
The official methodology of moisture determination, as described by the Association of Official of Analytical Chemists (1995) for sugars and sugar products, has been adopted for the determination of total solids concentration. Samples were dried for 24 hours with forced circulation oven at 100ºC. The soluble solids concentration was determined in an Abbé refractometer according to the Instituto Adolfo Lutz (1976) method nº 13,6,1,5.
Determination of Inulin Concentration
The inulin concentration at the liquid and precipitated phases was determined through HPLC analysis with Aminex columns HPX-87c (250mm x 4mm), a refractive index Waters model 410 detector and a LCHE Waters model M-45 pump. Water was taken as the mobile phase at a ratio of 0.3ml/min, with an injected volume of 20 liters. The temperature of the column was set at 80°C and at 40ºC for the detector. The concentration quantification was based on inulin standards prepared with Fluka sample (Bio Chemika).
Rheological Analysis
The rheological characterization of the samples was carried out at the following experimental conditions:
Liquid phases obtained at 8ºC (LT1), –11ºC (LT2) and –15ºC (LT3);
Precipitated phases obtained at 8ºC (PT1), –11ºC (PT2) and –15ºC (PT3);
464 J. T. C. L. Toneli, K. J. Park, J. R. P. Ramalho, F. E. X. Murr and I. M. D. Fabbro
(MPT3), formulated with encapsulating agents. The flow curves were determined at controlled shear rate equipments. In all cases the shear rate was varied from a minimum up to a maximum value (increasing shear rate) and, after that, back from the maximum to the minimum (decreasing shear rate). All the rheological analyses were carried out at three temperatures: 25, 40 and 50ºC.
a) Liquid Phase
The rheological properties of the liquid phase were evaluated with a digital rheometer Brookfield model LVDV-III series RP66567 with a sensor SC4-18 connected to a Rheocalc 32, version 2.3 by Brookfield Engineering Laboratories data acquisition system registering shear rate, apparent viscosity and shear stress. A Brookfield bath with a digital thermostat control model TC-501d was applied to set the sample temperature variation. Spindle rotation was set to vary from 105 to 200 rpm, generating shear rate values ranging from 139 to 264s-1.
b) Precipitated Phase
The apparent viscosity of the pure and formulated precipitated phases was evaluated with a Rotating Rheometer CV20N Haake Fisons. The phenomenon associated to the flow between two parallel plates was explored connecting a PQ30 sensor on the stationary board maintaining rotating the second board. The gap between the plates was of 1.0mm. The shear rates remained between 0.000 and 200,000 s-1.
Mathematical Modeling
The mathematical analysis of the rheograms obtained from the analyzed samples was made by dividing these curves into two distinct parts. The first one, up-curve, describes the variation of the tension for the increasing shear rates. The second one, down-curve, describes the variation of the tension for the decreasing shear rates.
Through Statistica 5.0 software, the mathematical models were applied to the experimental data, resulting in an equation and in a theoretical curve relating the shear rate to the estimated shear stress corresponding to each model. The mathematical model analysis that best fits the experimental data was made through the calculation of the average relative error. These models were considered to exhibit a good fit if the relative error was maintained
at values lower than 10%.
The rheological behavior of the samples was characterize by Ostwald De Waele (Power Law), Herschel-Bulkley and Casson mathematical models, represented by equations (1), (2) and (3), respectively.
Power Law:
n K
τ = γ (1)
Herschel-Bulkley:
n 0 KH
τ − τ = γ (2)
Casson:
1/ 2 1/ 2 0 KC
τ = τ + γ (3)
RESULTS AND DISCUSSION.
Determination of Soluble Solids and Total Solids
Soluble solids measurement results, corrected by temperature, and total solids average values of the liquid, pure precipitated and formulated precipitated phases obtained under different conditions are presented in Table 1.
In Table 1 it can be observed that the liquid phase obtained from the solution stored at 8ºC (LT1) had higher soluble solids rates than the LT2 and LT3 samples. A probable reason for this would be the low solubility of inulin at low temperatures, which did not allow migration of soluble solids to the liquid phase when the frozen samples were defrosted.
The higher total solids concentration in the LT1 sample than those in the LT2 and LT3 samples shows that the process of freezing the concentrated inulin solution is more efficient for attaining the precipitated phase than the cooling process.
Determination of Inulin Concentration
Rheological Characterization of Chicory Root (Cichorium Intybus L.) Inulin Solution 465
Brazilian Journal of Chemical Engineering Vol. 25, No. 03, pp. 461 - 471, July - September, 2008
Table 1: Total solids and soluble solids concentrations.
Sample Soluble solids
(ºBrix) – 20ºC Total solids(w/w)
LT1 18.50 0.2310
LT2 14.00 0.1368
LT3 13.75 0.1353
PT1 16.15 0.3279
PT2 16.12 0.3242
PT3 16.40 0.3294
MPT1 28.58 0.4078
MPT2 27.61 0.4017
MPT3 28.83 0.4071
Table 2: Inulin concentration on a dry basis for liquid and precipitated phases.
Sample Average inulin concentration (w/w)
LT1 0.2175
LT2 0.0480
LT3 0.0723
PT1 0.5153
PT2 0.5820
PT3 0.7826
The values presented in Table 2 show that of the liquid phases, the LT1 sample had the highest inulin concentration, which was as much as 4.5 times the LT2 value and 3 times the LT3 sample value. Therefore, regarding the liquid phases, the simple cooling of the sample was not enough to remove a higher amount of inulin from the solution. In accordance with the data on inulin concentration in the precipitated phase, the clear effect of temperature can be observed with the lower freezing temperature resulting in a larger inulin sample concentration.
Flow Curve Evaluation
Effect of Inulin, Soluble Solids and Total Solids Concentrations
Figure 2 and Figure 3 contain the flow curves obtained at 25ºC for all inulin precipitated phase samples (PT1, PT2 and PT3) and for all inulin liquid phase samples (LT1, LT2 and LT3), respectively.
In observing Figure 2, it can be noted that the PT1 sample had the lowest apparent viscosity values, while the PT2 and PT3 samples showed flow curves that were practically coincident. In Figure 3, however, the opposite behavior can be observed: the LT1 sample had the highest apparent viscosity
values, as much as 2.5 times the apparent viscosity values of the LT3 sample. The LT2 and LT3 samples had flow curves that were almost coincident.
A comparison of the results presented in Figures 2 and 3 with data shown in Table 3 shows that higher values of inulin, soluble solids and total solids concentration result in higher apparent viscosity values at a temperature of 25ºC. This trend was also observed at temperatures of 40 and 50ºC. However, for inulin precipitated samples, which are more concentrated, a reduction in this trend with increasing temperature was observed. The apparent viscosity value of the PT1 sample was as low as 0.66 times the apparent viscosity value of the PT2 sample at 25ºC. This value went up to 0.73 at 40ºC and to 0.83 at 50ºC.
466 J. T. C. L. Toneli, K. J. Park, J. R. P. Ramalho, F. E. X. Murr and I. M. D. Fabbro
0 5 10 15 20 25 30 35
0 20 40 60 80 100 120 140 160 180 200 220
Shear Rate (s-1
)
Sh
ear S
tr
ess (
P
a)
PT1 (up curve) PT1 (down curve) PT2 (up curve) PT2 (down curve) PT3 (up curve) PT3 (down curve)
(a) Rheogram
0 100 200 300 400 500
0 20 40 60 80 100 120 140 160 180 200 220
Shear Rate (s-1 )
Ap
pa
ren
t V
iscosity (10
-3Pa
s)
PT1 PT2 PT3
(b) Apparent Viscosity (Up curve) Figure 2: Flow curve of inulin precipitated phase samples obtained at 25ºC.
0 5 10 15 20 25
120 140 160 180 200 220 240 260 280
Shear Rate (s-1)
S
h
ear S
tress (Pa)
LT1 (up curve) LT1 (down curve) LT2 (up curve) LT2 (down curve) LT3 (up curve) LT3 (down curve)
(a) Rheogram
0 20 40 60 80 100
120 140 160 180 200 220 240 260 280
Shear Rate (s-1)
A
p
p
a
re
n
t V
is
cos
it
y (
1
0
-3Pa
s
)
LT1 LT2 LT3
(b) Apparent Viscosity (Up curve) Figure 3: Flow curve of inulin liquid phase samples obtained at 25ºC.
According to the results, the apparent viscosity of the precipitated phase was higher than that of the liquid phase, for all temperatures evaluated. However, the difference between the apparent viscosity values of the samples was higher for the PT3 and LT3 samples. At 50ºC, values for the apparent viscosity of the PT3 sample were as much as 8 times the apparent viscosity value of the LT3 sample. Otherwise, at the same temperature, the PT1 sample had apparent viscosity values as high as 1.8 times the apparent viscosity value of the LT1 sample.
According to data presented in Tables 1 and 2, the inulin liquid phase sample obtained at 8ºC (LT1) had the highest values of inulin, soluble solids and total solids concentrations. Otherwise, the inulin precipitated sample obtained under the same conditions (PT1) had the lowest values of inulin, soluble solids and total solids concentrations. These results confirm the trend of increasing apparent viscosity of the samples with increasing concentrations of inulin, total solids and soluble solids.
Effect of Addition of Encapsulating Agents
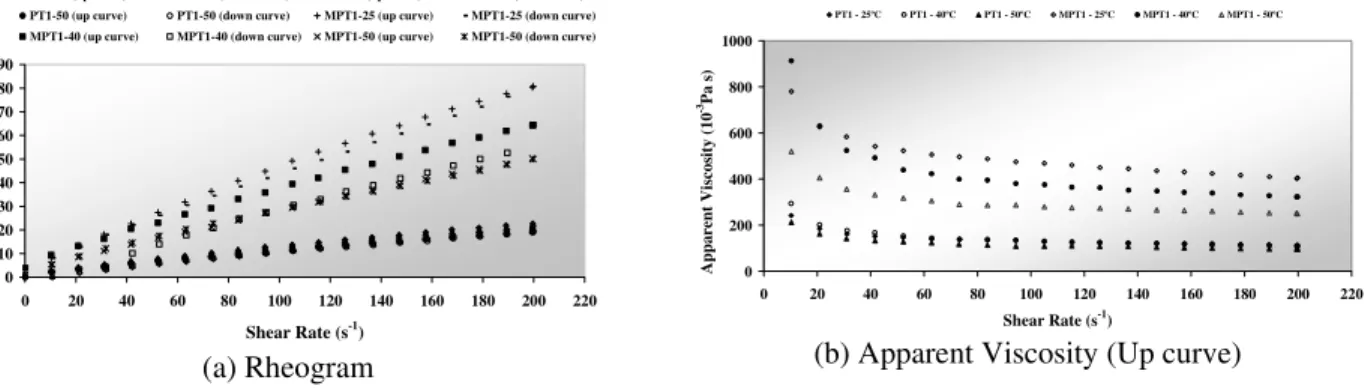
Figure 4 contains the flow curves for the PT1 and MPT1 samples at temperatures of 25, 40 and 50ºC. In Figure 4, it can be observed that the addition of encapsulating agents caused an increase in apparent
viscosity, as expected. This trend was also observed for the PT2 and PT3 samples.
The difference between the apparent viscosities of pure and formulated precipitated phases was smaller for low shear rates with a trend to increase with higher shear rates. The apparent viscosity increased from 2 to 3.7 times with addition of the encapsulating agents. This increase can be explained by the higher total and soluble solids concentrations in the samples, generated by the addition of encapsulating agents.
Bishay (1998) studied the interaction of 35% inulin gel with other hydrocolloids. He did not observe any significant interaction between the soluble hydrocolloids studied and inulin. However, the system of 35% inulin gel with 10% unmodified starch gel had negative synergy, probably due to the affinity for water. The addition of unmodified starch to inulin gel resulted in a lower overall viscosity and weaker gel strength.
Rheological Characterization of Chicory Root (Cichorium Intybus L.) Inulin Solution 467
Brazilian Journal of Chemical Engineering Vol. 25, No. 03, pp. 461 - 471, July - September, 2008
PT2 and PT3 samples when formulated with encapsulating agents. These results agree with those reported by Nogueira (2001) for chicory root inulin extracts formulated with wall material concentrations varying from 5 to 30%.
Mathematical Analysis
Mathematical analysis of the flow curves obtained for all the samples was carried out using the Ostwald de Waele (PL), Herschel Bulkley (HB) and Casson (Ca) models. All the models evaluated offered a good fit; however, the Herschel Bulkley and Casson models were considered physically inadequate, since the yield stress had negative values.
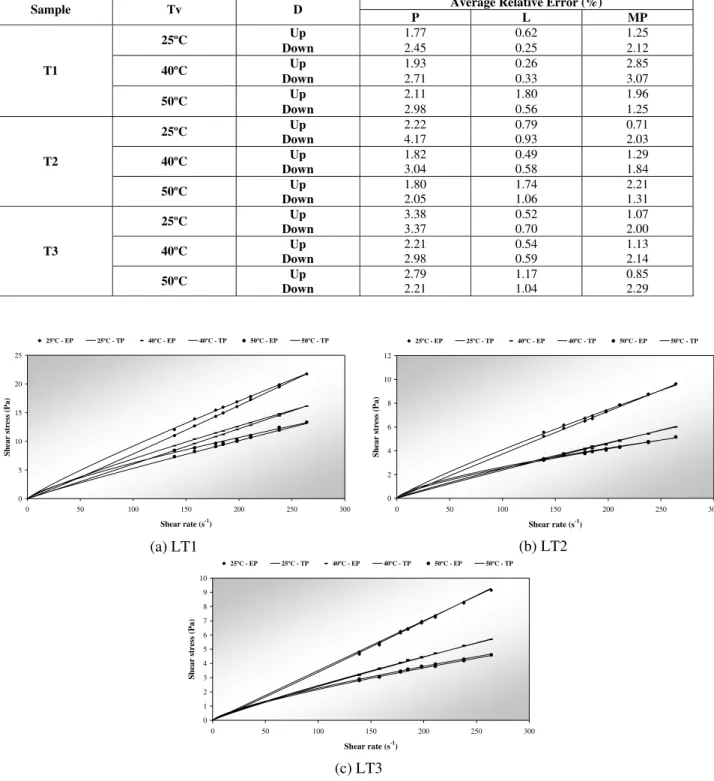
The empirical parameters obtained from the fit of data to the power law model are shown in Table 3. The corresponding average relative errors are presented in Table 4. According to the values presented in Tables 3 and 4, the power law model
offered a good fit, since the R2 values are close to 1.0 and the average relative error values are lower than 10%. Figures 5, 6 and 7 illustrate the graphic fit for the liquid, pure precipitated and formulated precipitated phases, respectively.
The flow index values of the liquid phase presented in Table 3 show that all the samples, except the LT3 sample evaluated at 25ºC, have slightly pseudoplastic behavior during the up curve. During the down curves, however, almost all the flow index values were higher and some samples were found to be Newtonian or even awkwardly dilatant. These results indicate that the rheological behavior of the inulin liquid phase is slightly thyxotropic, mainly for the LT1 sample, which had higher soluble solids and inulin concentrations. For all the liquid phase samples, the rheological behavior became more pseudoplastic with the increase in temperature, as is normally expected for biological products.
0 10 20 30 40 50 60 70 80 90
0 20 40 60 80 100 120 140 160 180 200 220
Shear Rate (s-1
)
Shear Stress
(
P
a)
PT1-25 (up curve) PT1-25 (down curve) PT1-40 (up curve) PT1-40 (down curve) PT1-50 (up curve) PT1-50 (down curve) MPT1-25 (up curve) MPT1-25 (down curve) MPT1-40 (up curve) MPT1-40 (down curve) MPT1-50 (up curve) MPT1-50 (down curve)
(a) Rheogram
0 200 400 600 800 1000
0 20 40 60 80 100 120 140 160 180 200 220
Shear Rate (s-1)
A
ppa
rent V
is
cos
it
y
(10
-3Pa
s
)
PT1 - 25ºC PT1 - 40ºC PT1 - 50ºC MPT1 - 25ºC MPT1 - 40ºC MPT1 - 50ºC
(b) Apparent Viscosity (Up curve) Figure 4: Flow curves for pure (PT1) and formulated (MPT1) inulin
precipitated samples, obtained at temperatures of 25, 40 and 50ºC. Table 3: Theoretical parameters of the mathematical models employed in
determination of the rheological behavior of the precipitated phase.
Liquid Phase Precipitated Phase Encapsulated Sample Tv
a
(ºC) D
b
K n R2 K n R2 K n R2
Up 0.150 0.893 0.9993 0.335 0.800 0.9996 1.186 0.798 0.9998
25
Down 0.060 1.057 0.9999 0.173 0.915 0.9992 0.948 0.835 0.9995
Up 0.127 0.869 0.9998 0.450 0.733 0.9993 1.224 0.747 0.9991
40
Down 0.056 1.016 0.9998 0.325 0.787 0.9989 1.420 0.715 0.9984
Up 0.174 0.777 0.9910 0.297 0.787 0.9993 0.642 0.823 0.9997
1
50
Down 0.071 0.936 0.9995 0.271 0.800 0.9991 0.790 0.780 0.9997
Up 0.074 0.871 0.9987 1.04 0.648 0.9991 0.983 0.813 0.9999
25
Down 0.042 0.974 0.9986 0.308 0.869 0.9983 0.869 0.831 0.9996
Up 0.028 0.964 0.9996 0.614 0.703 0.9991 0.703 0.827 0.9998
40
Down 0.038 0.908 0.9993 0.283 0.841 0.9988 0.831 0.791 0.9995
Up 0.118 0.675 0.9891 0.315 0.775 0.9995 0.734 0.812 0.9996
2
50
Down 0.091 0.722 0.9958 0.373 0.738 0.9992 1.205 0.717 0.9997
Up 0.035 1.000 0.9996 1.004 0.647 0.9983 1.035 0.787 0.9998
25
Down 0.028 1.041 0.9995 0.307 0.862 0.9985 0.714 0.852 0.9996
Up 0.044 0.872 0.9991 0.997 0.655 0.9992 0.939 0.807 0.9998
40
Down 0.037 0.904 0.9994 0.294 0.876 0.9987 0.667 0.866 0.9995
Up 0.072 0.748 0.9956 0.628 0.723 0.9984 1.096 0.793 0.9999
3
50
Down 0.064 0.765 0.9967 0.183 0.948 0.9994 0.814 0.843 0.9994
a
Temperature of viscosity determination; b
468 J. T. C. L. Toneli, K. J. Park, J. R. P. Ramalho, F. E. X. Murr and I. M. D. Fabbro
Table 4: Average relative error of the mathematical models employed in determination of the rheological behavior.
Average Relative Error (%)
Sample Tv D
P L MP
Up 1.77 0.62 1.25
25ºC
Down 2.45 0.25 2.12
Up 1.93 0.26 2.85
40ºC
Down 2.71 0.33 3.07
Up 2.11 1.80 1.96
T1
50ºC
Down 2.98 0.56 1.25
Up 2.22 0.79 0.71
25ºC
Down 4.17 0.93 2.03
Up 1.82 0.49 1.29
40ºC
Down 3.04 0.58 1.84
Up 1.80 1.74 2.21
T2
50ºC
Down 2.05 1.06 1.31
Up 3.38 0.52 1.07
25ºC
Down 3.37 0.70 2.00
Up 2.21 0.54 1.13
40ºC
Down 2.98 0.59 2.14
Up 2.79 1.17 0.85
T3
50ºC
Down 2.21 1.04 2.29
0 5 10 15 20 25
0 50 100 150 200 250 300
Shear rate (s-1)
Sh
ear stre
ss (Pa)
25ºC - EP 25ºC - TP 40ºC - EP 40ºC - TP 50ºC - EP 50ºC - TP
(a) LT1
0 2 4 6 8 10 12
0 50 100 150 200 250 300
Shear rate (s-1)
S
h
ea
r st
re
ss (P
a
)
25ºC - EP 25ºC - TP 40ºC - EP 40ºC - TP 50ºC - EP 50ºC - TP
(b) LT2
0 1 2 3 4 5 6 7 8 9 10
0 50 100 150 200 250 300
Shear rate (s-1)
S
h
ear st
re
ss
(
P
a)
25ºC - EP 25ºC - TP 40ºC - EP 40ºC - TP 50ºC - EP 50ºC - TP
(c) LT3
Rheological Characterization of Chicory Root (Cichorium Intybus L.) Inulin Solution 469
Brazilian Journal of Chemical Engineering Vol. 25, No. 03, pp. 461 - 471, July - September, 2008
0 5 10 15 20 25
0 50 100 150 200 250
Shear rate (s-1
)
She
ar
s
tre
ss
(Pa)
EP - 25ºC TP - 25ºC EP - 40ºC TP - 40ºC EP - 50ºC TP - 50ºC
(a) PT1
0 5 10 15 20 25 30 35
0 50 100 150 200 250
Shear rate (s-1
)
S
h
ear st
re
ss (
P
a)
EP - 25ºC TP - 25ºC EP - 40ºC TP - 40ºC EP - 50ºC TP - 50ºC
(b) PT2
0 5 10 15 20 25 30 35
0 50 100 150 200 250
Shear rate (s-1
)
S
h
ear
st
re
ss
(
P
a)
EP - 25ºC TP - 25ºC EP - 40ºC TP - 40ºC EP - 50ºC TP - 50ºC
(c) PT3
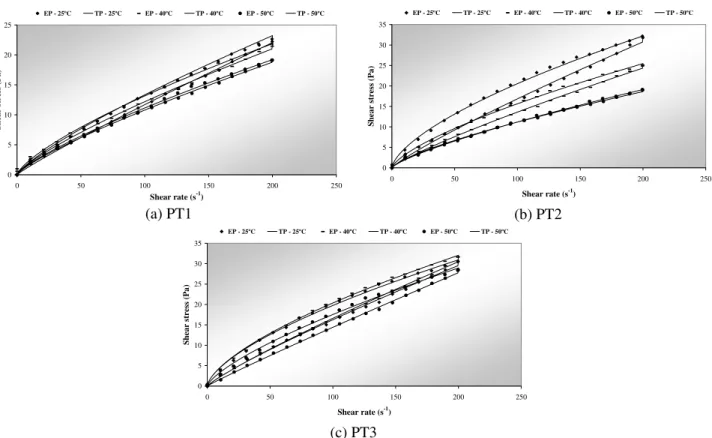
Figure 6: Rheograms for the pure precipitated phases, evaluated in accordance with the power law mathematical model
0 10 20 30 40 50 60 70 80 90
0 50 100 150 200 250
Shear rate (s-1
)
Sh
ea
r s
tr
es
s (P
a
)
EP - 25ºC TP - 25ºC EP - 40ºC TP - 40ºC EP - 50ºC TP - 50ºC
(a) MPT1
0 10 20 30 40 50 60 70 80
0 50 100 150 200 250
Shear rate (s-1
)
S
h
ear st
re
ss (
P
a)
EP - 25ºC TP - 25ºC EP - 40ºC TP - 40ºC EP - 50ºC TP - 50ºC
(b) MPT2
0 10 20 30 40 50 60 70 80
0 50 100 150 200 250
Shear rate (s-1)
Sh
ea
r s
tre
ss
(
P
a
)
EP - 25ºC TP - 25ºC EP - 40ºC TP - 40ºC EP - 50ºC TP - 50ºC
(c) MPT3
470 J. T. C. L. Toneli, K. J. Park, J. R. P. Ramalho, F. E. X. Murr and I. M. D. Fabbro
The results presented in Table 3 show that all the precipitated samples, whether encapsulated or not, had pseudoplastic behavior with flow index values varying between 0.655 and 0.948. During the down curves, almost all the flow index values were higher for pure precipitated samples, which indicates that they had a slightly thyxotropic behavior that was more pronounced for the samples evaluated at room temperature (25ºC). The precipitated samples obtained at -15ºC had the most evident thyxotropic behavior for all the evaluation temperatures.
By observing the results in Table 3 it can be noted that the evaluation temperature had just a small effect on the flow index of the precipitated samples, mainly after addition of the encapsulating agents. Besides that, the addition of encapsulating agents reduced the thyxotropic behavior of all the precipitated samples. These results support the conclusion that the addition of encapsulating agents resulted in a precipitated inulin solution with more stable rheological properties.
By considering the results obtained for the flow index of liquid and precipitated phases, one can conclude that the increase in inulin concentration produced more structured solutions with thyxotropic and pseudoplastic behaviors. In observing Figures 2b and 4b it can be noted that the behavior of the apparent viscosity of inulin precipitated samples, both pure and formulated with encapsulating agents, was of a shear-thinning material at low strain rates. For higher strain rates, the behavior was close to being linear.
These results are in accordance with those presented by Bot et al. (2004), Zimeri and Kokini (2003), Nogueira (2001) and Bishay (1998). All these authors studied the rheological behavior of inulin solutions and found that, at high inulin concentrations, they have a shear-thinning behavior of a very structured fluid. BISHAY (1998) reported that at 15% solids and below, inulin displays Newtonian behavior of typical soluble, low-molecular-weight systems. However, at 25% solids and above, inulin begins to display strong shear-thinning behavior.
In Figure 3b, it can be seen that the behavior of the apparent viscosity of liquid phase samples was close to being linear. Considering that these rheograms were determined for strain rates from 139 to 264 s-1 it is reasonable to suppose that, for lower strain rates, the samples would have the shear-thinning behavior, predicted by the power law model.
CONCLUSIONS
Results of the present work show that the inulin concentration in the precipitated samples increased with decreasing storage temperature of the concentrated inulin solution.
Rheological analysis showed that the liquid phase samples and the inulin precipitated samples, either pure or formulated with encapsulating agents, had the rheological behavior of a non-Newtonian fluid with shear-thinning features for temperatures of 25, 40 and 50ºC. It was also observed that apparent viscosity tends to increase with increasing inulin concentration for both liquid and precipitated phases. The effect of wall material on the formulated extract viscosity was greater than that of temperature.
The Ostwald-of-Waele (power law) mathematical model is the most appropriate for representing the experimental data obtained from the rheological analysis of the liquid, pure precipitated and formulated precipitated phases, carried out at temperatures of 25, 40 and 50ºC.
ACKNOWLEDGMENTS
We acknowledge the financial support received from The State University of Campinas (UNICAMP), The State of São Paulo Research Foundation (FAPESP), The National Council for Scientific and Technological Development (CNPq) and Coordenação de Aperfeiçoamento de Pessoal de Nível Superior (CAPES).
NOMENCLATURE
Ca Casson Model (-)
D
Path of the increasing (up curve) or decreasing (down curve) deformation rate
(-)
HB Herschel Bulkley Model (-) K Consistency index (Pas)n KC Casson consistency index (Pas)
1/2
KH
Herschel-Bulkley consistency index
(Pas)n
LT1 Liquid phase obtained at a temperature of 8ºC
(-)
LT2 Liquid phase obtained at a temperature of -11ºC
(-)
LT3 Liquid phase obtained at a temperature of -15ºC
Rheological Characterization of Chicory Root (Cichorium Intybus L.) Inulin Solution 471
Brazilian Journal of Chemical Engineering Vol. 25, No. 03, pp. 461 - 471, July - September, 2008
MPT1
Precipitated phase obtained at a temperature of 8ºC, formulated with encapsulating agents
(-)
MPT2
Precipitated phase obtained at a temperature of -11ºC, formulated with
encapsulating agents
(-)
MPT3
Precipitated phase obtained at a temperature of -15ºC, formulated with
encapsulating agents
(-)
n Flow index (-)
PL Power law model (-)
PT1 Precipitated phase obtained at a temperature of 8ºC
(-)
PT2 Precipitated phase obtained at a temperature of -11ºC
(-)
PT3 Precipitated phase obtained at a temperature of -15ºC
(-)
R2 Correlation coefficient (-)
T1 Temperature of 8ºC (-)
T2 Temperature of -11ºC (-) T3 Temperature of -15ºC (-) Tv Temperature of viscosity
determination
ºC
Greek Letters
τ Shear stress N/m2
τ0 Yield stress N/m
2
γ Shear rate s-1
REFERENCES
Association of Official Analytical Chemists, Official methods of analysis of A.O.A.C. international. 16th ed. Arlington: A.O.A.C., Inc. (1995).
Berghofer, E.; Cramer, A.; Schmidt, V.; Veigl, M., Pilot-scale production of inulin from chicory roots and its use in foodstuffs. In: FUCHS, A. (Ed). Inulin and inulin-containing crops. Elsevier Science, Amsterdam (1993).
Bishay, I. E., Rheological characterization of inulin. In: Williams, P. A.; Phillips, G. O. (Eds.) Gums and stabilizers for the food industry. vol. 9, Royal Society of Chemistry, London (1998).
Bot, A.; Erle, U.; Vreeker, R., Agterof, W. G. M., Influence of crystallization conditions on the large deformation rheology of inulin gels. Food Hydrocolloids, 18, No. 4, 547-556 (2004).
Ginner, J.; Ibarz, A.; Garza, S.; Xhian-Quan, S., Rheology of clarified cherry juices. Journal of Food Engineering, 30, No. 1/2, 147-154 (1996). Hébette, C. L. M.; Delcour, J. A.; Koch, M. H. J.,
Complex melting of semi-crystalline chicory
(Cichorium intybus L.) root inulin. Carbohydrate
Research, 310, No. 1-2, 65-75 (1998).
Instituto Adolfo Lutz, Normas analíticas do Instituto Adolfo Lutz.Vol. 1 (1976).
Kim, Y.; Faqih, M. N.; Wang, S. S., Factors affecting gel formation of inulin. Carbohydrate Polymers, 46, No. 2, 135-145 (2001).
Nogueira, R. I., Processo de obtenção de inulina de chicória (Cichorium intybus) em pó. Ph.D. diss., Faculdade de Engenharia Agrícola,Universidade Estadual de Campinas (2001)
Paoletti, F.; Nardo, N.; Monici, M.; Maini, S.; Butturini, A., Caratterizzazione reologica di miscele di inulina com fibre. Industrie Alimentari, 40, No. 404, 633-635 (2001).
Park, K. J.; Park, T. H. K. B.; Park, K. J. B.; Nogueira, R. I.; Leite, J. T. C., Processo de obtenção de concentrado de inulina por abaixamento de temperatura e separação física. BR Patente número PI 0003867-9 (2000).
Silva, R.F., Use of inulin as a natural texture modifier. Cereal Foods World, 41, No. 10, 792-795 (1996).
Saenz, C.; Costel, E., Comportamiento reológico de productos de limón. Influência de la temperatura y de la concentración. Revista de Agroquimica y Tecnología de Alimentos, 26, No. 4, 581-588 (1986). Zimeri, J. E.; Kokini, J. L., Rheological properties of