*e-mail: [email protected]
On the Prediction of Fatigue Crack Retardation Using
Wheeler and Willenborg Models
Marcos Venicius Soares Pereiraa*, Fathi Aref Ibrahim Darwishb,
Arnaldo Freitas Camarãoc, Sérgio Henrique Mottad
a
Departamento de Ciência dos Materiais e Metalurgia,
Pontifícia Universidade Católica do Rio de Janeiro – PUC-Rio,
Rua Marquês de São Vicente, 225, 22453-900 Rio de Janeiro - RJ, Brazil
b
Universidade Federal Fluminense – UFF, Rua Passo da Pátria, 156,
24210-240 Niterói - RJ, Brazil
c
ArvinMeritor do Brasil CVS, Av. João Batista, 825, 06097-900 Osasco - SP, Brazil
dBrasilamarras, Rua Eng. Fábio Goulart, 40, 24050-090 Niterói - RJ, Brazil
Received: June 30, 2006; Revised: March 29, 2007
The aim of this work is to evaluate the applicability of the Wheeler and Willenborg models to predicting fatigue crack growth retardation in a flash welded structural steel subjected to a single overload during constant amplitude (CA) fatigue crack propagation test. Compact tension specimens, in different microstructural conditions, were subjected to a single overload at a given crack length during CA fatigue loading and crack growth rate da/ dN vs. the stress intensity factor range ∆K was monitored, evidencing the retardation in crack propagation over an interval of crack length. The size of the delay zone as well as the number of the delay cycles were predicted by both the Wheeler and Willenborg models and then compared with the experimental data. Finally, the results are presented and discussed focusing on the comparison between the predictions made by the two models in the light of the experimental data.
Keywords: structural steel, crack propagation kinetics, crack retardation models, fatigue life extension
1. Introduction
The rate of fatigue crack propagation and the critical crack size are considered essential for structural integrity assessment based on damage-tolerance considerations. The determination of the resistance of a mechanical or structural component to fatigue crack propagation and the calculation of defect tolerance are two aspects intimately related to the dependence of crack growth rate on the variation of the stress intensity factor. Frequently, complex loading conditions exist with different amounts of static and dynamic loads or mixed loading modes, depending on the stress distribution near the crack.
Structural and mechanical components when in service under cy-clic loading may be subjected to either variable amplitude loading or occasional overload cycles and these load interactions complicate life prediction. Sometimes, overloads are purposely applied to produce some beneficial effects on the fatigue resistance of the components and it has been known for over forty years that overload cycles of sufficient magnitude can result in a transient retardation in the rate of fatigue crack growth at the baseline level1. It is also well established
that this retardation is closely related to the residual compressive stress field induced in the vicinity of the crack tip2. Following an
overload cycle, the fatigue crack starts to advance into the overload (OL) plastic zone and the residual compressive stresses in an element just behind the crack tip are relaxed. This contributes to the level of crack closure in the wake of the crack tip, thus retarding fatigue crack propagation. As the crack exits the OL plastic zone, the propagation rate is generally back again at the baseline level corresponding to the constant amplitude (CA) loading. Other retardation mechanisms such as crack blunting and strain hardening of the material within the
OL plastic zone can be activated following overloading and therefore contribute to the extension of fatigue life.
The magnitude and extent of crack growth retardation due to the imposition of a single OL during CA cycling are usually measured by parameters such as the delay cycles number Nd and the delay zone size ∆ad. The first parameter refers to the increase in residual fatigue life due to overloading and the second is a measure of the OL affected crack length increment along which retardation takes place. Both Nd and ∆ad can vary depending on load parameters3. For example, the
higher the ratio between the magnitude of the overload and that of the CA maximum load, ROL, the more pronounced the crack growth retardation. That is, an increase in ROL results in an increase in Nd and ∆ad, as well as in a decrease in the minimum da/dN level3. For
high overloads (ROL = 2.5) the initial crack growth acceleration that immediately follows an overload was absent and immediate retarda-tion was observed4,5.
In regard to the effect of the CA load ratio R, defined by the ratio between the minimum (Kmin) and maximum (Kmax) stress intensity fac-tors, crack growth retardation was found to decrease with the increase in R. The increase in R was also accompanied by a decrease in the fatigue crack length increment between the OL application and the occurrence of the minimum da/dN5-7. Initial growth acceleration was
found to vanish and retardation became immediate for high R values around 0.66. Another interesting observation refers to the fact that the
ratio is expected to vary from 3.5 at R = 0.1 to values ranging between 0.2 and 0.3 for R = 0.45. That is, depending on loading conditions, the delay zone size can be much larger or smaller than the OL monotonic plastic zone size calculated for plane stress conditions4,6,8.
In addition to the loading parameters, material properties also have a considerable bearing on fatigue crack growth retardation following a single overload. Several works9,10 have shown that the
higher the yield stress, the more short-termed becomes the overall retardation effect.
Crack deflections from its original path, often referred to as crack branching, may provide a sound alternative mechanistic explanation for overload-induced fatigue crack growth retardation. From work on structural steel, though, crack branching was either apparent both prior to and after the OL event8, or did not occur until the crack had
propagated over some distance into the OL plastic zone11. Tentative
conclusions from reported literature evidence on crack branching could be that the propensity for such crack path irregularities is increased in low purity alloys compared to high purity alloys and in coarser grained materials compared to finer grained materials3.
Further, it can also be concluded, from what reported in the literature, that crack branching is more likely to occur at near threshold ∆Kth values, though it has also been observed at higher stress intensity factor range ∆K levels3. In any case, post-OL crack deflections are
mainly a surface phenomenon and do not occur in the interior of thick specimens11,12.
Starting early seventies, a large number of models which incor-porate interaction effects have been introduced for predicting fatigue crack growth under variable amplitude (VA) loading13-19. These
mod-els are characterized by introducing crack tip plasticity effects and they comprise three distinct groups. The yield zone models are based on considerations on the size of monotonic plastic zone created at the crack tip due to an OL and do not take into account plasticity induced crack closure due to the imposition of the overload. Crack closure models, on the other hand, represent an improvement of the more primitive yield zone models and take into consideration the closure behavior based on crack closure measurements made during CA load-ing20. Assumptions are then made about the crack closure behavior
under VA loading. In the more sophisticated strip yield models, the occurrence of plasticity induced crack closure is calculated rather than estimated from measurements made during CA loading20.
The present study has the purpose of applying two of the yield models, namely the Wheeler and Willenborg models, in order to evaluate fatigue crack growth retardation in an R3 grade structural steel after a single overload cycle applied at a given crack length during CA loading. As the steel is largely adopted for manufactur-ing moormanufactur-ing components for offshore floatmanufactur-ing units, the study was extended to include flash welded joints of the same steel. The study was motivated by the simplicity of the two models in question and was primarily aimed at comparing the delay parameters predicted by their application with experimental data, obtained with both the base metal as well as the welded joints.
2. Fatigue Crack Growth Under Variable
Amplitude Loading
The model proposed by Wheeler13 represents an approach to
explain crack growth delays caused by high loads. The model rec-ognizes that new plastic zones are created inside the large monotonic plastic zone of an overload. A crack growth retardation factor g, which is related to the sizes of both the cyclic and monotonic plastic zones, was then introduced by Wheeler, making it possible for one to predict crack growth rate within the delay period, (da/dN)VA, from the expression:
(da/dN)VA = g(da/dN)CA (1)
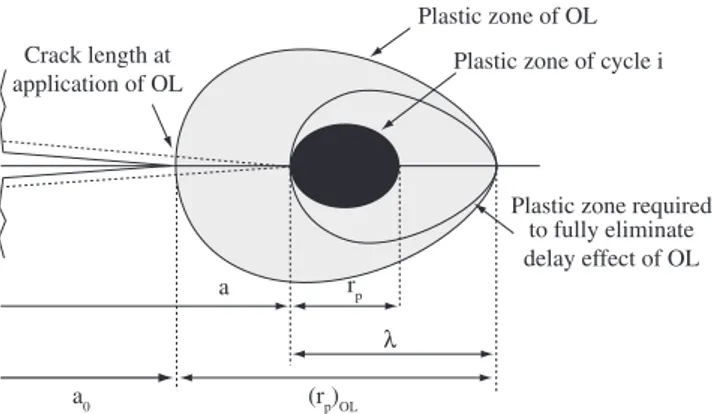
According to this model, the retardation factor g is assumed to be a power function of the ratio rp/λ, where rp is the current plastic zone size corresponding to a given crack length a and λ the distance between the crack tip and the edge of the OL plastic zone as presented in Figure 1.
Thus gcan be expressed as:
g = (rp/ λ)m (2)
where the exponent m is an empirical constant dependent on the type of the VA load history.
Assuming plane stress loading conditions, the current plastic zone size rp can be calculated from the expression below:
rp K
Y =
1 2
π σmax (3)
where Kmax corresponds to the CA loading for a crack length a and
σY is the yield stress. For a crack length a, λ is given by the
expres-sion:
λ= a0 + (rp)OL – a (4)
where a0 is the crack length at which the overload was applied and (rp)OL is the overload plastic zone size, that can be calculated, assuming plane stress loading, using the following expression:
rp K
OL
OL Y
( )
=
1 2
π σ (5)
where KOL is the OL stress intensity factor calculated according to literature14,21.
As the crack propagates through the delay zone, rp becomes larger whereas λ gets smaller. As a result, g will increase gradually from its minimum value gmin to a maximum value of unity as the far edge of the current plastic zone starts to exit the OL plastic zone and the delay effect would thus be gone. With this in mind, one can estimate, from the following relation, the fatigue crack length over which the delay effect does in fact act, i.e., the delay zone length ∆ad*:
∆ad* = (rp)OL – r*p (6)
where r*p is the size of the current plastic zone which reaches the far edge of the OL plastic zone.
The model proposed by Willenborg15 is based on the assumption
that crack growth delay after an OL is due to a reduction in Kmax,
Crack length at application of OL
Plastic zone of OL
Plastic zone of cycle i
Plastic zone required to fully eliminate delay effect of OL
a rp
(rp)OL
L
a0
corresponding to the current crack length. According to the model, the reduction in Kmax, Kred, is given by15:
Kred = Kreq – Kmax (7)
where Kreq is the stress intensity factor necessary to produce a plastic zone that extends a distance λahead of the advancing fatigue crack tip, to the far edge of the OL plastic zone, as presented earlier in Figure 1. Under plane stress conditions, Kreq at a given crack length a can be determined from the expression:
Kreq= σ πλY (8)
The size of the overload plastic zone can be determined from Equation 8 by substituting KOL for Kreq. Taking into account the reduction in the stress intensity factor due to overloading, one can define effective values of Kmax and Kmin as follows:
Kmax,eff = Kmax – Kred (9)
Kmin,eff = Kmin – Kred (10)
where Kmin is related to CA loading.
From the effective stress intensity levels given above, one can, in turn, define in the usual manner the effective stress intensity factor range, ∆Keff, as well as the effective stress intensity factor ratio Reff. At this point, it is important to note that Equations 9 and 10 indicate that ∆Keff is equivalent to ∆K. However, according to the Willenborg model, negative values of Kmin,eff should be taken as null and ∆Keff becomes equal to Kmax,eff in this case.
Knowing ∆Keff and Reff, the fatigue crack propagation rate (da/dN)VA within the delay zone can be estimated and then related to the corresponding propagation rate at the baseline level (da/dN)CA by the retardation factor g defined in Equation 1.
Fatigue crack growth rate under CA loading can be predicted from the relation proposed by Forman and co-workers22, as shown
in Equation 11 below:
da dN
C K
R K K
CA
n
c
= − −
( )
( )
∆ ∆
1 (11)
where C and n are the Paris law material constants and Kc is the material’s toughness.
Within the delay zone that follows the application of an OL, the crack propagation rate (da/dN)VA can be calculated by substituting
∆Keff and Reff for ∆K and R in Equation 11. After passing through the minimum that follows an overload, the retardation factor g starts to increase and eventually becomes equal to unity, thus restoring the propagation rate back to the baseline level at the end of the delay zone. The basic feature of the Willenborg model, therefore, refers to the fact that crack growth retardation, which follows overloading, ends when the values of ∆Keff and Reff converge to those of ∆K and R. The current crack length, a*, at which such convergence takes place can thus be determined and the delay zone length ∆ad* will be given by the difference between a* and a0.
Based on Equation 11, (da/dN)CA and (da/dN)VA can be calculated and the delay factor gfor a given crack length a can, therefore, be expressed as:
g =
− −
− −
∆
∆
∆ ∆ K
K
R K K
R K K
eff n
c eff c eff
( )
( )
1
1 (12)
3. Experimental and Materials
The material used for this investigation is an R3 grade structural steel largely adopted for fabricating offshore mooring chains23. The
steel, which contains, in weight percent, 0.26% C, 1.2% Cr, 1.75% Mn, 0.35% Ni, was received in the form of hot rolled round bars of circular cross section with a nominal diameter of 85 mm. The circu-lar bars were bent in conformity with the typical stud link geometry before they were butt flash welded23. Following the welding process,
a number of links were austenitized at 900 °C for 90 minutes, water quenched and then tempered at 620 °C for 90 minutes.
Compact tension (CT) specimens were machined along the L-T orientation, in accordance with the ASTM E647-99 recommenda-tion21. The CT specimens were cut off from the welded joint as well as
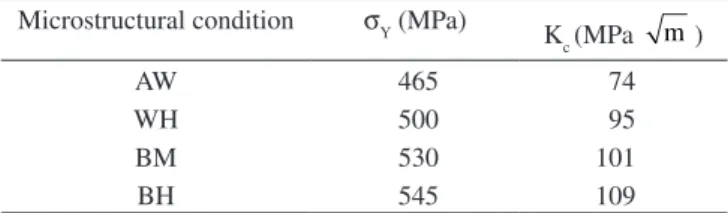
from the opposite side of the links in both as-welded and heat treated conditions. The study, therefore, was carried out contemplating four different microstructural conditions: as-welded joint (AW), welded and heat treated joint (WH), as-received base metal (BM) and heat treated base metal (BH). Table 1 indicates the yield stress (σY) and fracture toughness (Kc) for these four different microstructural conditions.
The specimen width, W, and specimen thickness, B, were taken as 32 and 8 mm, respectively, and a starter notch was machined to a depth of 7 mm. The specimen surfaces were polished and fine lines were drawn parallel to the specimen axis in order to facilitate monitoring crack growth during cyclic loading. Finally, the CT specimens were precracked up to a crack length of 2 mm, i.e., to a total crack length-to-specimen width ratio, a/W, of 0.28. The AW and WH specimens were precracked in a way such that the crack plane always coincided with the weld plane.
CA cyclic loading was applied to the precracked specimens so as to obtain the typical da/dN vs. ∆K curves for the microstructural conditions in question. The tests were performed at room temperature using a servo-hydraulic machine, operated at a frequency of 20 Hz. All the CT specimens were submitted to a tension-tension mode I loading with a maximum load of 9 kN and a load ratio R of 0.33, and fatigue crack length was monitored using a traveling microscope. The values of Kmax calculated at different crack lengths within the delay zone did not satisfy the ASTM criterion for plane strain conditions for the CT specimen thickness21 and as the measurements of crack
length were made on the specimen surface, the use of Equation 3 to estimate rp is considered pertinent.
Overload cycles were applied manually at a/W = 0.33 under load control by increasing the load to the defined level, going down to the minimum value of 3 kN and then returning to the CA loading scheme. The overload ratio ROL, defined by KOL / Kmax24, was taken as
1.5 and 1.8 which correspond to single overload levels of 13.5 and 16.2 kN. Here again the use of plane stress conditions to estimate (rp)OL is considered appropriate in virtue of the higher KOL level in comparison with Kmax.
4. Results and Discussion
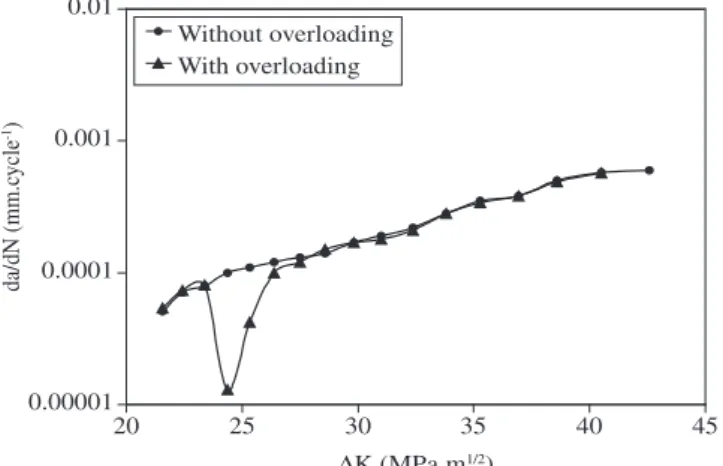
Examples of the fatigue crack growth rate da/dN vs. the stress intensity factor range ∆K, under constant and variable amplitude loading, are presented in Figures 2 to 5. These figures exemplify the crack growth retardation caused by a single overload applied at an a/W ratio of 0.4. They also indicate that, under CA loading, the
Table 1. Materials properties according to the microstructural condition.
Microstructural condition σY (MPa)
Kc (MPa m)
AW 465 74
WH 500 95
BM 530 101
to increase and eventually returns, over some crack extension ∆ad, to the normal growth rate at the CA baseline level. The values of
∆ad, together with those of the minimum retardation factor gmin, are presented in Table 2 for the microstructural and overload conditions considered in this work. The values of the corresponding OL plastic zone size, calculated making use of Equation 5, are also listed in the same table, for comparison. At this point it is important to mention that the crack propagation rate used for estimating gmin was taken as the values of da/dN after a crack length increment ∆a of 0.5 mm following overloading. As reported by Skorupa3, a decrease in the
specimen thickness results in delaying the retardation of crack growth following a single overload. Accordingly, the minimum in da/dN is reached only after a given crack length increment, within the delay zone, that increases with the decrease in specimen thickness. For plane stress loading, therefore, the gmin values listed in Table 2 are considered to be reasonable estimates of the minimum retardation factor.
The results presented in Table 2 indicate that an increase in the overload ratio ROL from 1.5 to 1.8 is more effective in retarding crack growth in the welded joints than in the base metal. This is clearly evidenced by comparing the values of gmin associated with the applied overloads for each of the microstructural conditions in question. The behavior of gmin described above is seen to be consistent with what was reported, in a previous work25, on extending the residual fatigue
life in these microstructures. The delay cycles number was found to increase by a factor of about 7 for both AW and WH joints as ROL was increased from 1.5 to 1.8. For the base metal, on the other hand, this factor amounted to less than 3. This marked improvement in the fatigue behavior of the welded joints, upon increasing the intensity of overloading, is believed to be associated with crack growth retardation mechanisms, which become increasingly operative at higher over-loads. A mechanism such as strain hardening of the material within the OL plastic zone26 would have its efficiency improved by increasing
0.00001 0.0001 0.001 0.01
20 25 30 35 40 45
$K (MPa.m1/2)
da/dN (mm.c
ycle
-1)
Without overloading With overloading
Figure 2. da/dN vs. ∆K for AW microstructural condition after an overload of 16.2 kN.
0.00001 0.0001 0.001 0.01
20 25 30 35 40 45 50 55 60
$K (MPa.m1/2)
da/dN (mm.c
ycle
-1)
Without overloading With overloading
Figure 3. da/dN vs. ∆K for WH microstructural condition after an overload of 13.5 kN.
Without overloading With overloading
0.00001 0.0001 0.001 0.01
20 25 30 35 40 45 50 55 60 65
$K (MPa.m1/2)
da/dN (mm.c
ycle
-1)
Figure 4. da/dN vs. ∆K for BM microstructural condition after an overload of 16.2 kN.
fatigue crack propagates at a higher rate in the welded joint than in the base metal. This is seen to be associated with the fact that crack propagation in the joints occurs along a natural path represented by the weld plane.
As well known, the maximum retardation in crack propagation is reached only after a small crack length increment20. After
pass-ing the point of maximum retardation, the crack growth rate starts
0.00001 0.0001 0.001 0.01
20 25 30 35 40 45 50 55 60 65
$K (MPa.m1/2)
da/dN (mm.c
ycle
-1)
Without overloading With overloading
Figure 5. da/dN vs. ∆K for BH microstructural condition after an overload of 13.5 kN.
Table 2. Values of gmin and ∆ad determined experimentally.
Specimen ROL = 1.5 ROL = 1.8
Code gmin ∆ad
(mm) (rp)OL (mm)
gmin ∆ad
(mm) (rp)OL (mm)
AW 0.40 2.0 4.65 0.14 3.0 6.7
WH 0.42 1.3 4.0 0.14 2.5 5.8
BM 0.39 1.5 3.6 0.20 2.0 5.16
the intensity of overloading, particularly for the welded joints, whose tensile behavior25 indicates that they deform plastically with a higher
work hardening rate than the base metal. Whether other retardation mechanisms, such as crack blunting27 and crack surface asperity28,
could have the same behavior requires further investigation.
4.1. Application of the Wheeler Model
An experimental value of g, corresponding to a given crack length a within the delay zone, ∆ad, can be used to estimate the exponent m by substituting in Equation 2 the appropriate rp and g values cal-culated, respectively, from Equations 3 and 4. The value of m thus obtained was found to vary with the crack length a, giving rise, as can be verified from Table 3, to a considerable degree of scatter. The
∆ad* values estimated from Equation 6 are listed in the same table in comparison with the values determined from the experimental data
∆ad. One can conclude from this comparison that the delay zone measured experimentally agrees fairly well with the calculated ∆ad* value for each of the microstructural conditions considered in this study. Further, it is also observed that ∆ad tends to decrease from top to bottom of the table, i.e., with the increase in the yield stress.
The values of m listed in Table 3 can be used to calculate, from Equation 2, the retardation factor g at different crack length increments within the delay zone. The values thus obtained are denoted gc and are presented in Table 4 in comparison with their experimental counter-parts ge for the AW and BH microstructural conditions. Although gc and ge are seen to be in good agreement, it is evident that the use of a unique m value may lead to underestimating the retardation factor as crack propagation proceeds. These observations appear, as pointed out by Schijve20, to corroborate the limitations of the Wheeler model
in predicting the crack growth behavior under VA loading.
4.2. Application of the Willenborg Model
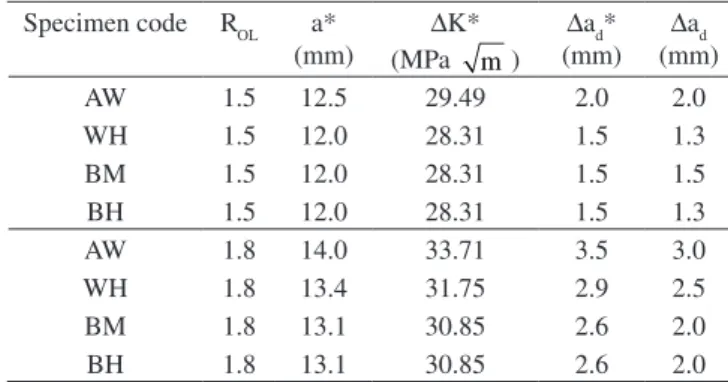
The crack length a*, at which ∆Keff and Reff converge to ∆K and R, is presented in Table 5 for the microstructural and overload conditions
considered in this study. The corresponding ∆K value, denoted ∆K*, the extent of the delay zone ∆ad* and the experimental counterpart
∆ad are also presented in the same table. As this table indicates, ∆ad* agrees fairly well with ∆ad and hence one can use the Willenborg model to predict the extent of the delay zone resulting from overload-ing. In regard to the retardation factor, as predicted by the Willenborg model, the values of g can be calculated making use of Equation 12 and then compared with those determined experimentally.
Examples of this comparison for AW and BH microstructural conditions are shown in Table 6, where one can observe the good agreement between the calculated values (gc) and those experimentally detected (ge) for the overload ratio of 1.5. However, for ROL amounting to 1.8, gc is seen to be invariably lower than its experimental counter-part ge, and, as expected, they both converge to unity as the fatigue crack heads towards the end of the delay zone.
At this point one should mention that the relationship between gc and ge as described above is in fact typical of the four microstructural conditions considered in this work. Accordingly, it can be concluded that the applicability of the Willenborg model to predicting the retardation factor following overloading depends on the magnitude of the applied overload. While, in the present study, this prediction was found to be precise for ROL of 1.5, the model overestimates the retardation effect associated with a higher ROL of 1.8.
4.3. Prediction of the residual fatigue life extension
The extension of the residual fatigue life due to the application of a single overload can be estimated from the expression:
N da
da dN
da da dN
c CA
a a
CA a
a *
* *
( / ) ( / )
=
∫
−∫
g
0 0
(13)
Table 3. Delay parameters ∆ad* and m as determined for the Wheeler model.
Specimen ROL = 1.5 ROL = 1.8
Code ∆ad
(mm)
∆ad* (mm)
m ∆ad
(mm)
∆ad* (mm)
m
AW 2.0 1.8 1.5 ± 0.2 3.0 3.0 1.5 ± 0.4
WH 1.3 1.5 1.5 2.5 2.7 1.6 ± 0.3
BM 1.5 1.5 1.3 ± 0.3 2.0 2.5 1.4 ± 0.2
BH 1.3 1.5 1.2 2.0 2.7 1.5 ± 0.1
Table 4. Experimental and Wheeler-predicted values of the retardation factor at different crack length increments within the delay zone.
Specimen code ROL a (mm) gc ge
AW 1.5 11.0 0.40 0.40
1.5 11.5 0.54 0.60
1.5 12.0 0.76 0.75
1.5 12.5 1.00 1.00
BH 1.8 11.0 0.23 0.21
1.8 11.5 0.31 0.34
1.8 12.0 0.43 0.87
1.8 12.5 0.61 1.00
1.8 13.0 1.00 1.00
Table 6. Experimental and Willenborg -predicted values of the retardation factor at different crack length increments within the delay zone.
Specimen code ROL a (mm) gc ge
AW 1.5 11.0 0.40 0.40
1.5 11.5 0.61 0.60
1.5 12.0 0.80 0.75
1.5 12.5 1.00 1.00
BH 1.8 11.0 0.07 0.21
1.8 11.5 0.23 0.34
1.8 12.0 0.56 0.87
1.8 12.5 0.70 1.00
1.8 13.0 0.95 1.00
Table 5. Values of the crack length a* and the stress intensity factor range ∆K* as predicted by the Willenborg model at the end of the delay zone.
Specimen code ROL a*
(mm)
∆K*
(MPa m)
∆ad* (mm)
∆ad (mm)
AW 1.5 12.5 29.49 2.0 2.0
WH 1.5 12.0 28.31 1.5 1.3
BM 1.5 12.0 28.31 1.5 1.5
BH 1.5 12.0 28.31 1.5 1.3
AW 1.8 14.0 33.71 3.5 3.0
WH 1.8 13.4 31.75 2.9 2.5
BM 1.8 13.1 30.85 2.6 2.0
where N* is the delay cycles number and a* the crack length at which the crack propagation rate is restored back to the base line level. Knowing the values of (da/dN)CA at different crack length increments within the delay zone, one can numerically evaluate the integrals in the above equation and hence calculate N*.
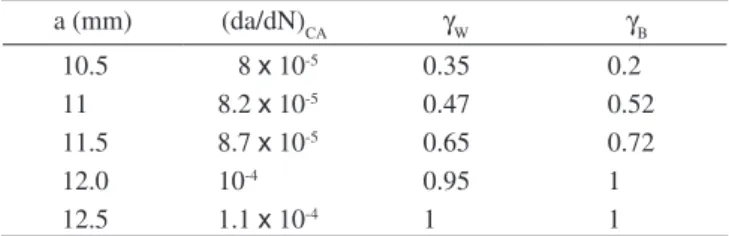
The rate of crack propagation in the base metal, associated with ROL of 1.5, is listed in Table 7 at different crack lengths within the delay zone. The last two columns in this table refer to the correspond-ing retardation factors as predicted by the Wheeler and Willenborg models.
Based on the data presented in the same table, delay cycles numbers of 10085 and 7865 were obtained from Wheeler and Wil-lenborg models, respectively. Comparing these numbers with the value of 10160 determined experimentally25, one can conclude that
the Wheeler model is more precise in predicting residual fatigue life extension than the Willenborg model. A complete comparison is presented in Table 8, where Ne represents the delay cycles number determined experimentally25, while N
W* and NB* are the numbers
predicted by the Wheeler and Willenborg models, respectively. As can be observed from this table, the base metal responds to overloading more favorably than the welded joints. Again, this is attributed to the fact that crack propagation in the joints takes place along the weld plane. However, on increasing ROL from 1.5 to 1.8, the delay cycles numbers Ne observed for the joints approach those observed for the base metal. At ROL of 1.5, the delay cycles numbers predicted by both models are seen to be in fair agreement. In comparison with the experimental data, though, the Willenborg model underestimates the response of the base metal to such a level of overloading. For the welded joints both models overestimate the number of delay cycles, which is believed to be consistent with the high propagation rate along the weld plane.
For the higher overload ratio, the use of the Willenborg model implies in extremely overestimated values of the delay cycles numbers associated with the four microstructural conditions in question. The Wheeler model predictions, on the other hand, are seen to be in fair agreement with the experimental Nevalues, for the base metal. As to
the welded joints, the discrepancy becomes higher, consistent with the higher crack propagation rate along the weld plane.
5. Concluding Remarks
The purpose of the present work was to evaluate the applicabil-ity of the models proposed by Wheeler and Willenborg to predicting fatigue crack growth retardation in a structural steel largely adopted for fabricating offshore mooring chains. From what is presented above regarding the fatigue behavior of the steel and its flash welded joints, the following remarks can be made:
•Under the same CA loading conditions, fatigue crack growth is invariably higher in the welded joints than in the base metal. This is considered to be consistent with the fact that crack propagation in the joints occurs along the weld plane;
•An increase in the overload ratio from 1.5 to 1.8 results in a more effective crack growth retardation as evidenced by the increase in the extent of the delay zone and by a decrease in the retardation factor. The observation that the influence of increas-ing overload is more pronounced for the joints is attributed, essentially, to their higher work hardening rate in comparison with that of the base metal;
•The extent of the fatigue crack growth retardation zone pre-dicted by both the Wheeler and Willenborg models agrees fairly well with the experimental observations made on the flash welded steel joints as well as on the base metal;
•The form of the power function proposed by Wheeler for the retardation factor implies in different values of the exponent m as calculated from the experimental data. A single value of that exponent would therefore lead to imprecise estimates of the crack propagation rate along the delay zone;
•The applicability of the Willenborg model to predicting the retardation factor depends on the level of overloading. While, in the present study, this prediction was found to be precise for the overload ratio of 1.5, the model overestimates the retarda-tion effect due to higher overload ratios;
•For the low overload ratio (ROL = 1.5), both the Wheeler and Willenborg models overestimate the delay cycles numbers, as predicted for the welded joints. This is seen to be due to crack propagation along the weld plane;
•The delay cycles numbers predicted by the Wheeler model were found to be in good agreement with those observed ex-perimentally for the base metal at the low overload ratio. The Willenborg model, on the other hand, results in underestimated values, although still considered to be in fair agreement with those experimentally observed. Both models, though, overes-timate residual fatigue life extension for the welded joints at this level of overloading; and
•The use of the Wheeler model to predict the delay cycles numbers at the high overload ratio (ROL = 1.8) results in over-estimated values, although in fair agreement with the experi-mental data. The Willenborg model, on the other side, implies in extremely overestimated values and hence should not be used to predict residual fatigue life extension at high overload ratios (ROL > 1.6) for any of the microstructural conditions in question.
References
1. Schijve J. Fatigue crack propagation in light alloy sheet materials and structures. Report No. MP-195. National Luchtvaart Laboratorium. Amsterdam, The Netherlands; 1960.
2. McEvily AJ, Ishihara S. On the retardation in fatigue crack growth rate due to an overload: a review. In: Pimenta PM, Ricardo LCH, Camarão
Table 7. Values of the retardation factors gW and gB calculated for the BM microstructural condition by the Wheeler and Willenborg models, respec-tively.
a (mm) (da/dN)CA gW gB
10.5 8 x 10⁻⁵ 0.35 0.2
11 8.2 x 10⁻⁵ 0.47 0.52
11.5 8.7 x 10⁻⁵ 0.65 0.72
12.0 10-4 0.95 1
12.5 1.1 x 10⁻⁴ 1 1
Table 8. Delay cycles numbers calculated using the Wheeler and Willenborg models.
Specimen code ROL Ne NW* NB*
AW 1.5 3410 13463 11947
WH 1.5 3830 11239 7710
BM 1.5 10160 10085 7865
BH 1.5 10880 9231 7122
AW 1.8 22500 44000 177260
WH 1.8 23510 42968 106000
BM 1.8 26740 34051 120000
AF, editors. Modern trends on fatigue. Proceedings of the SAE Brazil International Conference on Fatigue; 2001 Dec 12-14; São Paulo, Brazil. São Paulo: SAE Brazil; 2001. p. 145-150.
3. Skorupa M. Load interaction effects during fatigue crack growth under variable amplitude loading – a literature review. Part I: empirical trends.
Fatigue and Fracture of Engineering Materials and Structures. 1998; 21:987-1006.
4. Ward-Close CM, Blom AF, Ritchie RO. Mechanisms associated with transient fatigue crack growth under variable-amplitude loading: An experimental and numerical study. Engineering Fracture Mechanics. 1989; 32:613-638.
5. Damri D, Knott JF. Transient retardation in fatigue crack growth following a single peak overload. Fatigue and Fracture of Engineering Materials and Structures. 1991; 14:709-719.
6. Shin CS, Hsu SH. On the mechanisms and behaviour of overload retarda-tion in AISI 304 stainless steel. International Journal of Fatigue. 1993; 15:181-192.
7. Tsukuda H, Ogiyama H, Shiraishi T. Transient fatigue crack growth behaviour following single overloads at high stress ratios. Fatigue and Fracture of Engineering Materials and Structures. 1996; 19:879-891. 8. Shuter DM, Geary W. Some aspects of fatigue crack growth retardation
behaviour following tensile overloads in a structural steel. Fatigue and Fracture of Engineering Materials and Structures. 1996; 19:185-199. 9. Robin C, Louah M, Pluvinage G. Influence of the overload on the fatigue
crack growth in steels. Fatigue and Fracture of Engineering Materials and Structures. 1983; 6:1-13.
10. Chen GL, Roberts R. Delay effects in AISI 1035 steel. Engineering Fracture Mechanics. 1985; 22:201-212.
11. Warke WR, Weiss V, editors. Basic questions in fatigue, Vol. 1. Philadel-phia: American Society for Testing and Materials; 1988. p. 157-183.
12. Venkateswara Rao KT, Ritchie RO. Micromechanisms of transient fatigue crack growth behaviour in aluminium-lithium alloys following single tensile overloads. In: Petit J, Davidson DL, Suresh S, Rabbe P, editors.
Fatigue crack growth under variable amplitude loading. London: Elsevier Applied Science; 1988. p. 134-145.
13. Wheeler OE. Spectrum loading and crack growth. Journal of Basic Engineering. 1972; 94:181-186.
14. Broek D. Elementary engineering fracture mechanics. Fourth revised ed. Dordrecht: Kluwer Academic Publishers; 1986.
15. Willenborg J, Engle RM, Wood HA. A crack growth retardation model using an effective stress concept. Report No.AFFDL-TR71-1. Air Force Flight Dynamic Laboratory. Wright-Patterson Air Force Base, USA; 1971.
16. Baudin G, Robert M. Crack growth life time prediction under aeronautical type loading, In: Faria L, editor. Life assessment of dynamically loaded
materials and structures. Proceedings of the Fifth European Conference on Fracture ECF-5; 1984 Sep 17-21; Lisbon, Portugal. Warley: Engineer-ing Materials Advisory Services Ltd.; 1985. p. 779-792.
17. Topper TH, DuQuesnay DL. The effects of overloads in service load histories on crack closure and fatigue damage. In: Pimenta PM, Ricardo LCH, Camarão AF, editors. Modern trends on fatigue. Proceedings of the SAE Brazil International Conference on Fatigue; 2001 Dec 12-14; São Paulo, Brazil. São Paulo: SAE Brazil; 2001. p. 43-54.
18. Allison JE. The measurement of crack closure during fatigue crack growth. In: Read DT, Reed RP, editors. American Society for Testing and Materials; ASTM STP 945; 1988 June 25-27; Boulder, USA. Philadelphia: American Society for Testing and Materials; 1988. p. 913-933.
19. Wang GS, Blom AF. A strip model for fatigue crack growth predictions under general load conditions. Engineering Fracture Mechanics. 1991; 40: 507-53.
20. Schijve, J. Fatigue of structures and materials. Dordrecht: Kluwer Aca-demic Publishers; 2001.
21. American Society for Testing and Materials. Standard test method for measurements of fatigue crack growth rates. ASTM E647-01. 2001 Annual Book of ASTM Standards. Philadelphia: American Society for Testing and Materials; 2001.
22. Forman RG, Kearney VE, Engle RM. Numerical analysis of crack growth propagation in loaded structures. Journal of Basic Engineering. 1967; 89:459-464.
23. American Bureau of Shipping. Guide for certification of offshore mooring chains. New York: American Bureau of Shipping; 1999.
24. Decoopman X, Imad A, Nait-Abdelaziz M, Mesmacque G. Effect of baseline loading on fatigue crack growth retardation due to an overload-ing. In: Brown MW, de los Rios ER, Miller KJ, editors. Fracture from Defects. Proceedings of the Twelfth European Conference on Fracture ECF-12; 1998 Sep 14-18; Sheffield, UK. Warley: Engineering Materials Advisory Services Ltd.; 1998. p. 265-270.
25. Lopes MR, Pereira MV, Darwish, FA, Camarão AF. Improvement of residual fatigue life in a flash welded structural steel. In: Blom AF, editor.
Fatigue 2002. Proceedings of the Eighth International Fatigue Congress; 2002 Jun 3-7; Stockholm, Sweden. Warley: Engineering Materials Advi-sory Services Ltd.; 2002. p. 445-452.
26. Hammouda MMI, Ahmad SSE, Sherbini AS, Sallam HEM. Deformation behaviour at the tip of a physically short fatigue crack due to a single overload. Fatigue and Fracture of Engineering Materials and Structures. 1999; 22:145-151.
27. Knott JF, Pickard AC. Effects of overloads on fatigue crack propagation: aluminium alloys. Metal Science. 1977; 11:399-404.