D.E.L.T.A., 32.2, 2016 (449-480)
D E L TA
Cross-cultural and cross-linguistic perception of
authentic emotions through speech: An acoustic–
phonetic study with Brazilian and Swedish listeners
Percepção intercultural e interlinguística de emoções
autênticas na fala: Estudo fonético-acústico com sujeitos
brasileiros e suecos
Wellington da SILVA
(Universidade Estadual de Campinas - UNICAMP) Plinio Almeida BARBOSA
(Universidade Estadual de Campinas - UNICAMP) Åsa ABELIN
(Göteborgs universitet)
ABSTRACT
This study was conducted to investigate whether the listeners’ culture and mother language infl uence the perception of emotions through speech and which acoustic cues listeners use in this process. Swedish and Brazilian listeners were presented with authentic emotional speech samples of Brazilian Portuguese and Swedish. They judged on 5-point Likert scales the expression of basic emotions as described by eight adjectives in the utterances in Brazilian Portuguese and the expression of fi ve emotional dimensions in the utterances in Swedish. The PCA technique revealed that two components explain more than 94% of the variance of the judges’
*. Acknowledgments - This work was funded by a fellowship from the São Paulo Research
450
responses in both experiments. These components were predicted through multiple linear regressions from twelve acoustic parameters automatically computed from the utterances. The results point to a similar perception of the emotions between both cultures.
Key-words: expressive speech;basic emotions; emotional dimensions; intercultural communication.
RESUMO
Este estudo foi conduzido para investigar se a cultura e a língua materna dos ouvintes infl uenciam a percepção das emoções na fala e quais pistas acústicas os ouvintes utilizam nesse processo. Trechos de fala de emoções autênticas em português brasileiro e em sueco foram apresentados a sujeitos brasileiros e suecos. Os sujeitos avaliaram, em escalas de 5 pontos, o grau de expressão de emoções básicas descritas por oito adjetivos nos enunciados em português brasileiro e o grau de expressão de cinco dimensões emocionais nos enunciados em sueco. A técnica de PCA revelou que dois componentes explicam mais do que 94% da variância das respostas dos juízes nos dois experimentos. Esses componentes foram preditos através de regressões lineares múltiplas por doze parâmetros acústicos automaticamente extraídos dos enunciados. Os resultados mostram uma percepção semelhante das emoções entre ambas as culturas.
Palavras-chave: fala expressiva; emoções básicas; dimensões emocionais; comunicação intercultural.
1. Introduction
Emotions are very important for social interactions and for interpersonal relationships, as they signal information about others’ feelings, attitudes, behavioural intentions, as well as aspects of events or situations in the environment. Observers, thus, may use such information to adjust their behaviour according to a specifi c situation (Frijda & Mesquita 1994; Van Kleef 2009). Decades of research have shown that the voice is a powerful tool for expressing emotion. In addition to conveying linguistic information, the speech signal (i.e.
451
(Laver & Trudgill 1979). In fact, listeners can satisfactorily recognise emotions expressed through speech in perception experiments, showing an accuracy rate much higher than what would be obtained by chance (Pittam & Scherer 1993).
The infl uence of the speaker’s emotional state on his/her voice occurs because emotions cause, among other reactions, physiological responses on the individual. These responses, in turn, cause variations in respiration, phonation and articulation, which are processes directly related to speech, and thus affect the speech prosody (Scherer 1986). Moreover, emotions can also affect the attention and the cognition of the speaker, which infl uences the speech as well (Johnstone & Scherer 2000).
According to the evolutionary theory of emotions (Darwin 1872/2009), these physiological and motor responses have the function of helping the individual to cope with relevant events in the environment by providing energy to specifi c parts of the body and preparing the organism for dealing with the situation (Scherer 1981). Thus, this theory understands that emotions have been selected in the course of the evolution of the species because these responses helped our ancestors to survive. As a result, one expects to fi nd the same patterns of expression (facial and vocal) for a given emotion in all human cultures (Cornelius 2000). Following this approach, some researchers have postulated the existence of a small set of universal emotions (known as basic, discrete, or fundamental), which are very different from each other and have specifi c patterns of cognitive appraisal, expression, and physiological changes (Izard 1977; Tomkins 1984; Ekman 1992; and others). These emotions receive labels by the natural languages such as joy, sadness, fear, disgust, surprise, anger etc.
452
be expressed and recognized through speech in the same way in all cultures, regardless of the language, given that the emotion-related changes in the acoustic parameters of speech are mainly results of the physiological and cognitive responses which emotions cause on the speaker (Frick 1985; Scherer 1986).
A classic study on this subject is that carried out by Scherer, Banse, & Wallbott (2001). The study involved listeners from nine countries (Germany, French-speaking Switzerland, England, Netherlands, United States, Italy, France, Spain and Indonesia). The authors used meaningless sentences spoken by four German actors (two male and two female) portraying anger, sadness, fear, joy, and neutral voice. After listening to each stimulus, the listeners chose one or two of the emotions given in a list. All emotions, including the neutral speech, were recognized by all countries with accuracy rate above the chance level (rate expected when guessing the answers). However, the accuracy rate varied between the nationalities of the raters: the German listeners (who heard the stimuli produced by speakers of their native language) performed the best, followed by the Swiss, the English, the Dutch, the American, the Italian, the French, the Spanish and, fi nally, the Indonesian listeners.
Despite the apparent universality in the recognition of emotions through the voice, this and other studies (Abelin & Allwood 2000; Menezes, Erickson, & Han 2012) have also suggested that listeners are better at recognizing emotions that are expressed by speakers of their own language than by speakers of a foreign one.
The discrete approach is not the only view of the emotional phenomena, though. Some researchers (e.g. Wundt 1874; Schlosberg
1941; Rusell 1980) describe the emotions according to the degree of some emotional dimensions or primitives. These dimensions exist along a continuum and not only as two discrete poles of minimum and
maximum intensity (Schlosberg 1954). The intensity of the dimensions varies along the continuum depending on how the event is appraised by the organism. The most studied emotional dimensions are activation and valence. Activation corresponds to the degree of arousal of the
organism and varies from calm to agitated. Valence corresponds to
453
this dimension as either positive or negative (Kehrein 2002). However, many more dimensions have been proposed in the literature (see, for example, Frijda et al. 1995). Barbosa (2009) used, in addition to these
three dimensions, the dimension of involvement, which is related to the
degree of involvement of the individual with the event and can capture the opposition between attention – rejection (used by Schlosberg 1941). Laukka & Elfenbein (2012) have found that emotional dimensions related to the appraisal of the emotion-eliciting events (e.g. valence,
novelty, urgency, goal conduciveness, etc.) can also be inferred reliably from vocal expressions, which suggests that the speech can also signal information about the cognitive representation of events.
In addition to the dimensions of activation, valence, and involvement, we investigate in this study the perception of the dimensions of fairness
and motivation, which were used by Frijda et al. (1995) among other
dimensions in an inter-cultural study which these authors conducted. These two dimensions were chosen in particular because, as the appraisal of an event as unfair can trigger and increase the intensity of various
emotions, especially anger (Ellsworth & Scherer 2003:581), and the emotion the individual is expressing signals his/her disposition to
establish any kind of relationship with another individual (approaching, avoidance, touching, etc.), we hypothesise that they can also be inferred from speech. Thus, the dimension of fairness is related to the appraisal of the eliciting event by the individual, i.e., whether the individual
considered what happened fair or unfair. Motivation is a dimension related to action readiness, i.e., whether the eliciting event enhanced or
diminished the individual’s disposition to act on the event.
The use of emotional dimensions seems to be better for distinguishing and describing the vocal expression of emotions than the use of labels of discrete emotions (Pereira 2000; Lugger & Yang 2007; Barbosa 2009). Perhaps this is so because, as some studies have suggested, emotions with a similar level for some dimensions (e.g.
activation and valence) share the same patterns for some acoustic parameters (e.g. fundamental frequency and intensity) and this might
454
The majority of the studies on the vocal expression of emotions have been conducted by using emotional speech samples portrayed by professional or lay actors (see Elfenbein & Ambady 2002 or Scherer 2003, for a review). For this reason, it is unclear to what extent acted emotions correspond to real emotions and there is a lack of studies which investigated this relation. It is possible that actors exaggerate the expression of the emotions and emphasize stereotypical features, missing subtle ones which might be found in real expressions (Scherer 2003; Wilting, Krahmer,
& Swerts 2006; Audibert, Aubergé, & Rilliard 2008).
In the study presented in this paper we investigated by means of two perception experiments how Swedish and Brazilian listeners perceive real emotions (as described by discrete emotional labels and emotional dimensions) expressed through speech in their mother language and also in the foreign language (Swedish and Brazilian Portuguese). Our main objectives were to investigate whether the listeners’ culture and mother language affect the perception of the emotions and which acoustic-phonetic parameters among those extracted are used by the Brazilian and Swedish subjects to judge the degree of expression of these emotions in the perception experiments. Because the emotion-related changes in speech are mainly results of the physiological and cognitive responses that the emotions cause on the speaker, we hypothesise that subjects from both cultures perceive the emotions expressed in our corpora in a similar fashion and that their perception is based on the same acoustic parameters.
2. Experiment I
2.1. Materials and Methods
2.1.1. Stimuli
The stimuli of this experiment consisted of 30 emotional speech samples of Brazilian Portuguese, extracted from interviews of 8 women1 of the Brazilian documentary fi lm of 2007 “
Jogo de Cena”
455
(“Playing”). This fi lm compares life narratives told by ordinary women in interviews with the director with the same stories as played by professional actresses. Because the aim of the present study was to investigate real emotional expressions, the utterances were selected from the real interviews only (i.e., the participation of the actresses was
not considered). The duration of each speech sample varied from 3 to 10 seconds and all of them had acceptable quality for performing acoustic analysis. The utterances were saved on the hard drive into wave sound format (.wav) with a sampling frequency of 44.1 KHz (Mono).
2.1.2. Participants
Brazilian listeners: 26 subjects completed this experiment (17
women and 9 men). All of them were born and have lived most part of their life in Brazil and have Portuguese as their mother language. They were either undergraduate or graduate students and reported having no hearing problems. The average age of the judges was 23 years, ranging from 18 to 35 years.
Swedish listeners: 16 subjects completed the experiment (7 men
and 9 women). All of them were born and have lived most part of their life in Sweden and have Swedish as their mother language. They also reported having no knowledge of Portuguese and no hearing impairment. They were undergraduate and graduate students of the University of Gothenburg. Their average age was 26 years, ranging from 20 to 47 years.
2.1.3. Procedure
In this experiment, subjects were asked to rate on 5-point scales ranging from 0, “not at all adjective”, to 4, “very adjective”, the degree
456
in two sessions, carried out in different days. In the fi rst session, the judges assessed the labels joyful, moved, surprised, and sad, whereas in the second one, the adjectives contented, anguished, distressed, and enthusiastic, exactly in this order. The structure of the experiment was kept constant in both sessions and only the adjective to be evaluated was changed. Only the responses of the subjects who took part in both sessions were considered.
The main reason for allowing the listeners to rate the utterances according to multiple labels is the fact that an utterance may convey more than one affective (and emotional) state, which renders some emotions diffi cult for listeners to discriminate, e.g., anger and frustration
or happiness and engagement (Scherer 1998; Hirschberg, Liscombe, & Venditti 2003; Douglas-Cowie, et al. 2005). In addition, the most
used method in studies on the cross-cultural recognition of emotions through speech (and also through facial expressions), which consists in asking subjects to choose one label from a small set of alternatives to describe the emotion expressed in a particular stimulus, has posed many problems for this area of investigation and has been widely criticised in the literature (see, for example, Goddard 2002). We used one adjective for scale (together with the terms “not at all” and “very”) rather than two antonyms (as is the case with the semantic differential scale proposed by Osgood 1952) because some studies suggest that some antonyms are not treated by judges as opposite values of a scale, but rather behave as two distinct affects (Schimmack 2001). The term “not at all” does not imply neutral speech. It means that the speaker does not express at any level the emotion indicated. Thus, it does not rule out the possibility that the speaker is expressing other emotions.
The experiment was developed and carried out over the internet through the “Survey Gizmo” online software (http://www.surveygizmo. com/). The link for accessing the experiment was sent by email to the subjects who were interested in taking part in it. They were asked to use earphones and to do the experiment in a quiet room. The texts of the experiment (instructions, questionnaires, and adjectives) were presented in the mother language of the subjects, i.e. in Portuguese
457
was fi nished loading. The subjects had to mark their response on the scale by clicking on the desired value and then click on the “next” button at the bottom of the page to proceed to the next page (stimulus). It was not possible to return to the previous page or to proceed to the next one without having marked the response on the scale. The judges’ responses were automatically converted to a linear scale ranging from 0 to 1 (0, 0.25, 0.50, 0.75, and 1) to approximate these values with the z-scored values of the acoustic parameters.
2.2. Analyses and Results
The statistical analyses reported in this paper were performed with the software R in its 2.11.1 version (R Development Core Team 2010).
2.2.1. Agreement between the subjects
Because we are not interested in the distances between scale points, but rather in the classifi cation of the intensity of the expressed emotions
(as indicated by the labels placed on the left and on the right of the scales), the subjects’ responses were analyzed as categories. Therefore, we verifi ed the reliability of the listeners’ responses in the experiment by computing the Fleiss’ kappa index (Fleiss 1971), which gives an estimation of the agreement between n raters. This test is signifi cant
for α = 0.001 when z > 3.09. The kappa index is a number between 0 and 1, and the closer to 1, the greater the agreement.
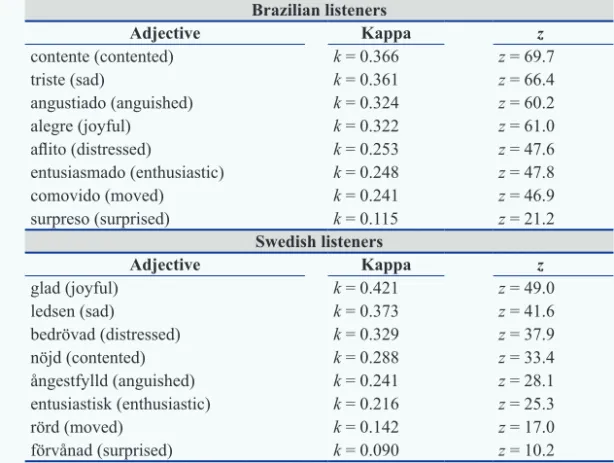
The index was calculated separately for each emotional adjective, with the fi ve levels of responses of the 5-point scales. Table 1 shows the kappa values for the eight emotional labels in descending order, as well as the corresponding z value, for the Brazilian and Swedish listeners.
All kappa values are signifi cant (p < 0.001) and similar to other studies
on the perception of emotions through speech (Alm & Sproat 2005; Devillers et al. 2006; Barbosa 2009). There was satisfactory agreement
for all labels but for surprised, which, although signifi cant, had a low
458
(Ekman 1999) and that it is often confused with other emotions, such as joy and anger (e.g. Abelin & Allwood 2000; Paulmann & Uskul 2014).
Table 1 – Kappa values for the eight emotional adjectives judged by the Brazilian and Swedish listeners in the experiment I and their corresponding z value.
Brazilian listeners
Adjective Kappa z
contente (contented) k = 0.366 z = 69.7
triste (sad) k = 0.361 z = 66.4
angustiado (anguished) k = 0.324 z = 60.2
alegre (joyful) k = 0.322 z = 61.0
afl ito (distressed) k = 0.253 z = 47.6
entusiasmado (enthusiastic) k = 0.248 z = 47.8
comovido (moved) k = 0.241 z = 46.9
surpreso (surprised) k = 0.115 z = 21.2
Swedish listeners
Adjective Kappa z
glad (joyful) k = 0.421 z = 49.0
ledsen (sad) k = 0.373 z = 41.6
bedrövad (distressed) k = 0.329 z = 37.9
nöjd (contented) k = 0.288 z = 33.4
ångestfylld (anguished) k = 0.241 z = 28.1
entusiastisk (enthusiastic) k = 0.216 z = 25.3
rörd (moved) k = 0.142 z = 17.0
förvånad (surprised) k = 0.090 z = 10.2
2.2.2. Identifying the correlated variables
459
For the Brazilian listeners’ responses two PCA factors account for
96.2% of the variance. The fi rst factor explains 80.8% of the variance
and the second one, 15.4%. For the Swedish listeners’ responses two factors account for 94.5% of the variance. The fi rst factor explains
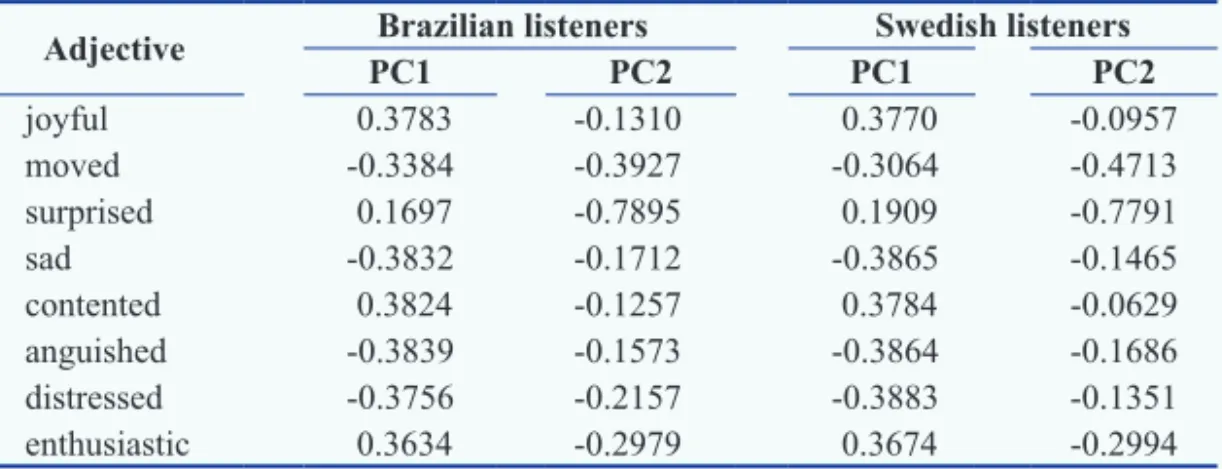
80.3% of the variance and the second factor, 14.2%. Table 2 shows the loadings, which correspond to how much each variable contributes to each one of the factors. The pattern of the loadings was very similar between the two groups of judges. The adjectives related to emotions of positive intrinsic pleasantness (joyful, contented, and enthusiastic) presented a positive loading for the fi rst factor, whereas those adjectives related to negative emotions (moved, sad, anguished, and distressed) presented a negative loading for this factor. All variables presented a negative loading for the second factor.
Table 2 – Loadings of the adjectives judged by the Brazilian and Swedish lis-teners in the experiment I for the fi rst principal component (PC1) and for the second (PC2).
Adjective Brazilian listeners Swedish listeners
PC1 PC2 PC1 PC2
joyful 0.3783 -0.1310 0.3770 -0.0957
moved -0.3384 -0.3927 -0.3064 -0.4713
surprised 0.1697 -0.7895 0.1909 -0.7791
sad -0.3832 -0.1712 -0.3865 -0.1465
contented 0.3824 -0.1257 0.3784 -0.0629
anguished -0.3839 -0.1573 -0.3864 -0.1686
distressed -0.3756 -0.2157 -0.3883 -0.1351
enthusiastic 0.3634 -0.2979 0.3674 -0.2994
One can see in fi gure 1 that the fi rst factor reveals two emotional groups: the adjectives related to emotions of positive valence are clustered together in the upper right corner of the scatter plot, whereas the adjectives related to emotions of negative valence are grouped together in the upper left corner. The adjective surprised does not belong
460
to emphasize that these two words (happiness and neutrality) were used by us only to name the two principal components. Moreover, this result does not imply that “joy” is the semantic opposite of “sadness”, for example, since the negative group negates the positive group as a whole, which only indicates that the listeners were able to distinguish between “happiness” and “non-happiness”.
461
2.2.3. Acoustic analysis
The utterances evaluated by the judges were also subjected to acoustic analysis, in which some acoustic parameters were automatically extracted by means of the script “Expression Evaluator”, implemented for the software Praat (Boersma & Weenink 2011) by Barbosa (2009)2.
The classes of acoustic parameters extracted by this script and used here are: fundamental frequency (f0), fundamental frequency fi rst derivative (df0), global intensity, spectral tilt and Long-Term Average Spectrum (LTAS). The fundamental frequency is an acoustic correlate of the rate of vocal fold vibration and is perceived as the pitch of the voice. Sound intensity corresponds to the variations in the air pressure of a sound wave and is usually measured in decibels (dB). It is the major contributor to the sensation of loudness of a sound. Spectral tilt measures the degree of the drop in intensity as the frequencies of the spectrum increase. The LTAS is a spectrum obtained from the average of several spectra extracted from the speech sample for a particular frequency range. The f0 fi rst derivative is used as a means of revealing abrupt changes in the intonation contour.
These acoustic parameters were chosen because they are likely to undergo changes due to the physiological responses triggered by the emotional processes, being thus potential correlates of the vocal expression of emotions (Frick 1985; Scherer 1986). The parameters spectral tilt and LTAS are acoustic correlates of vocal effort and voice quality, since the increase of vocal effort enhances the energy in the harmonics of high frequencies due to changes in subglottal pressure and in the characteristics of vocal fold vibration (Laukkanen et al.
1997; Traunmüller & Eriksson 2000).
The following statistical descriptors were computed from these classes (yielding a total of twelve parameters):
f0: median, interquantile semi-amplitude, skewness, and 99.5% quantile; df0: mean, standard deviation, and skewness;
global intensity: skewness;
spectral tilt: mean, standard deviation, and skewness; LTAS: slope.
462
The script searches f0 within the range of 75 – 360 Hz in the case of male speakers and 110 – 700 Hz in the case of female speakers by means of the autocorrelation algorithm of Praat and smoothes it by applying a 10-Hz LP fi lter. The statistical descriptors related to f0 and df0 are normalized through the z-score technique3 by using the
following reference values (mean, standard deviation) of f0 in Hz for adult males: (136, 58) and females: (231, 120). The interquantile semi-amplitude is calculated as the difference between the 95% and 5% quantiles, divided by two. The f0 skewness is taken as the difference between f0 mean and f0 median, divided by the f0 interquantile semi-amplitude. The f0 fi rst derivative is computed as the difference in Hz between successive odd-numbered f0 points of the PitchTier object taken in pairs. Spectral tilt is estimated by the difference of intensity in dB between the intensity points of the low band (0 − 1250 Hz) and the high band (1250 − 4000 Hz), taken every ten points. For the sake of normalisation, these values are divided by the complete-band intensity median. Finally, the LTAS slope is computed as the difference of intensity in dB between the bands 0 – 1000 Hz and 1000 – 4000 Hz, divided by 10 for the sake of scale.
2.2.4. Relating the acoustic parameters to the listeners’ perception
Multiple linear regression models were performed to associate the twelve acoustic parameters (independent variables) with the scores of each of the two PCA factors (dependent variable) and thus investigate which acoustic parameters better predict the listeners’ perception of the emotions expressed in the utterances of our corpus. P-values up to 10% were considered as marginally signifi cant and the β values presented below refer to the standardised regression coeffi cients.
The best model for the factor HAPPINESS of the Brazilian judges was the one that combined the parameters f0 skewness (β = 0.23, tdf=25 = 1.440, n.s.4), intensity skewness (β = 0.16, t
df=25 = 0.720, n.s.) and
3. The z-score is a statistical procedure that expresses the distance in terms of standard deviation units of an observation from its mean (here, the reference values).
463
spectral tilt mean (β = -0.60, tdf=25 = -2.683, p < 0.02) and standard
deviation (β = -0.20, tdf=25 = -1.291, n.s.), which yielded an adjusted
R2 of 34% (F4, 25 = 4.717, p < 0.006). For the factor HAPPINESS of
the Swedish judges the combination of the parameters f0 skewness (β = 0.21, tdf= 26 = 1.309, n.s.) and spectral tilt mean (β = -0.46, tdf= 26 = -2.880, p < 0,008) and standard deviation (β = -0.21, tdf= 26 = -1.278,
n.s.) explained 31% (F3, 26 = 5.431, p < 0.005) of its variance.
The parameter spectral tilt mean, which is the one that most contributed to the explained variance of the PC1 of both cultures, presented a negative correlation with this factor (as was also the case with the spectral tilt standard deviation). This means that an increase in the value of this parameter, which is related to the decrease of the energy concentrated in the harmonics of higher frequencies, tended to be perceived by the listeners as a decrease of the level of HAPPINESS of the speakers. Such utterances were judged with high levels for the emotional adjectives moved, sad, anguished, and distressed. The opposite is true for the parameter f0 skewness, which presented a positive correlation with this factor.
The variance of the second factor (NEUTRALITY) of the Brazilian listeners was best predicted by the combination of the parameters f0 median (β = -0.58, tdf=27 = -4.042, p < 0.0004) and spectral tilt skewness
(β = -0.29, tdf=27 = -2.033, p < 0.06), which explained 40% (F2, 27 =
10.46, p < 0.0005) of it, whereas the parameters f0 median (β = -0.39,
tdf= 26 = -2.757, p < 0.02), f0 interquantile semi-amplitude (β = -0.44,
tdf= 26 = -3.052, p < 0.006), and spectral tilt skewness (β = -0.24, tdf=
26 = -1.861, p < 0.08) taken together explained 53% (F3, 26 = 12.07,
p < 0.00004) of the variance of this factor for the Swedish listeners.
As expected, these parameters presented a negative correlation with this factor, which means that when their level increases, the score of NEUTRALITY decreases.
2.3. Discussion
464
a similar fashion and that they would rely on the same acoustic parameters to make their judgements. The analyses with the data from the experiment I have corroborated these hypotheses, as it was revealed that their perception was quite similar in this experiment.
Similar levels of agreement were observed between the Swedish and Brazilian listeners’ responses, and the label surprised presented the
lowest level of agreement in both groups of listeners. PCA showed that the dimensionality of the responses of the listeners from both cultures could be reduced to two components, which together accounted for more than 94% of the total variance for each culture. The fi rst of these components accounted for about 80% of the total variance and revealed two emotional groups for both populations, one which is composed of emotions of positive valence and another which consists of emotions of negative valence. This result indicates that these two PCA factors are very robust and that the Swedish and Brazilian listeners evaluated our Brazilian Portuguese corpus in a very similar way, which means that they have a similar perception of these emotions across the utterances.
Furthermore, the correlation of the scores of the two PCA factors with the acoustic parameters suggested that the acoustic parameters that best explain the responses of listeners from both cultures are, in general, the same: f0 skewness, spectral tilt mean and standard deviation for factor 1, and f0 median and spectral tilt skewness for factor 2. The proportion of the variance accounted for by the combination of acoustic parameters was slightly larger for the Brazilian listeners for the fi rst PCA factor and larger for the Swedish listeners for the second one. This latter difference is mainly due to the contribution of f0 interquantile semi-amplitude, which is higher for the Swedes.
465
3. Experiment II
3.1. Materials and Methods
3.1.1. Stimuli
The stimuli used in this experiment consisted of 40 speech samples from 5 Swedish female speakers5, each one with duration between 1
and 6 seconds and with acceptable quality for performing acoustic analysis. These utterances were extracted from authentic speech (talk shows and interviews) of the Swedish television and of one Swedish interview programme which was freely available over the internet as podcast. They were selected jointly by the fi rst (a native speaker of Brazilian Portuguese) and third author (a native speaker of Swedish) after a careful discussion on their emotional content. They were saved on the hard drive into wave sound format (.wav) with a sampling frequency of 44.1 KHz (Mono).
3.1.2. Participants
Swedish listeners: 19 subjects completed the experiment (6 men
and 13 women). They were students and staff of the University of Gothenburg with no hearing impairment. Their average age was 30 years, ranging from 21 to 56 years. All of them were born and have lived most part of their life in Sweden and have Swedish as their mother language.
Brazilian listeners: 20 subjects completed the experiment (7 men
and 13 women). Their average age was 25 years, ranging from 18 to 34 years. They were either graduate or undergraduate students, were born and have lived most part of the life in Brazil and have Portuguese as their mother language. They reported having no knowledge of the Swedish language at all and no hearing impairment.
466
3.1.3. Procedure
In this experiment, judges were asked to rate on 5-point scales ranging from 0, “not at all adjective”, to 4, “very adjective”, the degree
with which the speaker in each stimulus was expressing the emotional state described by emotional dimensions. The experiment consisted of 5 parts, which were carried out in a single session. In each part the listeners evaluated one emotional dimension for all 40 speech samples. The dimensions investigated in this experiment were: activation, fairness, valence, motivation, and involvement. The stimuli were presented in
a random order, but the emotional dimensions were evaluated by all listeners in this order. After listening to each utterance, the subjects had to judge the degree of expressivity of the emotional dimension specifi c to that part of the experiment by answering a question related to that dimension (e.g. “How agitated was the speaker?”). The questions and
adjectives used for the dimensions are shown in table 3. The texts of the experiment (instructions, questionnaires, and adjectives) were presented in the mother language of the subjects, i.e. in Portuguese for
the Brazilian subjects and in Swedish for the Swedish subjects. The remaining of the procedure is the same as that followed in experiment I (described in section 2.1.3).
Table 3 – Questions and adjectives used for the dimensions in the experiment II (presented for the judges in their mother language, Brazilian Portuguese or Swedish). In each part, the second row shows the question and the third row shows the adjective used in the 5-point scales.
Part 1 - Activation
How agitated was the speaker? not at all agitated (0) ... very agitated (4)
Part 2 - Fairness
How fair did the speaker consider what happened? not at all fair (0) ... very fair (4)
Part 3 - Valence
How pleasant for the speaker was the situation he/she was in? not at all pleasant (0) ... very pleasant (4)
Part 4 - Motivation
How motivated to act on the situation was the speaker? not at all motivated (0) ... very motivated (4)
Part 5 - Involvement
467
3.2. Analyses and Results
3.2.1. Agreement between the listeners
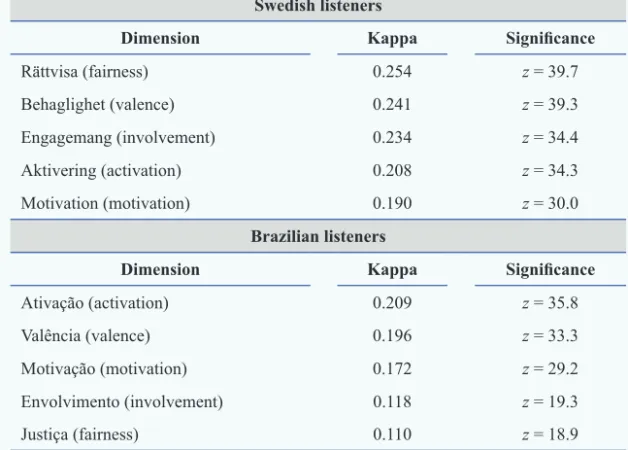
The agreement between the listeners’ responses in this experiment was also verifi ed by means of the Fleiss’ kappa index (Fleiss 1971), which was computed for each dimension and considering the fi ve levels of responses of the 5-point scales. The results are presented in table 4. All the kappa values are statistically signifi cant (p < 0.001). The
agreement between the listeners was slightly lower for the Brazilian judges in all dimensions but activation. Between these listeners, the dimensions of activation and valence achieved the best agreement, whereas between the Swedish listeners the best agreement was achieved by the dimensions of fairness and valence. This is interesting because the dimension of fairness had the lowest agreement between the Brazilians.
Table 4 – Kappa values for the fi ve emotional dimensions judged by the Brazilian and Swedish listeners in the experiment II and their corresponding
z value.
Swedish listeners
Dimension Kappa Signifi cance
Rättvisa(fairness) 0.254 z = 39.7
Behaglighet(valence) 0.241 z = 39.3
Engagemang (involvement) 0.234 z = 34.4
Aktivering(activation) 0.208 z = 34.3
Motivation (motivation) 0.190 z = 30.0
Brazilian listeners
Dimension Kappa Signifi cance
Ativação (activation) 0.209 z = 35.8
Valência (valence) 0.196 z = 33.3
Motivação(motivation) 0.172 z = 29.2
Envolvimento (involvement) 0.118 z = 19.3
468
3.2.2. Identifying the correlated dimensions
PCA was carried out with the mean of the listeners’ responses for each speech sample in order to identify which of the fi ve dimensions correlate with each other. This analysis revealed that for the Swedish listeners’ responses two factors account for 98.2% of the total variance
of the responses. The fi rst of these factors (PC1) accounts for 86% of the variance and the second one (PC2), 12.2%. For the Brazilian listeners’ responses two factors account for 95.4% of the total variance
of the responses. The fi rst of these factors (PC1) accounts for 76% of the variance whereas the second factor (PC2) accounts for 19.4% of the variance.
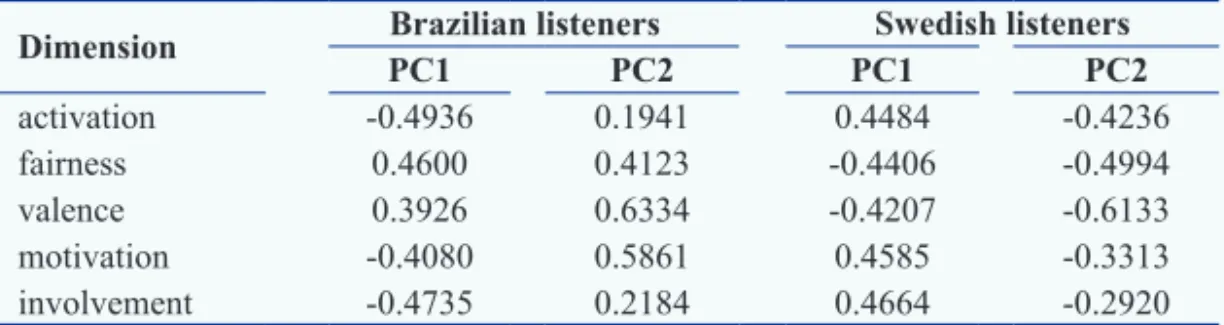
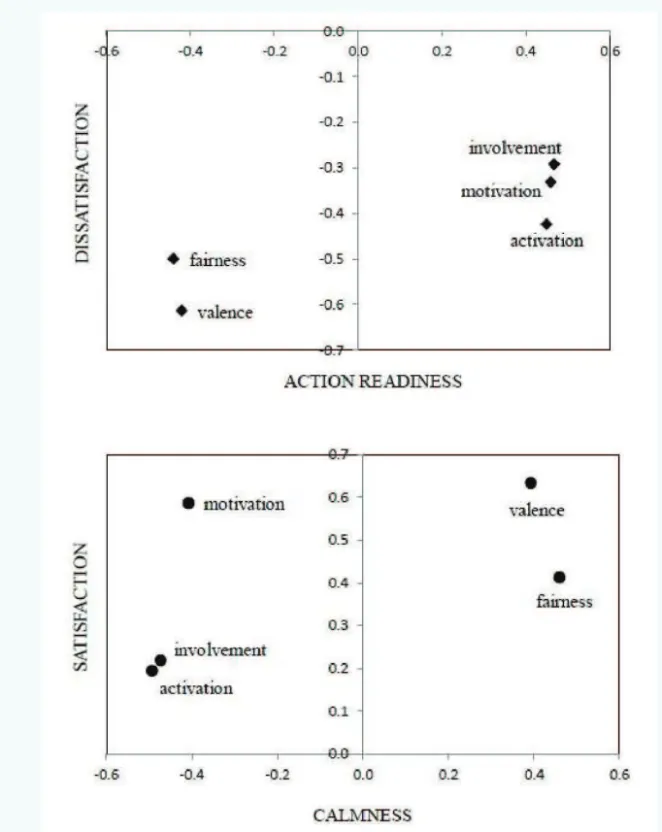
The loadings of the dimensions for these PCA factors are shown in table 5. The dimensions are also plotted according to these loadings on a scatter plot in fi gure 2. It can be observed from this fi gure that both axes of the principal components are inverted between the two groups of listeners. For PC1 the dimensions of fairness and valence presented negative loading for the Swedish listeners’ responses and positive loading for the Brazilian listeners’ responses, whereas activation, motivation, and involvement had negative loading in the latter group and positive loading in the former one. For PC2 all fi ve dimensions presented negative loading for the Swedish listeners’ responses and positive loading for the Brazilian listeners’ responses. However, that does not mean that the Brazilian and Swedish subjects’ perception was different, because the most important is the similarity in the pattern of the loadings of
the dimensions in both principal components, which shows that both groups of listeners distinguished fairness and valence from involvement, motivation, and activation. This inversion of the axes between the cultures was caused by the rotation procedure applied in the PCA.
469
these speakers were very activated, very involved and very motivated to act on the situation). Therefore it seemed appropriate to name the fi rst factor (PC1) ACTION READINESS for the Swedish listeners and CALMNESS for the Brazilians (with antonyms because of the inversion of the axes). Because the dimension of valence presented the most extreme loading in the PC2 for both groups of judges, we called it DISSATISFACTION for the Swedish listeners and SATISFACTION for the Brazilians.
Table 5 – Loadings of the fi ve emotional dimensions judged by the Brazilian and Swedish listeners in the experiment II for the fi rst principal component (PC1) and for the second (PC2).
Dimension Brazilian listeners Swedish listeners
PC1 PC2 PC1 PC2
activation -0.4936 0.1941 0.4484 -0.4236
fairness 0.4600 0.4123 -0.4406 -0.4994
valence 0.3926 0.6334 -0.4207 -0.6133
motivation -0.4080 0.5861 0.4585 -0.3313
involvement -0.4735 0.2184 0.4664 -0.2920
3.2.3. Relating the acoustic parameters to the listeners’ perception
The twelve acoustic parameters described in section 2.2.3 were also automatically computed with the script “Expression Evaluator” for all the 40 utterances used as stimuli in this experiment. Multiple linear regression models were then applied to associate these acoustic parameters with each of the two PCA factors for the Brazilian and Swedish listeners.
Regarding the fi rst principal component of the Swedish listeners, the best model was that combining the parameters f0 median (β = 0.36, tdf=34 = 3.859, p < 0.0005), f0 interquantile semi-amplitude (β = 0.05,
tdf=34 = 0.629, ns.), spectral tilt mean (β = 0.18, tdf=34 = 1.803, p < 0.09),
spectral tilt standard deviation (β = 0.15, tdf=34 = 1.602, ns.), and LTAS slope (β = -0.83, tdf=34 = -6.979, p < 10-7), which accounted for 79%
(F5, 34 = 30.32, p < 10-10) of the variance, whereas for the Brazilian
470
Figure 2 – Dimensions of the experiment II plotted according to their loadings for the fi rst factor of the PCA (horizontal axis) and for the second (vertical axis). Top: Swedish listeners’ judgements; Bottom: Brazilian listeners’ judgements. tdf=37 = 7.829, p < 10-8), which accounted for 82% (F2, 37 = 87.43, p <
471
As indicated by the standardised regression coeffi cients shown above, the parameter LTAS slope presented a negative correlation with the PC1 of the Swedish listeners and a positive correlation with the PC1 of the Brazilian listeners, that is, a decrease in the LTAS slope (caused by the increase of relative intensity in the harmonics of higher frequency) tended to be interpreted by the Swedish listeners as an increase of the degree of ACTION READINESS of the speakers and by the Brazilian listeners as a decrease of the degree of CALMNESS of the speakers. The parameter f0 median (which is the second parameter that most contributed to the prediction of PC1 in the multiple linear regression models) presented a positive correlation with the PC1 of the Swedish listeners and a negative correlation with the PC1 of the Brazilian listeners, suggesting that the increase of this parameter tended to be interpreted by the Swedish listeners as an increase of the degree of ACTION READINESS of the speakers and by the Brazilian listeners as a decrease of the degree of CALMNESS of the speakers. These fi ndings are consistent with the literature (Scherer 1986; Scherer 2003).
The variance of the second PCA factor could not be explained by the acoustic parameters very well. Nevertheless, a multiple linear regression model with the parameters f0 median (β = -0.17, tdf=35 = -1.093, ns.), f0 fi rst derivative mean (β = 0.17, tdf=35 = 1.008, ns.), spectral tilt standard deviation (β = 0.18, tdf=35 = 1.091, ns.), and spectral tilt skewness (β = -0.22,tdf=35 = -1.458, ns.) accounted for 12% (F4, 35
= 2.332, p < 0.08) of the variance of this principal component for the
Swedish listeners. The PC2 of the Brazilian listeners correlated only with the parameter f0 fi rst derivative mean, which explained 8% of
its variance (tdf=38 = -2.101, p < 0.05).
3.3. Discussion
472
The agreement between the listeners, which was verifi ed by means of the Fleiss’ kappa index, indicated that all fi ve emotional dimensions could be reliably inferred by the listeners from both cultures.
The PCA carried out with the mean of the listeners’ responses for each utterance in the fi ve dimensions revealed that more than 95% of the total variance of the responses is explained by two uncorrelated components. The distribution of the dimensions according to their loadings in the fi rst of these principal components suggests that the listeners of both cultures evaluated the fi ve emotional dimensions by distinguishing between a state of “calmness” (rated with higher values for valence and fairness) and a state of higher emotional agitation (rated with higher values for activation, motivation, and involvement).
The parameters f0 median and LTAS slope explained a large proportion of the variance of the fi rst principal component of both cultures (ACTION READINESS and CALMNESS). However, the parameters f0 interquantile semi-amplitude, spectral tilt mean, and spectral tilt standard deviation also contributed to the multiple linear regression of the Swedish listeners. The parameter f0 fi rst derivative mean was useful for predicting the second principal component of both cultures (DISSATISFACTION and SATISFACTION), but the parameters f0 median, spectral tilt standard deviation, and spectral tilt skewness also contributed to the multiple linear regression of this principal component for the Swedish listeners.
Thus, we can conclude from the results of this experiment that the perceptual judgements of the degree of expression of the fi ve emotional dimensions in our Swedish corpus were very similar between the Swedish and Brazilian listeners, despite some small differences. This means that the listeners’ mother language, the culture, and the emotional experiences in both countries did not signifi cantly infl uence the perception by means of emotional dimensions of the emotions expressed by Swedish speakers.
4. General discussion
473
of the vocal expression of emotions universal or dependent upon the culture and the prosodic organization of the speaker’s language? II. In addition to activation, valence, and dominance, can other emotional dimensions be reliably inferred from speech?
The main fi nding of the present study is that the perceptual judgements of the Brazilian and Swedish listeners were virtually the same in both conditions (when judging utterances in Brazilian Portuguese and in Swedish). This was evidenced by the PCA, which revealed for both cultures a similar pattern in the distribution of the emotional labels and dimensions according to their loadings for the two principal components. This result indicates that the listeners from both cultures had a similar perception of the emotions across the utterances. The only observed differences were in the agreement between the judges and in the correlation of some of the acoustic parameters with the PCA factors. The acoustic parameters which explained the listeners’ judgements were in general the same for both cultures (which is noteworthy, given that the Brazilian Portuguese and the Swedish have a different prosodic organization and thus some parameters such as f0 are used differently by these languages in the linguistic domain). In spite of this fact, some parameters presented a better correlation with one culture (e.g. f0 interquantile semi-amplitude
for the factor NEUTRALITY of the Swedish listeners in experiment I or f0 median for the PC1 of the Brazilian judges in experiment II and intensity skewness in experiment I). When the Swedish subjects evaluated stimuli in Brazilian Portuguese, the agreement between them was similar to the agreement between the Brazilian subjects for the same stimuli. However, the Brazilian listeners presented a slightly worse agreement than the Swedish listeners when evaluating speech samples in Swedish.
474
& Han 2012; Paulmann & Uskul 2014). Differences may arise from the fact that listeners with different mother languages have learned to interpret the variations on the acoustic parameters differently due to the role these parameters play in the prosody of their mother language and also because of possible culture-specifi c expressions or display rules (Ekman & Friesen 1969; Scherer 1985). Future studies have to investigate other cultures and languages which differ from each other with regard to the prosodic structure in order to advance our understanding of this problem.
For experiment I, the PCA showed that the listeners of both nationalities evaluated the emotions described by the eight adjectives jointly by means of two major dimensions: HAPPINESS and NEUTRALITY. The fi rst one, HAPPINESS, is a combination of two emotional groups: one with the emotions of positive valence (joy, contentment, and enthusiasm) and the other with the negative emotions (moved, sadness, anguish, and distress). These groups reveal that the listeners judged the adjectives within each group in the same way, despite the possible semantic differences between them. This suggests that the PCA technique can help to avoid the problem of labelling the emotions with discrete labels, which arises for example because of the semantic differences between languages (Goddard 2002).
475
judges’ responses in both experiments) that is accounted for by the acoustic parameters was higher for the emotional dimensions. This indicates that dimensions can be more directly interpreted as the result of the physiological changes of the speaker and also more directly related to the acoustic parameters of speech, as previously suggested by some authors (Scherer 1986; Pereira 2000; Schröder et al. 2001;
Barbosa 2009). It is for future research to investigate whether other emotional dimensions can also be reliably inferred from speech and their usefulness for describing and distinguishing emotions.
The limitation of the present study is that only speech samples from female speakers were used. This casts doubt on whether the fi ndings reported here can be generalised to male speakers. However, there are no studies, to our knowledge, which have presented evidence suggesting that female speakers’ vocal expressions of emotions are perceived or expressed differently from male speakers’. In a review of 75 studies which presented recognition rates for males and females at decoding nonverbal cues of emotion conveyed through the face, body, or voice tone, Hall (1978) found an advantage of the female judges and that the magnitude of this effect did not vary signifi cantly with the sex or the age of the person of the stimulus. In a study using event-related potentials (ERPs) to determine the time-course of neural responses to emotional speech, Paulmann et al. (2008) found that emotional vocal
expressions of anger, fear, disgust, and sadness can be distinguished from neutral vocalizations within 200 ms after the beginning of the sentence regardless of the sex or the age of the speaker. Therefore, it is unlikely that our fi ndings would be different if utterances from male speakers had also been used. Nonetheless, future research should use utterances from speakers of both sexes to reveal any possible effect of this variable on the perception of vocal expressions of emotions.
476
group and language (Elfenbein & Ambady 2002; Paulmann & Uskul 2014). Furthermore, the method used in this work (which combines automatic extraction of acoustic parameters from the speech signal, PCA, and multiple linear regression analysis) has application in speech technology and artifi cial intelligence, as it can be used in the development of softwares which automatically recognise the speaker’s emotional state from the voice (which have been applied to monitoring the affective state of customers during call centre conversations), human-machine interaction systems, and in the development of more sophisticated text-to-speech converters.
Recebido em setembro de 2015 Aprovado em janeiro de 2016 E-mails: [email protected] [email protected] [email protected]
References
ABELIN, Åsa & Jens ALLWOOD. 2000. Cross Linguistic Interpretation of Emotional Prosody. Proc. ISCA Tutorial and Research Workshop
(ITRW) on Speech and Emotion. Newcastle. p. 110-113.
ALM, Cecilia Ovesdotter & Richard SPROAT. 2005. Perceptions of emotions in expressive storytelling. Proc. of Interspeech 2005. Lisbon: Portugal.
p. 533-536.
AMIR, Noam; Hansjörg MIXDORFF; Ofer AMIR; Daniel ROCHMAN; Gary M. DIAMOND; Hartmut R. PFITZINGER; Tami LEVI-ISSERLISH & Shira ABRAMSON. 2010. Unresolved anger: Prosodic analysis and classifi cation of speech from a therapeutic setting. Proc. of Speech
Prosody 2010. Chicago, USA.
AUDIBERT, Nicolas; Véronique AUBERGÉ & Albert RILLIARD. 2008. How we are not equally competent for discriminating acted from spontaneous expressive speech. Proc. of Speech Prosody 2008. Campinas, Brazil.
p. 693-696.
BARBOSA, Plinio A. 2009. Detecting changes in speech expressiveness in participants of a radio program. Proc. of Interspeech 2009 - Speech
and Intelligence. Brighton, UK. p. 2155-2158.
477
VIIth GSCP International Conference. Speech and Corpora. Vol. 33.
Florence: Firenze University Press. p. 33-42.
BOERSMA, Paul & David WEENINK. 2011. Praat: doing phonetics by computer
(Version 5.2.25) [Computer program]. Online: HYPERLINK “http:// www.praat.org” http://www.praat.org . Retrieved in 2011.
BURKHARDT, Franz; Nicolas AUDIBERT; Lori MALATESTA; Oytun TÜRK; Levent ARSLAN & Véronique AUBERGÉ. 2006. Emotional prosody-does culture make a difference? Proc. of the 3rd international conference
on speech prosody. Dresden, Germany.
CORNELIUS, Randolph R. 2000. Theoretical approaches to emotion. Proc. ISCA Tutorial and Research Workshop (ITRW) on Speech and
Emotion. Newcastle, Northern Ireland. p. 3-10.
DARWIN, Charles. 1872/2009. A expressão das emoções no homem e nos
animais [The Expression of the Emotions in Man and Animals]. São
Paulo: Companhia das Letras.
DEVILLERS, L.; R. COWIE; J.-C. MARTIN; E. DOUGLAS-COWIE; S. ABRILIAN & M. MCRORIE. 2006. Real life emotions in French and English TV video clips: An integrated annotation protocol combining continuous and discrete approaches. Proc. of the Fifth International Conference on
Language Resources and Evaluation. Genoa, Italy. p. 1105-1110.
DOUGLAS-COWIE, E.; L. DEVILLERS; J.C. MARTIN; R. COWIE; S. SAVVIDOU; S. ABRILIAN & C. COX. 2005. Multimodal databases of everyday emotion: facing up to complexity. Proc. of Interspeech 2005. Lisbon,
Portugal. p. 813-816.
EKMAN, Paul. 1992. An argument for basic emotions. Cogn. Emot.6:
169-200.
______. 1999. Facial expressions. In: Tim DALGLEISH & Michael J. POWER (eds.). The Handbook of Cognition and Emotion. Sussex, UK: John
Wiley & Sons. p. 301-320.
EKMAN, Paul & Wallace V. FRIESEN. 1969. The repertoire of nonverbal behavior: categories, origins, usage and coding. Semiotica1: 49-98.
EKMAN, Paul; E. Richard SORENSON & Wallace V. FRIESEN. 1969. Pan-Cultural Elements in Facial Displays of Emotion. Science 164:
86-88.
ELFENBEIN, Hillary Anger & Nalini AMBADY. 2002. On the universality and cultural specifi city of emotion recognition: a meta-analysis. Psychol.
Bull.128: 203-235.
ELLSWORTH, Phoebe C. & Klaus R. SCHERER. 2003. Appraisal processes in emotion. In: Richard J. DAVIDSON; Klaus R. SCHERER & Hill GOLDSMITH (eds.). Handbook of affective sciences. New York: Oxford University
478
FLEISS, Joseph L. 1971. Measuring nominal scale agreement among many raters. Psychol. Bull.76: 378-382.
FRICK, Robert W. 1985. Communicating Emotion: The Role of Prosodic Features. Psychol. Bull.97: 412-429.
FRIJDA, Nico H. & Batja MESQUITA. 1994. The social roles and functions of emotions. In: Shinobu KITAYAMA & Hazel R. MARKUS (eds.).
Emotion and Culture: Empirical studies of mutual infl uence. New
York: American Psychological Association. p. 51-87.
FRIJDA, Nico H.; Suprapti MARKAM; Kaori SATO & Reinout WIERS. 1995. Emotions and emotion words. In: James A. RUSSELL, José-Miguel FERNANDEZ-DOLS; Anthony S. MANSTEAD & Jane C. WELLENKAMP (eds.). Everyday Conceptions of Emotion: An Introduction to the
Psychology, Anthropology and Linguistics of Emotion. Dordrecht:
Kluwer Academic/Plenum Publishers. p. 121-143.
GODDARD, Cliff. 2002. Explicating emotions across languages and cultures: A semantic approach. In: Susan R. FUSSELL (ed.). The verbal
communication of emotions: Interdisciplinary perspectives. Mahwah:
Lawrence Erlbaum Associates. p. 19-53.
HALL, Judith A. 1978. Gender effects in decoding nonverbal cues. Psychol.
Bull.85: 845-857.
HIRSCHBERG, Julia; Jackson LISCOMBE & Jennifer VENDITTI. 2003. Experiments in emotional speech. Proc. ISCA & IEEE Workshop on
Spontaneous Speech Processing and Recognition. Tokyo, Japan. p.
1-7.
IZARD, Carroll E. 1977. Human emotions. New York: Plenum Press.
JOHNSTONE, Tom & Klaus R. SCHERER. 2000. Vocal communication of emotion. In: Michael LEWIS & Jeannette M. HAVILAND-JONES (eds.).
Handbook of emotions, 2nd ed. New York: The Guilford Press. p.
220-235.
KEHREIN, Roland. 2002. The prosody of authentic emotions. Proc. of Speech
Prosody 2002. Aix-em-Provence, France. p. 423-426.
LAUKKA, Petri & Hillary Anger ELFENBEIN. 2012. Emotion appraisal dimensions can be inferred from vocal expressions. Soc. Psychol.
Personal. Sci.3: 529-536.
LAUKKANEN, Anne-Maria; Erkki VILKMAN; Paavo ALKU & Hanna OKSANEN. 1997. On the perception of emotions in speech: the role of voice quality. Logoped. Phoniatr. Vocol.22: 157-168.
LAVER, John & Peter TRUDGILL. 1979. Phonetic and linguistic markers in speech. In: Klaus R. SCHERER & Howard GILES. Eds. Social markers
479
LIEBERMAN, Philip. 1961. Perturbations in vocal pitch. J. Acoust. Soc. Am.
33: 597-603.
LUGGER, Marko & Bin YANG. 2007. An incremental analysis of different feature groups in speaker independent emotion recognition. Proc.
XVIth ICPhS. Saarbrücken, Germany. p. 2149-2152.
MENEZES, Caroline; Donna ERICKSON & Jonghye HAN. 2012. Cross-linguistic cross-modality perception of English sad and happy speech. Proc. of the 6th International Conference on Speech Prosody.
Shanghai, China. p. 649-652.
OSGOOD, Charles E. 1952. The nature and measurement of meaning.
Psychol. Bull.49: 197-237.
PAULMANN, Silke; Patricia SCHMIDT; Marc PELL & Sonja A. KOTZ. 2008. Rapid processing of emotional and voice information as evidenced by ERPs. Proc. of the Conference on Speech Prosody 2008. Campinas,
Brazil. p. 205-209.
PAULMANN, Silke & Ayse K. USKUL. 2014. Cross-cultural emotional prosody recognition: Evidence from Chinese and British listeners.
Cogn. Emot.28: 230-244.
PEREIRA, Cécile. 2000. Dimensions of emotional meaning in speech.
Proc. ISCA Tutorial and Research Workshop (ITRW) on Speech and
Emotion. Newcastle, Northern Ireland. p. 25-28.
PITTAM, Jeffery & Klaus R. SCHERER. 1993. Vocal expression and communication of emotion. In: Michael LEWIS & Jeannette M. HAVILAND-JONES (eds.). Handbook of emotions, 1st ed. New York:
Guilford Press. p. 185-198.
R DEVELOPMENT CORE TEAM. 2010. R: A language and environment for
statistical computing. (Available at: HYPERLINK
“http://www.R-project.org” http://www.R-project.org ). R Foundation for Statistical Computing, Vienna, Austria.
RUSSELL, James A. 1980. A circumplex model of affect. J. Pers. Soc.
Psychol.39: 1161-1178.
SCHERER, Klaus R. 1981. Speech and emotional states. In: John K. DARBY (ed.). Speech evaluation in psychiatry. New York: Grune & Stratton.
p. 189-220.
______. 1985. Vocal affect signaling: a comparative approach. Adv. Study
Behav.15: 189-244.
______. 1986. Vocal Affect Expression: A Review and a Model for Future Research. Psychol. Bull.99: 143-165.
______. 1998. Analyzing emotion blends. Proc. of the Xth Conference of
the International Society for Research on Emotions. p. 142-148.
480
Introduction to Social Psychology: A European perspective, 3rd ed.
Oxford: Blackwell. p. 151-191.
______. 2003. Vocal communication of emotion: A review of research paradigms. Speech Commun. 40: 227-256.
SCHERER, Klaus R.; Rainer BANSE & Harald G. WALLBOTT. 2001. Emotion inferences from vocal expression correlate across languages and cultures. J. Cross Cult. Psychol. 32: 76-92.
SCHIMMACK, Ulrich. 2001. Pleasure, displeasure, and mixed feelings: Are semantic opposites mutually exclusive? Cogn. Emot. 15: 81-97.
SCHLOSBERG, Harold. 1941. A scale for the judgement of facial expressions.
J. Exp. Psychol.29: 497-510.
______. 1954. Three dimensions of emotion. Psychol. Rev. 61: 81-88.
SCHRÖDER, Marc; Roddy COWIE; Ellen DOUGLAS-COWIE; Machiel WESTERDIJK & Stan GIELEN. 2001. Acoustic correlates of emotion dimensions in view of speech synthesis. Proc. of Eurospeech 2001.
Aalborg, Denmark. p. 87-90.
TOMKINS, Silvan S. 1984. Affect theory. In: Klaus R. SCHERER & Paul EKMAN (eds.). Approaches to emotion. Hillsdale: Erlbaum. p. 163-195.
TRAUNMÜLLER, Hartmut & Anders ERIKSSON. 2000. Acoustic effects of variation in vocal effort by men, women, and children. J. Acoust.
Soc. Am.107: 3438-3451.
VAN KLEEF, Gerben A. 2009. How emotions regulate social life: the emotions as social information (EASI) model. Curr. Dir. Psychol. Sci.18: 184-188.
WILTING, Janneke; Emiel KRAHMER & Marc SWERTS. 2006. Real vs. acted emotional speech. Proc. of the 9th International Conference on
Spoken Language Processing - Interspeech 2006. Pittsburgh, USA.
p. 805-808.
WUNDT, Wilhelm Max. 1874. Grundzüge der physiologischen Psychologie.