Resumo
Esse trabalho tem como objetivo o uso da termodinâmica computacional no estudo de dessulfuração de ferro-gusa com misturas de CaO-Fluorita e CaO-Sodalita. As experiências foram realizadas com a adição de diferentes misturas a partir desses sistemas em ferro-gusa a uma temperatura de 1,400°C. Os resultados do teste foram analisados e comparados com os obtidos pelo programa de termodinâmica computacional THERMOCALC. Através deste software, foi calculado o teor de equilíbrio de enxofre do metal, as fases sólidas presentes e a quantidade de líquido em cada uma das misturas dessulfurantes utilizadas no processo na temperatura de 1,400ºC. A termodinâmica computacional provou ser uma ferramenta eicaz para estimar a capacidade de dessulfuração das misturas.
Palavras-chave: Pré-tratamento de ferro-gusa, dessulfuração e termodinâmica computacional.
Abstract
This work aims at the use of computational thermodynamics in the study of desulfurization of pig iron through CaO-Fluorspar and CaO-Sodalite mixtures. Experiments were performed with the addition of different mixtures from these systems in molten pig iron at a temperature of 1,400°C. The test results were analyzed and compared with those obtained by the computational thermodynamics software program THERMOCALC. Through this software, were calculated the equilibrium sulfur content in the metal, solid phases, and the amount of liquid in each desulfurizing mixture used in the process at a temperature of 1,400oC. The
computational thermodynamics proved to be an effective tool in predicting the desulfurization capacity of the mixtures.
Keywords:Pretreatment of pig iron, desulfurization, computational thermodynamics.
Metalurgia e materiais
Metallurgy and materials
Analysis of pig iron
desulfurization with mixtures
from the CaO-Fluorspar and
CaO-Sodalite system with
the use of computational
thermodynamics
Análise de dessulfuração de ferro-gusa com
misturas do CaO-Fluorita e CaO-Sodalita
com o uso de termodinâmica computacional
Felipe Fardin Grillo
Department of Metallurgical and Materials Engineering. University of São Paulo, SP, Brazil. [email protected]
Raphael de Alcantara Sampaio
Department of Metallurgical and Materials Engineering.
Federal Institute of Espírito Santo, ES, Brazil. [email protected]
José Flávio Viana
MsC. Metallurgical Engineer.
Process Manager Company Tecnosulfur S/A. [email protected]
Denise Crocce Romano Espinosa
Department of Metallurgical and Materials Engineering, University of São Paulo, SP, Brazil. [email protected];
José Roberto de Oliveira
Department of Metallurgical and Materials Engineering.
1. Introduction
Normally the desulphurization of pig iron is made using mixtures containing CaO and luospar. However, the luospar can cause contamination of the water used
for Fluoride. Therefore this work uses mixtures with CaO and sodalite, with the aim to verify its eficiency for a possible substitution of luorspar.
The desulfurization reaction of pig iron can occur according to the reaction (1) (Anderson et al., 2000).
[S] + CaO
(S)= CaS
(S)+ [O] D
Gº = 27570 – 9.24T (kcal/mol) (1)Depending on the carbon and silicon content in the pig iron and SiO2 and Al2O3 in the slag, there may be also formation
of carbon monoxide (CO) and tricalcium silicate (3CaO.SiO2), respectively accord-ing to the followaccord-ing reactions (2) and (5)
respectively (Niedringhaus & Fruehan, 1988).
[S] + [C] + CaO
(S)= CaS
(S)+ CO
(g) (2)5CaO
(S)+ 2[S] + [Si] = 2CaS
(S)+ 3CaO.SiO
2(S) (3)5CaO
(S)+ 2[S] + SiO
2(S)= 2CaS
(S)+ 3CaO.SiO
2(S) (4)4CaO
(S)+ [S] + Al
2O
3(S)= CaS
(S)+ 3CaO.Al
2O
3(S) (5)To evaluate the eficiency of sulfur removal from the metal by a given desul-furizing mixture, normally are used the parameters: optical basicity (∧), sulide capacity (Cs), sulfur partition coeficient (Ls) and equilibrium sulfur content.
Sosinsky and Sommerville (1986) determined optical basicity values for a few elements that are typically used in desulfurizing mixtures agents, namely: CaO = 1; MgO = 0.78; CaF2= 0.37; SiO2 = 0.48; Al2O3 = 0.61; P2O5 = 0.40; Na2O = 1.15. Young (1991) deined sulide capacity as the slag’s capacity to absorb sulfur, establishing relationships between Cs and optical basicity.
The sulfur partition coeficient (Ls) is a parameter that expresses the relation-ship between sulfur concentration in slag (%Seq.) and the metal bath [%Seq.] through
the thermodynamic equilibrium (Turkdo-gan, 1996).
The equilibrium sulfur concentra-tion [%Seq.] in pig iron can be obtained from a mass balance in the system.
However, besides the models men-tioned, there are others in literature (Yoshinori et al., 2009). Allthese models sometimes show different results, which are not always consistent with those found in practice. In addition, these models do not provide information on viscosity, amount of liquids and solids, and phases present in the mixtures.
The computational thermodynamics presents itself as a tool which determines the desulfurizing mixtures that show bet-ter thermodynamic conditions and allows for the calculation of viscosity, melting temperature, amount of liquid and solid
phases, and phases present in the mixtures at a given temperature. Through these parameters, as well as thermodynamic knowledge, we may have data that give us a position to conclude which mixture has better kinetics, allowing for a more complete analysis than that performed by the classical thermodynamic parameters.
Therefore, this work aimed at studying pig iron desulfurization by using desulfurizing mixtures of CaO-Fluorspar (CF) and CaO-Sodalite (CS) systems and by using computational thermodynamics software with the aim of determining the equilibrium sulfur concentration, melting point, and phases present in the mixture.
The thermodynamic data obtained
from the software THERMOCALC
TCW v.5, whose database used it was Slag3.
2. Materials and methods
Experimental procedure
First, were carriedout pig iron de-sulfurization experiments using desulfur-izing mixtures of CaO-Fluorspar (CF) and CaO-Sodalite (CS) systems.
Table 1 shows the initial chemical
composition and the mass of the mixtures used.
Table 2, in turn, shows the initial chemical composition and mass of the pig iron used in each experiment.
The chemical composition in both cases was determined by X-ray luores-cence, using a device PHILIPS, model Axios Advanced panalytical.
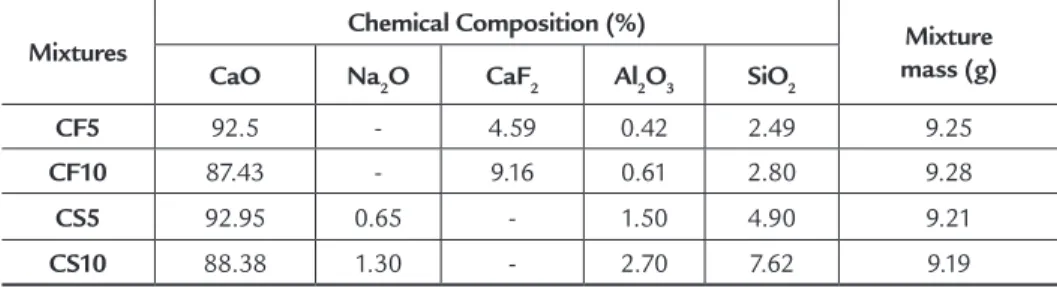
Table 1
Initial chemical composition and mass of the mixtures used in the experiments.
Mixtures
Chemical Composition (%) Mixture
mass (g)
CaO Na2O CaF2 Al2O3 SiO2
CF5 92.5 - 4.59 0.42 2.49 9.25
CF10 87.43 - 9.16 0.61 2.80 9.28
CS5 92.95 0.65 - 1.50 4.90 9.21
The mass of the mixture used was determined based on industrial data.
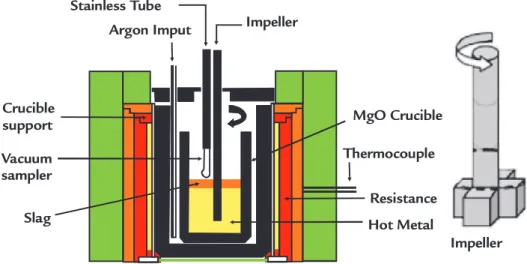
Initially, the solid pig iron was charged in MgO-C crucibles and in the electrical resistance oven MAITEC, model 1700-FEE/ at 1400°C. Further, argon gas was injected onto the pig iron with a low rate of 10Nl/min to inert the environment and prevent oxidation of the metal.
After melting the pig iron, a sample
of the metal was removed and, then, the desulfurizing mixture went to the metal bath through a stainless steel tube. After adding the mixture, samples were taken at 10, 15, 20 and 30 minutes. The samples were taken using glass vacuum samplers. Figure 1 shows a schematic drawing of the experimental setup used. It was made only one test for each mixture.
The mechanical stirrer used is
equipped with a 4-vane impeller to simu-late desulfurization in a KR reactor. The mechanical rotation was 400 rpm,because in this rotation the vortex formed in the bath presented similar format compared to the vortex formed in industrial processes.
Finally, inal sulfur concentration was determined through the samples taken by chemical analysis by direct in-frared combustion in a LECO.
Table 2 Initial chemical composition and mass of the pig iron used.
Mixture %Si %Mn %P %S %C Pig iron Mass (g)
CF5 0.5 0.2 0.12 0.028 4.5 1000
CF10 0.5 0.2 0.12 0.031 4.5 1000
CS5 0.5 0.2 0.12 0.036 4.5 1000
CS10 0.5 0.2 0.12 0.028 4.5 1000
Figure 1 Schematic diagram of the experiments.
Computational thermodynamics simulations
Through the chemical compositions of the desulfurizing mixtures and pig iron present in Tables 1 and 2, thermodynamic
simulations were performed using the
software THERMOCALC V.5 to
iden-tify the equilibrium sulfur concentration
in the metal, phases present, and amount of liquid present in the mixture a 1400ºC.
3. Results and discussion
Figure 2 shows the efficiency of desulfurization obtained by conducting
experimental tests at the Pyrometallurgy Laboratory. Desulfurization yield (h) was
calculated from Equation 6.
h
=
[%S
i] - [%S
f] x 100
[%S
i]
(6)
where:
[%Si]= initial sulfur concentration. [%Sf] = inal sulfur concentration.
It is observed that desulfurizing mixtures of the CaO-Fluorspar (CF5 and CF10) system had higher desulfuriza-tion yields, with 96.43% and 97.08%, respectively. However, the addition of twice the amount of luorspar in the CF10 mixture did not show much inluence on the yield, with an increase of only 0.65%. Mixtures of the CaO-Sodalite (CS5 and CS10) system show a lower yield than
that obtained by CF5 and CF10 mixtures, with 94.22% and 74.58% yield, respec-tively. This might have occurred due to the amount of liquid phase present in the mixtures and the formation of solid com-pounds such as tricalcium silicate (3CaO. SiO2) and/or tricalcium aluminate (3CaO. Al2O3) (Niedringhaus & Fruehan, 1988), which are not taken into account by the thermodynamic parameters.
Therefore, the use of thermodynam-ic software can enable better desulfurizing capacity analysis of the mixtures, allowing
for more accurate evaluation of what is the best desulfurizing mixture to be used in an industrial process. Through computation-al thermodynamics, we can determine the equilibrium sulfur concentration and the percentage of liquid phase and solid phases formed in the mixture. This information allows for a more accurate analysis of the desulfurizing capacity of these mixtures.
Table 3 shows the equilibrium sulfur concentration values in metal and sulfur partition coeficient calculated using the software THERMOCALC.
Thermocouple
Hot Metal Resistance MgO Crucible Impeller
Impeller Stainless Tube
Argon Imput
Figure 2
Desulfurization yield obtained in the experimental Mixtures
(%Sf:CF5 = 0.00099; CF10 =0.00093; CS5 = 0.00278; CS10 = 0.00718).
Table 3
Equilibrium inal sulfur concentration and sulfur partition coeficient obtained through the software THERMOCAL.
Mixture %Seq. Ls
CF5 1.54.10-5 2.76.105
CF10 1.50.10-5 2.97.105
CS5 1.57.10-5 2.15.105
CS10 1.62.10-5 1.74.105
Using data obtained from compu-tational thermodynamics, it is possible to notice that the mixtures with higher desulfurizing eficiency are CF10, CF5, CS5, and CS10, respectively, as shown in Figure 2.
In addition to the thermodynamic parameters, there is other data on a de-sulfurizing mixture that can help in the analysis of its eficiency. This data is mainly the percentage of the liquid and solid phases in the slag, formation of the compounds tri-calcium silicate (3CaO.SiO2) and tricalcium aluminate (3CaO.Al2O3) and the concentra-tion of free CaO in the slag.
It can be argued that the best desul-furizing mixture is one that is presented when added to the bath:
1. Higher percentage of liquid phase and, consequently, a lower percentage of the solid phase.
2. Less formation of compound trical-cium silicate (3CaO.SiO2).
3. Less formation of compound trical-cium aluminate (3CaO.Al2O3).
4. Higher concentration of CaO in the slag. This is because a larger percentage of the liquid phase helps dissolve the formed CaS, preventing the formation of a solid layer around the CaO particle, impeding the transfer of the S mass in the metal until the CaO particle. The solid compounds 3CaO.SiO2 and 3CaO.Al2O3 also form around the CaO particle and in the same way the CaS impedes the transfer of the S mass to the CaO particle.
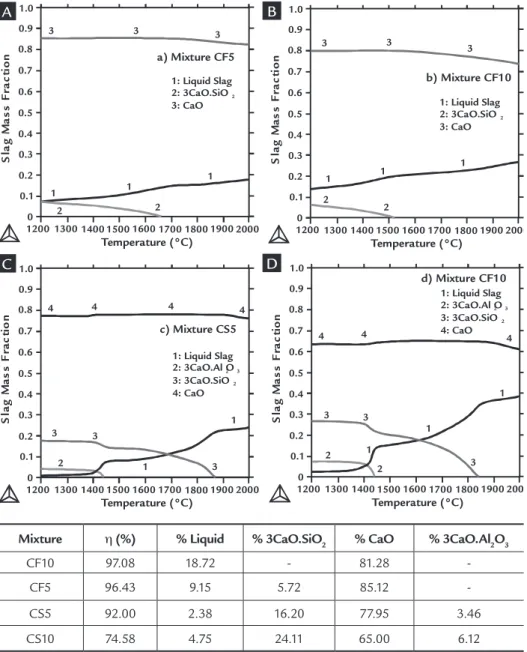
The graphs (generated by software THERMOCALC) presented in Figure 3 show the percentages of the stages men-tioned in the different experiments with temperature, and Table 4 shows the per-centage of these phases at a temperature of 1,400°C.
Based on the analysis of Table 4 and Figure 3, it can be observed that the mixtures that met parameters 1 to 4 are those that showed greater desulfurization capacity.
By comparing with the CF5 mixture with CF10, it is observed that the latter
had a better performance as it showed a greater percentage of the liquid phase and there was no formation of 3CaO.SiO2. The comparison between the CS5 and CS10 mixtures shows that the former had a better desulfurization yield, even with a lower liq-uid phase percentage, since it showed lower formation 3CaO.SiO2 and 3CaO.Al2O3 and higher concentration of CaO in the slag.
By comparing the mixtures of the Fluorspar system with the CaO-Sodalite system, it is noted that those with a higher liquid phase amount and lower solid phase amount (3CaO.SiO2 and 3CaO.Al2O3) had higher desulfur-ization eficiency. As said previously, the
solid compounds 3CaO.SiO2 and 3CaO.
Al2O3 form around the CaO particle and impedes the transfer of the S mass to the CaO particle. Finally, by comparing all mixtures, the most eficient was the CF10 mixture, which had a higher liquid phase percentage, with lower formation of 3CaO.SiO2 and none of 3CaO.Al2O3 and 81.28%.free CaO.
4. Conclusions
Based on the data obtained in this study, it can be concluded that:
• Desulfurizing mixtures of the CaO-CaF2 system, CF5 and CF10, showed higher desulfurizing yield, with 96.43% and 97.08% yields, respectively. • The addition of twice the amount
of fluorspar in the CF10 mixture did not show much inluence on the desulfurization efficiency, with an increase of only 0.65% in the yield. • Mixtures of the CaO-Sodalite system,
CS5 and CS10, have lower yield than that obtained by the CF5 and CF10 mixtures, with 94.22% and 74.58% yield, respectively.
• The mixtures that had better eficiency were those that showed the highest liquid phase percentage, lower solid percentage, lower formation of compound tricalcium silicate (3CaO. SiO2) and tricalcium aluminate (3CaO. Al2O3), and a higher percentage of CaO.
• T h e c l a s s i c t h e r m o d y n a m i c parameters can sometimes lead to er roneou s conclu sion s on the desulfurization efficiency of different mixtures. Due to their capacity to perform calculations and determine percentages of the different phases formed, computational thermodynamics allows for a better evaluation of desulfurization efficiency of these mixtures in industrial processes.
0
96,4 97,1
85,9
74,6
10 20 30 40 50 60 70 80 90 100
CF5
Mixtures
D
e
s
u
lf
u
ri
z
a
ti
o
n
y
ie
ld
(
%
)
Figure 3 Heating graphs of the desulfurizing mixture obtained from THERMOCALC: A) CF5. B) CF10. C) CS5). D) CS10. Table 4 Percentage of phases formed in different
experiments at the temperature of 1,400°C, calculated based on Figure 3.
Mixture h (%) % Liquid % 3CaO.SiO2 % CaO % 3CaO.Al2O3
CF10 97.08 18.72 - 81.28 -CF5 96.43 9.15 5.72 85.12 -CS5 92.00 2.38 16.20 77.95 3.46 CS10 74.58 4.75 24.11 65.00 6.12
5. Acknowledgements
We would like to thank FAPESP and CAPES for the scholarship and
Tecnosul-fur for the assistance in carrying out the experiments and concession of materials
to be used in tests.
6. References
ANDERSON, M., JÖNSSON, P., HALLBERG, M. Optimisation of ladle slag composition by application of sulphide capacity model. Ironmaking and Steelmaking, v. 27, n. 4, p. 286-293, 2000.
NIEDRINGHAUS, J. C., FRUEHAN, R. J. Reaction mechanism for the CaO-Al and CaO-CaF2
desulfurization of carbon-saturated iron. Metallurgical Transactions B, v.19B, p. 261-268, 1988.
SOSINSKY D.J., SOMMERVILLE I.D. The composition and temperature dependence of the sulide capacity of metallurgical slags. Metallurgical Transactions B, v. 17B, p. 331-337, 1986.
TURKDOGAN, E.T. Fundamentals of steelmaking. London: The Institute of Materials, 1996.
331p.
YOSHINORI, T., NOBUO, S., SESHADRI, S. Sulphide capacities of CaO-Al2O3-SiO2
-MgO-MnO Slags in the temperature range 1673-1773 K. ISIJ International, v. 49, n. 2, p. 156-163, 2009.
YOUNG, R.W. Use of the optical basicity concept for determining phosphorus and sulphur slag/ metal partitions. London: British Steel, 1991. cap. 4, p. 7. 115p.
Artigo recebido em 08 de fevereiro de 2013. Aprovado em 07 de maio de 2013.
1200 1200 1200 1200 0 0 0 0 0.1 0.1 0.1 0.1 S la g M a s s F ra c ti o n S la g M a s s F ra c ti o n S la g M a s s F ra c ti o n S la g M a s s F ra c ti o n Temperature (°C)
Temperature (°C) Temperature (°C) Temperature (°C) 0.2 0.2 0.2 0.2 0.3 0.3 0.3 0.3 0.4 0.4 0.4 0.4 0.5 0.5 0.5 0.5 0.6 0.6 0.6 0.6 0.7 0.7 0.7 0.7 0.8 0.8 0.8 0.8 0.9 0.9 0.9 0.9 1.0 1.0 1.0 1.0 1300 1300 1300 1300 1400 1400 1400 1400 1: Liquid Slag
2: 3CaO.SiO 3: CaO
2
1: Liquid Slag 2: 3CaO.Al O 3: 3CaO.SiO 4: CaO
2 3 2
1: Liquid Slag 2: 3CaO.Al O 3: 3CaO.SiO 4: CaO
2 3 2
1: Liquid Slag 2: 3CaO.SiO 3: CaO 2 1 1 1 1 1 1 1 1 1 1 1 2 2 2 2 2 2 2
3 3 3
3
4 4 4
4 4 4
4 3 3 3 3 3 3 3 3
a) Mixture CF5
c) Mixture CS5
d) Mixture CF10 b) Mixture CF10