Factors associated with the quality of
the diet of residents of a rural area in
Southern Brazil
Mayra Pacheco FernandesI, Renata Moraes BielemannI, Anaclaudia Gastal FassaII
I Universidade Federal de Pelotas. Faculdade de Medicina. Departamento de Medicina Social. Programa de Pós-Graduação em Epidemiologia. Pelotas, RS, Brasil
II Universidade Federal de Pelotas. Faculdade de Medicina. Departamento de Medicina Social. Pelotas, RS, Brasil
ABSTRACT
OBJECTIVE: To identify factors associated with a better quality of the diet of residents of a rural area in Southern Brazil.
METHODS: This is a population-based, cross-sectional study with individuals aged 18 years or over living in the rural area of Pelotas, State of Rio Grande do Sul, Brazil. Food consumption was evaluated by a food frequency questionnaire of thirteen items, related to the consumption in the last week. We evaluated quality of the diet using the Adult Diet Quality Index (IQD-A). Healthy food received increasing scores while unhealthy food received decreasing scores, according to consumption frequency, amounting to scores from zero to 30. The total score was divided into tertiles. Individuals of the third tertile were classified with better quality of the diet. We investigated the association between quality of the diet and independent variables using multinomial logistic regression.
RESULTS: We interviewed 1,519 individuals with mean IQD-A of 17.1 points (SD = 3.3) and a median of 17.0 (range of 10 to 25 points). Although the population studied kept the consumption of staple foods, the intake of industrialized food such as soft drinks, artificial juices, and unhealthy foods such as sweets was high. Older individuals presented seven times (95%CI 4.20–12.48) more chance of having a better quality of the diet. Women, individuals with higher economic status, those who worked in the sale of animals, or those who had diabetes were approximately twice as likely to be in the group with the best quality of the diet. Individuals whose families worked with fishing presented a 70% lower chance of being in the group of better quality of the diet. CONCLUSIONS: We identified that men, younger adults, individuals of lower socioeconomic level, and fishing families were in the group of higher vulnerability for the consumption of a diet with worse quality. Thus, public policies, especially educational policies, are needed to promote healthy eating in this group.
DESCRIPTORS: Adult. Aged. Food Consumption. Feeding Behavior. Socioeconomic Factors. Rural Population.
Correspondence:
Mayra Pacheco Fernandes Rua Marechal Deodoro, 1160 3º piso Centro
Caixa Postal 464
96020-220 Pelotas, RS, Brasil E-mail: pfmayra@hotmail.com
Received: May 31, 2017
Approved: Nov 2, 2017
How to cite: Fernandes MP, Bielemann RM, Fassa AG. Factors associated with the quality of the diet of residents of a rural area in Southern Brazil. Rev Saude Publica. 2018;52 Suppl 1:6s.
Copyright: This is an open-access article distributed under the terms of the Creative Commons Attribution License, which permits unrestricted use, distribution, and reproduction in any medium, provided that the original author and source are credited.
INTRODUCTION
Rural areas in Brazil are undergoing a process of population aging1, as well as an increase in the prevalence of overweight2 and chronic non-communicable diseases (NCD)3. Inadequate diet is an important risk factor for NCD, and it is also associated with disability and premature
death4. A systematic review has shown that the Brazilian population needs to improve the quality of the diet, given the low consumption of fruits, vegetables, milk, and dairy products and the high consumption of fat5.
The evaluation of the quality of the diet in epidemiological studies is a challenge. Among the most accurate dietary methods to evaluate dietary consumption or eating habits, we have the 24-hour recall or food record; however, it is complex to be used in population studies. In this sense, some studies have used the Diet Quality Index (IQD). The IQD is constructed from food intake information from the application of a food frequency questionnaire (FFQ), which, in turn, can consist of a list of food6 or food consumption markers7.
The rural area, especially in areas focused on family agriculture, used to be characterized by the production of food for subsistence8. However, this scenario has been changing with the expansion of monoculture9. This aspect, in addition to the barriers to the access to consumer goods (such as low income and low education level), the great distances and difficulty of access to public transportation, stores, and health services10 may be modifying the quality of the diet of this population.
There are few studies on the quality of the diet in rural areas. According to the Brazilian Household Budget Survey (POF), rural areas presented higher consumption of traditional food, while urban areas presented higher consumption of ready-to-eat or processed food11. In the National Health Survey (PNS)3, rural areas had higher consumption of beans and fat, as well as lower consumption of fruits, vegetables, sweets, and soft drinks compared to urban areas. Studies on the quality of the diet in the urban area show that women and older persons6,12 with higher education level6,12 and higher socioeconomic level12 present a better quality of diet. However, there are no studies on factors associated with the quality of diet in rural areas in Brazil. Considering the importance of an adequate diet in health promotion, as well as the lack of information on the factors associated with the quality of diet in rural areas, this study aimed to identify the socioeconomic and demographic factors and the comorbidities associated
with the best quality of diet of residents of the rural area.
METHODS
Between January and June 2016, we carried out a population-based, cross-sectional study with residents of the rural area of Pelotas, State of Rio Grande do Sul, Brazil, aged 18 years or over. This study is part of a research consortium that has aimed to know the health characteristics of this population. We excluded adults or older adults with enteral or parenteral nutrition, institutionalized individuals, persons with mental disabilities that made them unable to answer the questionnaire, and individuals who were bedridden and who could not communicate or whose caregiver or guardian could not report food consumption. To estimate the prevalence of food consumption, we used as reference the prevalence of 10.8% for chicken consumption3. Thus, with a 95% confidence level, an acceptable error of 2.5 percentage points, a delineation effect of 2.0, and 10% for losses and refusals, the required sample was 1,302 individuals.
For the stage of recognition of the households, we used the Google Earth software along with a virtual map of the state of Rio Grande do Sul, provided by IBGE. From the aerial images, we determined centers with the largest household cluster, in each tract, ordered in a decreasing way in relation to the number of houses identified by the satellite images. To select the sampled households, we randomly selected the direction to be traveled in the first center (with the largest household cluster), until we selected 30 houses. When we reached the end of the direction indicated without identifying 30 houses, we restarted the process going to the next road, to the right of the first one. After tracing the entire first center, if we did not reach a total of 30 houses, we would go to the second center, repeating the process previously described. The methodological article of this study, available in this same edition, presents more details on the sampling13.
Dependent Variables
The quality of the diet was evaluated by the methodology proposed by Gomes et al.7, who have carried out a study with older adults from the urban area of the same city. The adapted version of the FFQ consisted of 13 markers of food consumption, related to last week’s consumption of vegetables, fruits, beans, milk, whole foods, red meat, chicken, fried food, preserved or canned food, cured food, frozen and ready-to-eat food (processed food), sweets, soft drinks, or artificial juices. The consumption of fast food was not questioned.
Food consumption was grouped into four categories: did not eat, 1–3 days, 4–6 days, and daily. We assigned points according to consumption categories and type of food, ranging from zero to three7. Thus, healthy foods receive an increasing score (no consumption = zero points, consumption every day = three points), while unhealthy foods received a decreasing score (no consumption = three points, consumption every day = zero points) (Box). The sums of the points amounted to a total score from zero to 30, resulting in the Adult Diet Quality Index (IQD-A). The total score was divided into tertiles, and individuals in the 3rd tertile were considered as having the highest score. The highest score indicates a better quality of the diet, that is, a higher frequency of consumption of healthy food and a lower frequency of consumption of unhealthy food.
Independent Variables
We characterized the sample in the socioeconomic, demographic, occupational, and health aspects: sex (observed), race (observed and subsequently dichotomized into white and non-white), age (complete years, later classified into 18 to 24 years, 25 to 39 years, 40 to 59 years, and 60 years or over), education level (in full years, subsequently categorized into zero to four years, five to eight years, and nine years or more), marital status (with partner or without partner), socioeconomic level, collected according to an instrument proposed by the Brazilian Association of Research Companies (ABEP)14, which considers the ownership of goods (television, radio, car, washing machine, VCR or DVD, refrigerator, and freezer), as well as education level of the household head, number of toilets/bathrooms in the household,
Box. Description of the score used to calculate the Adult Diet Quality Index (IQD-A).
Components of the IQD-A Score by category of consumption
Healthya – fruits, vegetables, beans, milk, meat or chicken, whole food
0 – Did not eat in the last week 1 – Ate 1–3 days/week 2 – Ate 4–6 days/week 3 – Ate everyday
Unhealthyb – fried food, cured and/or preserved food, frozen food (industrialized), soft drinks, artificial juices, sweets
3 – Did not eat in the last week 2 – Ate 1–3 days/week 1 – Ate 4–6 days/week 0 – Ate everyday Source: adapted from Gomes et al.7 (2016).
and presence of a monthly cleaning worker, which was later categorized into A or B (highest), C, and D or E (lowest), and number of residents (categorized into 1, 2, 3, and 4 or more). We also evaluated the rural activities carried out by the interviewee or by a member of the family, such as work with fishing, selling of animals, and selling of agricultural products, with dichotomous answers (no, yes). The morbidities of arterial hypertension and diabetes mellitus were obtained from the self-report of medical diagnosis of each of the diseases. To test the agreement, we used the question “Do you know how to read and write?”, obtained from a reduced quality control questionnaire, applied to 10% of respondents. We obtained a coefficient of 0.76 using the Kappa test. We could not use questions about food consumption, as the answers could vary over time.
Data Analysis
The data were collected in tablets and inserted directly into the electronic database by the questionnaire applied in RedCap (Research Electronic Data Capture). The analyses were carried out in the program SPSS, version 12.1. (Stata Corp, College Station, United States). We used the descriptive analysis to characterize the sample. In order to evaluate which food groups or combinations contributed to the category of better quality of the diet, we calculated the mean score of each group according to the tertiles of quality of the diet. We estimated the measures of effect using multinomial logistic regression to obtain the crude and adjusted odds ratio according to IQD-A categories, with low quality of diet as the reference category. The adjusted analysis considered two hierarchical levels. At the first level, we included the demographic and socioeconomic variables (sex, age, race, marital status, education level, number of residents, and work with fishing, sale of animals, and sale of agricultural products) which presented p < 0.20 in the crude analysis. At the second level, we added hypertension and diabetes mellitus. Variables with p < 0.20 were kept in the final model. Statistical associations with p ≤ 0.05 were considered significant. We considered the effect of the sampling design in all analyses, using the svy command. We also used weighting considering the number of fixed households according to IBGE data and those sampled within the districts of the rural area of Pelotas.
Ethical Aspects
The project was approved by the Research Ethics Committee of the Faculdade de Medicina of the Universidade Federal de Pelotas (Protocol 51399615.7.0000.5317). The individuals of the research or their guardians signed the informed consent.
RESULTS
We sampled 1,697 individuals eligible for the study. Losses and refusals amounted to 178 persons (10.5%), and most of them were males (70.8%) and aged between 40 and 59 years (7.6%). Thus, we interviewed 1,519 adults. All participants answered the FFQ.
Most of the sample consisted of women (51.7%), individuals aged 40 years or over (66.0%), white (85.1%), and with no partner (60.3%). Regarding the socioeconomic aspects, 75.6% of the participants had less than eight years of study and a fourth belonged to the class D or E; additionally, almost half of the households had four or more residents. Regarding the economic activities carried out by the interviewee or by a family member, one third sold agricultural products, 11% sold animals, and 4.9% worked with fishing (Table 1).
indicates a lower frequency of consumption in relation to other healthy foods. The mean score for the consumption of soft drinks, artificial juices, or sweet is also less than two, which indicates a higher frequency of consumption in relation other unhealthy foods in this tertile. In all the tertiles of quality of the diet, we observed a low frequency in the consumption of frozen or industrialized food, as this component of the IQD-A was close to three, which refers to the maximum score attributed according to the frequency of consumption (Box).
Table 1. Description of the sample according to the demographic, socioeconomic, and health variables.
Pelotas, State of Rio Grande do Sul, Brazil, 2016. (n = 1,519)
Variable n % (95%CI)
Sex
Male 734 48.3 (46.2–50.3)
Female 785 51.7 (49.7–53.7)
Age (years)
18–24 174 11.4 (10.0–12.9)
25–39 341 22.6 (18.9–26.1)
40–59 593 39.2 (36.8–41.6)
60 or over 411 26.8 (23.4–30.2)
Race
White 1,296 85.1 (79.6–90.6)
Non-white 223 14.9 (9.4–20.4)
Marital status
Without partner 920 60.3 (55.9–64.6)
With partner 599 39.7 (35.4–44.1)
Education level (full years)
0–4 582 38.7 (32.2–45.1)
5–8 558 36.9 (32.6–41.2)
9 or more 369 24.4 (18.0–30.9)
Number of residents
1 94 6.2 (4.5–7.9)
2 388 25.6 (20.2–31.1)
3 395 26.4 (22.1–30.6)
4 or more 635 41.8 (33.7–49.9)
Socioeconomic level (ABEP)
A or B 301 20.0 (14.3–25.7)
C 814 53.7 (48.2–59.3)
D or E 388 26.3 (20.1–32.4)
Work with fishing
No 1,448 95.1 (88.4–101.7)
Yes 64 4.9 (-1.7–11.6)
Selling of animals
No 1,341 89.0 (84.4–93.6)
Yes 171 11.0 (6.4–15.6)
Selling of agricultural products
No 1,010 67.3 (52.7–82.0)
Yes 502 32.7 (18.0–47.3)
SAH
No 994 65.7 (62.2–69.2)
Yes 522 34.3 (30.8–37.8)
DM
No 1,363 89.8 (88.3–91.3)
Yes 153 10.2 (8.7–11.7)
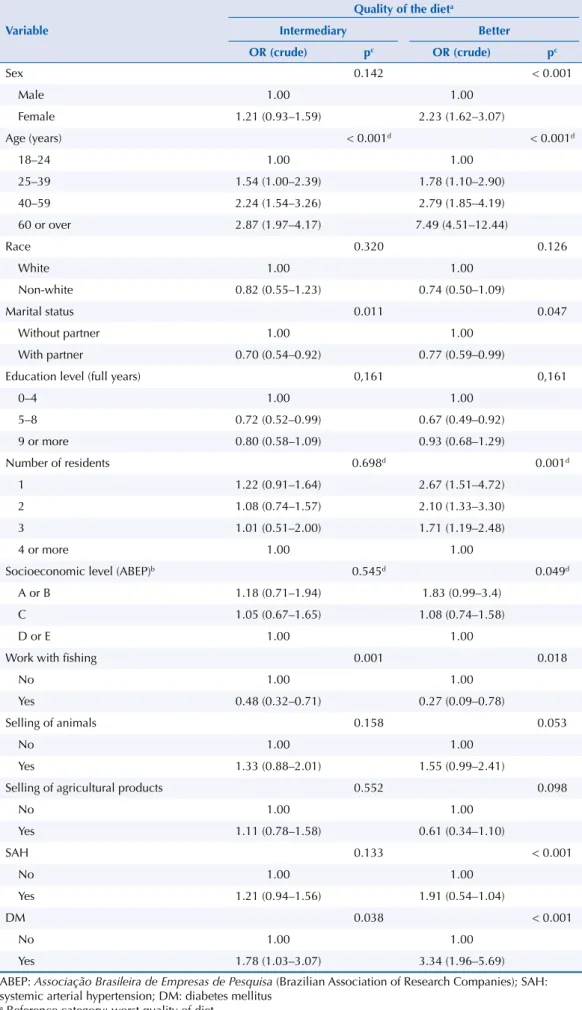
In the crude analysis, sex, age, marital status, number of residents, socioeconomic level, work with fishing, and diagnosis of hypertension or diabetes were significantly associated with high quality of diet (Table 2). After the adjusted analysis (Table 3), marital status, number of residents, and medical diagnosis of hypertension lost significance, and the sale of animals was associated with the outcome. Women were 2.4 times more likely (95%CI 1.61–3.44) to have better quality of diet than men. Age is directly associated with better quality of diet; individuals aged 60 years or over were seven times more likely (95%CI 4.20–12.48) to be in the tertile of better diet than those aged 18 to 24 years. Individuals in class A or B were 2.4 times more likely (95%CI 1.49–3.76) to have a better quality of diet than individuals in class D or E. Regarding the variables of rural activity, individuals who had family members working with fishing had a 70% lower chance of being in the category of better quality of diet (p = 0.005). However, individuals who had family members working with the sale of animals had an 84% greater chance of being in the category of better quality of diet (p = 0.020). Individuals who reported a medical diagnosis of diabetes mellitus were twice as likely (95%CI 1.33–3.42) to have a better quality of diet.
1.87 1.89
2.76
1.19 2.13
2.04
2.84
1.49 2.41
2.25
2.91
1.74
0 0.5 1 1.5 2 2.5 3
Fried food Cured or
peserved food
Frozen food (industrialized)
Soft drinks, artificial juices or sweet
(B) Mean of eac
h component of the IQD-A
Components of the IQD-A
1.04 1.00
1.66
0.55
0.14
1.47
1.52 1.64
2.03
1.25
0.42
1.57 2.36
2.20 2.18
2.1
1.13
1.66
0 0.5 1 1.5 2 2.5 3
Fruits Vegetables Beans Whole food
(A) Mean of eac
h component of the IQD-A
Components of the IQD-A Worse Intermediary Better
Quality of the diet
Worse Intermediary Better Quality of the diet
Meat or chicken Milk
IQD-A: Adult Diet Quality Index
(A) Higher means indicate higher frequency of consumption. (B) Higher means indicate lower frequency of consumption.
Figure. Mean of each component according to the categories of the IQD-A. Pelotas, State of Rio Grande
Table 2. Crude analysis between quality of the diet and demographic, economic, and health variables. Pelotas, State of Rio Grande do Sul, Brazil, 2016. (n = 1,519)
Variable
Quality of the dieta
Intermediary Better
OR (crude) pc OR (crude) pc
Sex 0.142 < 0.001
Male 1.00 1.00
Female 1.21 (0.93–1.59) 2.23 (1.62–3.07)
Age (years) < 0.001d < 0.001d
18–24 1.00 1.00
25–39 1.54 (1.00–2.39) 1.78 (1.10–2.90)
40–59 2.24 (1.54–3.26) 2.79 (1.85–4.19)
60 or over 2.87 (1.97–4.17) 7.49 (4.51–12.44)
Race 0.320 0.126
White 1.00 1.00
Non-white 0.82 (0.55–1.23) 0.74 (0.50–1.09)
Marital status 0.011 0.047
Without partner 1.00 1.00
With partner 0.70 (0.54–0.92) 0.77 (0.59–0.99)
Education level (full years) 0,161 0,161
0–4 1.00 1.00
5–8 0.72 (0.52–0.99) 0.67 (0.49–0.92)
9 or more 0.80 (0.58–1.09) 0.93 (0.68–1.29)
Number of residents 0.698d 0.001d
1 1.22 (0.91–1.64) 2.67 (1.51–4.72)
2 1.08 (0.74–1.57) 2.10 (1.33–3.30)
3 1.01 (0.51–2.00) 1.71 (1.19–2.48)
4 or more 1.00 1.00
Socioeconomic level (ABEP)b 0.545d 0.049d
A or B 1.18 (0.71–1.94) 1.83 (0.99–3.4)
C 1.05 (0.67–1.65) 1.08 (0.74–1.58)
D or E 1.00 1.00
Work with fishing 0.001 0.018
No 1.00 1.00
Yes 0.48 (0.32–0.71) 0.27 (0.09–0.78)
Selling of animals 0.158 0.053
No 1.00 1.00
Yes 1.33 (0.88–2.01) 1.55 (0.99–2.41)
Selling of agricultural products 0.552 0.098
No 1.00 1.00
Yes 1.11 (0.78–1.58) 0.61 (0.34–1.10)
SAH 0.133 < 0.001
No 1.00 1.00
Yes 1.21 (0.94–1.56) 1.91 (0.54–1.04)
DM 0.038 < 0.001
No 1.00 1.00
Yes 1.78 (1.03–3.07) 3.34 (1.96–5.69)
ABEP: Associação Brasileira de Empresas de Pesquisa (Brazilian Association of Research Companies); SAH: systemic arterial hypertension; DM: diabetes mellitus
DISCUSSION
Regarding the quality of the diet, almost 50% of the adults and older adults in the rural area of Pelotas reached only half of the maximum score. Among the evaluated foods, those that contributed the least to the tertile of better quality of the diet were meat or chicken and whole foods, as they had a lower frequency of consumption than other healthy foods, and soft drinks, artificial juices, or sweet, as they had a higher frequency of consumption than other unhealthy foods. Women, individuals with diabetes, older persons, those with a higher socioeconomic level, and those who worked or had relatives who worked in the sale of animals were more likely to be in the tertile of better quality of the diet. On the other hand, individuals whose families worked with fishing presented a lower chance of having
a better quality of the diet.
The highest concentration of women and older individuals in the group of better quality of
the diet is consistent with the studies carried out in the urban area6,12, while the association
Table 3. Factors associated with better quality of the diet among adults living in rural areas. Pelotas,
State of Rio Grande do Sul, Brazil, 2016. (n = 1,519)
Variable
Quality of the dieta
Intermediary Better
OR (adjusted) pb OR (adjusted) pb
Sex 0.129 < 0.001
Male 1.00 1.00
Female 1.25 (0.93–1.69) 2.35 (1.61–3.44)
Age (years) < 0.001c < 0.001c
18–24 1.00 1.00
25–39 1.57 (1.02–2.42) 1.82 (1.18–2.80)
40–59 2.37 (1.64–3.42) 2.86 (1.86–4.39)
60 or over 3.19 (2.12–4.80) 7.23 (4.20–12.48)
Socioeconomic level (ABEP) 0.769c 0.001c
A or B 1.08 (0.67–1.76) 2.37 (1.49–3.76)
C 0.97 (0.60–1.57) 1.34 (1.01–1.78)
D or E 1.00 1.00
Number of residents 0.056 0.056
1 0.83 (0.39–1.74) 1.78 (1.22–2.58)
2 0.85 (0.55–1.31) 1.40 (0.87–2.26)
3 1.25 (0.92–1.70) 1.90 (1.01–3.59)
4 or more 1.00 1.00
Work with fishing < 0.001 0.005
No 1.00 1.00
Yes 0.48 (0.33–0.70) 0.30 (0.14–0.67)
Selling of animals 0.193 0.020
No 1.00 1.00
Yes 1.33 (0.86–2.05) 1.84 (1.11–3.06)
Selling of agricultural products 0.937 0.051
No 1.00 1.00
Yes 0.99 (0.67–1.44) 0.57 (0.32–1.00)
DM 0.199 0.003
No 1.00 1.00
Yes 1.41 (0.82–2.40) 2.13 (1.33–3.42)
ABEP: Associação Brasileira de Empresas de Pesquisa (Brazilian Association of Research Companies); DM: diabetes mellitus
with the socioeconomic level is controversial6,12. Women generally have better nutrition, health and body care, greater nutritional knowledge, and include healthier foods in the diet when compared to men15,16. The better quality of the diet of older individuals may be related to the formation of eating habits at a time when there was a low supply of processed or ultra-processed foods17. The increase in the prevalence of chronic diseases in older adults increases the search for health services, which boosts the opportunity to receive guidelines
that contribute to better food choices18 and makes adherence to a healthy lifestyle necessary for survival. We also have survival bias in older adults, since older individuals with poorer quality of the diet have a higher risk of death and thus, survivors can concentrate individuals
with better quality of the diet.
Individuals with higher purchasing power have greater access to healthier foods19, which may explain the higher proportion of persons in the higher socioeconomic classes in the tertile of better quality of diet. Expenditure with food is the second most important in family expenses and the one with the greatest weight in the budget of rural families and low income families20. However, this relation has not been fully elucidated, as studies show a positive effect of the economic level on the quality of the diet with increased consumption of fruits or vegetables17,21, but they also show a high consumption of food rich in saturated fat and simple carbohydrates. Thus, income can influence food consumption, without it being necessarily reflected in the quality of food21.
Several studies have found an association between education level and the quality of the
diet6,12,22. In this study, education level was correlated at the economic level and, therefore, we excluded it from the final model. Individuals with higher education have more information on how and why to have a healthy diet12. Similarly to other studies conducted in the urban area, race and marital status were not associated with quality of the diet6,12.
As for rural activities, the higher proportion of individuals who have family members working with fishing in the group of poorer quality of the diet and the higher proportion of individuals who have family members working with the sale of animals in the tertile of better quality of the diet may be related to the residual confusion of the socioeconomic level. The organization of routes and access to services and the quality of the diet in the rural district of Pelotas, where the main economic activity is fishing, is similar to the peripheral and less developed urban area. In addition, work with fishing requires long working hours, which may hinder the access to healthy food. On the other hand, the sale of animals could be related to a greater diversification of economic activity.
Consistent with the literature23, a greater proportion of individuals with diabetes were in the group of better quality of the diet, but this association is affected by reverse causality, as, after the diagnosis of the disease, individuals are guided to reduce the consumption of simple carbohydrates24. However, individuals diagnosed with hypertension did not present better quality of diet. This could be related to a greater emphasis on salt reduction than on reduced fat consumption25, or lower adherence of individuals with hypertension to this treatment aspect.
memory bias, on the other hand does not reflect the long-term food habit, including seasonal variabilities. Another limitation is related to potential inaccuracies in the classification of the socioeconomic level according to the ABEP criterion14, as this classification was developed
for the urban area.
We conclude that public policies are needed to promote the low consumption of industrialized food and encourage the decreased consumption of soft drinks, artificial juices, or sweets and increased consumption of fruits and vegetables. This can be inserted in the context of policies for crop diversification, including cultivation for own consumption. These policies should prioritize low-income families.
The nutritional transition seems more advanced in younger adults. Considering that eating habits are formed in childhood and the role of children in transforming family habits, it is important to include food and nutrition education activities in schools. Primary health units are also privileged spaces for food and nutrition education activities, and it is essential to include persons with hypertension, since they do not seem to be adhering to a healthier diet. Special attention should be paid to fishermen and, in addition to educational activities, the support for access to minimum income policies is essential.
REFERENCES
1. Instituto Brasileiro de Geografia e Estatística. Censo Demográfico 2010. Rio de Janeiro: IBGE; 2010 [cited 2018 Feb 15]. Available from: http://www.censo2010.ibge.gov.br/
2. Instituto Brasileiro de Geografia e Estatística. Pesquisa de Orçamentos Familiares 2008-2009: antropometria e estado nutricional de crianças, adolescentes e adultos no Brasil. Rio de Janeiro: IBGE; 2010 [cited 2018 Feb 15]. Available from: https://biblioteca.ibge.gov.br/visualizacao/ livros/liv45419.pdf
3. Instituto Brasileiro de Geografia e Estatística. Pesquisa Nacional de Saúde 2013. Percepção do estado de saúde, estilos de vida e doenças crônicas: Brasil, Grandes Regiões e Unidades da Federação. Rio de Janeiro: IBGE; MS; 2014 [cited 2018 Feb 15]. Available from: ftp://ftp.ibge.gov.br/PNS/2013/pns2013.pdf
4. Lim SS, Vos T, Flaxman AD, Danaei G, Shibuya K, Adair-Rohani H, et al. A comparative risk assessment of burden of disease and injury attributable to 67 risk factors and risk factor clusters in 21 regions, 1990-2010: a systematic analysis for the Global Burden of Disease Study 2010.
Lancet. 2012;380(9859):2224-60. https://doi.org/10.1016/S0140-6736(12)61766-8
5. Moreira PRS, Rocha NP, Milagres LC, Novaes JF. Análise crítica da qualidade da dieta da população brasileira segundo o Índice de Alimentação Saudável: uma revisão sistemática. Cienc Saude Coletiva. 2015;20(12):3907-23. https://doi.org/.org/10.1590/1413-812320152012.18352015
6. Loureiro AS, Silva RMVG, Rodrigues PRM, Pereira RA, Wendpap LL, Ferreira MG. Diet quality in a sample of adults from Cuiabá (MT), Brazil: association with sociodemographic factors. Rev Nutr. 2013;26(4):431-41. https://doi.org/10.1590/S1415-52732013000400005
7. Gomes AP, Soares ALG, Gonçalves H. Baixa qualidade da dieta de idosos: estudo de base populacional no sul do Brasil. Cienc Saude Coletiva. 2016;21(11):3417-28.
https://doi.org/10.1590/1413-812320152111.17502015
8. Grisa C, Schneider S. “Plantar pro gasto”: a importância do autoconsumo entre famílias de agricultores do Rio Grande do Sul. Rev Econ Sociol Rural. 2008;46(2):481-515.
https://doi.org/10.1590/S0103-20032008000200008
9. Perestrelo JPP, Martins IS. Modernização rural: transformações econômicas e suas implicações demográficas, epidemiológicas e nutricionais nos municípios de Monteiro Lobato e Santo Antônio do Pinhal. Saude Soc. 2003;12(2):38-55. https://doi.org/10.1590/S0104-12902003000200005
11. Instituto Brasileiro de Geografia e Estatística. Pesquisa de Orçamentos Familiares 2008-2009: análise do consumo alimentar pessoal no Brasil. Rio de Janeiro: IBGE; 2011 [cited 2018 Feb 15]. Available from: https://biblioteca.ibge.gov.br/visualizacao/livros/liv50063.pdf
12. Morimoto JM, Latorre MRDO, César CLG, Carandina L, Barros MBA, Goldbaum M, et al. Fatores associados à qualidade da dieta de adultos residentes na Região Metropolitana de São Paulo, Brasil, 2002. Cad Saude Publica. 2008;24(1):169-78. https://doi.org/10.1590/S0102-311X2008000100017
13. Gonçalves H, Tomasi E, Tovo-Rodrigues L, Bielemann RM, Machado AKF, Ruivo ACO, et al. Estudo de base populacional na zona rural: metodologia e desafios. Rev Saude Publica. 2018;52 Supl 1:3s. https://doi.org/10.11606/S1518-8787.2018052000270
14. Associação Brasileira de Empresas de Pesquisa. Critério de Classificação Econômica do Brasil. São Paulo: ABEP; 2014 [cited 2018 Feb 15]. Available from: http://www.abep.org/criterio-brasil 15. Dias-da-Costa JS, Olinto MTA, Gigante DP, Menezes AMB, Macedo S, Daltoé T, et al.
Utilização de serviços ambulatoriais de saúde em Pelotas, Rio Grande do Sul, Brasil: alguns fatores relacionados com as consultas médicas acima da média. Cad Saude Publica. 2008;24(2):353-63. https://doi.org//10.1590/S0102-311X2008000200014
16. Hiza HAB, Casavale KO, Guenther PM, Davis CA. Diet quality of Americans differs by age, sex, race/ethnicity, income, and education level. J Acad Nutr Diet.2013;113(2):297-306. https://doi. org/10.1016/j.jand.2012.08.011
17. Mondini L, Moraes SA, Freitas ICM, Gimeno SGA. Consumo de frutas e hortaliças por adultos em Ribeirão Preto, SP. Rev Saude Publica. 2010;44(4):686-94. https://doi.org/10.1590/S0034-89102010000400012
18. Muniz LC, Schneider BC, Silva ICM, Matijasevich A, Santos IS. Fatores de risco comportamentais acumulados para doenças cardiovasculares no sul do Brasil. Rev Saude Publica. 2012;46(3):534-42. https://doi.org/10.1590/S0034-89102012005000021
19. Zart VB, Aerts D, Rosa C, Béria JU, Raymann BW, Gigante LP, et al. Cuidados alimentares e fatores associados em Canoas, RS, Brasil. Epidemiol Serv Saude. 2010;19(2):143-54. https://doi.org/10.5123/S1679-49742010000200007
20. Coelho AB, Aguiar DRD, Fernandes EA. Padrão de consumo de alimentos no Brasil. Rev Econ
Sociol Rural. 2009;47(2):335-62. https://doi.org/10.1590/S0103-20032009000200002
21. Pinho CPS, Diniz AS, Arruda IKG, Lira PIC, Cabral PC, Siqueira LAS, et al. Consumo de alimentos protetores e preditores do risco cardiovascular em adultos do estado de Pernambuco.
Rev Nutr. 2012;25(3):341-51. https://doi.org/10.1590/S1415-52732012000300004
22. Forshee RA, Storey ML. Demographics, not beverage consumption, is associated with diet quality. Int J Food Sci Nutr. 2006;57(7-8):494-511. https://doi.org/10.1080/09637480600991240
23. Assumpção D, Domene SMA, Fisberg RM, Barros MBA. Qualidade da dieta e fatores associados entre idosos: estudo de base populacional em Campinas, São Paulo, Brasil. Cad Saude Publica. 2014;30(8):1680-94. https://doi.org//10.1590/0102-311X00009113
24. Ministério da Saúde (BR), Secretaria de Políticas de Saúde; Departamento de Atenção Básica, Área Técnica de Diabetes e Hipertensão Arterial. Hipertensão arterial sistêmica (HAS) e Diabetes mellitus (DM). Brasília (DF); 2001 [cited 2018 Feb 15]. (Cadernos de Atenção Básica, 7). Available from: http://bvsms.saude.gov.br/bvs/publicacoes/cd05_06.pdf
25. Flores TR, Nunes BP, Assunção MCF, Bertoldi AD. Hábitos saudáveis: que tipo de orientação a população idosa está recebendo dos profissionais de saúde? Rev BrasEpidemiol.
2016;19(1):167-80. https://doi.org//10.1590/1980-5497201600010015
Funding: Programa de Excelência Acadêmica da Coordenação de Aperfeiçoamento de Pessoal de Nível Superior
(PROEX/CAPES – Process 23038.002445/2015-97, benefit number 1012/2015).
Authors’ Contribution: Design and planning of the study: MPF, AGF. Analysis and interpretation of the data,
preparation of the study: MPF, RMB, AGF. Critical review of the study: RMB, AGF. Approval of the final version: RMB, AGF. Public responsibility for the content of the article: MPF, RMB, AGF.