EVALUATION
OF NUTRITION
SURVEILLANCE
INDICATORS
Frederick L. Trowbridge,*
Ladene Newton,3 Alan Huong,3
Norman Staehling,d and Victor Valverde5
Simple, readily available data from outpatient health clinics may provide useful information about a population’s nutritional status. Preliminary information from El Salvador suggests that two in-
dicators- based on clinical weight-for-age data and clinically diag
nosed malnutrition cases-could be useful for that purpose.
Introduction
There has been increasing recognition of the need for nutrition surveillance as a basic element of nutrition evaluation and planning. A World Health Organization monograph on the subject (1) outlines how such surveillance might be carried out, emphasizing that nutri- tion surveillance should be a multisector ac- tivity that monitors agricultural and eco- nomic indicators relating to causes of malnu- trition as well as health indicators reflecting the effects of malnutrition.
Development of comprehensive and credi- ble surveillance systems will require the evaluation of possible indicators from all these sectors. As a first step toward this ultimate objective, the study reported here evaluated indicators obtained solely from
‘From the Center for Infectious Disease, Centers for Disease Control, United States Department of Health and Human Services, Atlanta, Georgia 30333, U.S.A.; the In- stitute of Nutrition of Central America and Panama, Guatemala City, Guatemala: and the Division of Human Nutrition, Department of International Health, Johns Hopkins University, School of Hygiene and Public Health, 615 N. Wolfe Street, Baltimore, Maryland 21205, U.S.A.
ZMedical Epidemiologist, Center for Infectious Dis- ease, Centers for Disease Control, Atlanta, Georgia. Pres- ently Assistant Professor, the Division of Human Nutri- tion, Department of International Health, Johns Hopkins University, School of Hygiene and Public Health.
SCenter for Infectious Disease, Centers for Disease Control, Atlanta, Georgia.
4Center for Health Promotion and Education, Centers for Disease Control, Atlanta, Georgia.
5Division of Human Development, Institute of Nutri- tion of Central America and Panama, Guatemala City, Guatemala.
within the health sector in terms of their use- fulness for monitoring changes in nutritional status. Various indicators have been proposed for this purpose -including infant and child- hood mortality, the incidence of low birth- weights, and the height of children entering school. However, these indicators have numerous potential weaknesses, and in many cases the data required to generate them are not readily available.
Another type of information about nutri- tional status that might be used for surveil- lance purposes is data derived from outpa- tient health clinics. Such data include those derived from reported cases of clinical malnu- trition and weight-for-age data on preschool children attending clinics. There have been well-deserved reservations about employing these types of data, since the techniques used to collect them may be poorly standardized and since health data from clinic attendees may not reflect the general population’s health or nutritional status.
On the other hand, clinic data have impor- tant potential advantages. One advantage is that they relate specifically to malnutrition rather than to general health. Another ad- vantage, of even greater practical impor- tance, is that these data are routinely col- lected and readily available, so there is no need to initiate and maintain a new data system.
Any nutrition indicators derived from routine health clinic data require evaluation to determine their worth for monitoring nutritional status. The central objective of
Trowbridge et al. l NUTRITION SURVEILLANCE INDICATORS 239
our study was to make such an evaluation of indicators based upon routinely collected data from outpatient clinics in El Salvador. More specifically, the study evaluated the in- dicators’ ability to reflect regional differences and seasonal changes in nutritional status. Our basic hypothesis was that such data might prove useful not as a precise evaluation tool, but rather as a practical guide to broad trends in the prevalence and distribution of malnutrition.
Methodology
Five geographically distinct regions of El
Salvador were defined in the course of an assessment of nutritional conditions made by the Institute of Nutrition of Central America and Panama (INCAP). The five regions in- cluded a marginal agricultural area in the country’s mountainous northern frontier, a more central area of marginal agriculture where some cash crops were also grown, a coffee-growing area in the country’s central mountains, an area of intensive cash crop agriculture along the Pacific Coast, and an urban slum area on the outskirts of San Salva- dor, the capital city. These areas were respec- tively designated as the Northern, Central, Coffee, Coastal, and Urban regions.
In each region, 30 to 40 sample sites were selected, the probability of selection being based on each site’s population. At each site a randomly chosen group of households was visited, and all children 6-59 months of age in these households were measured until data from approximately 40 children had been gathered. The measurements included each child’s weight, height, and mid-upper arm circumference. Weight measurements were made by suspending the child in a cloth sling and determining the weight with a Salter spring-type scale. Height measurements were made with a portable measuring board. Arm circumferences were determined using an insertion-type tape measure developed for this purpose (2). Age was determined by question- ing the mother or the responsible adult caring for the child, a satisfactory method in this
culture where birthdays are generally known. All the measurements were made by a two- man team trained in anthropometric tech- niques in a pilot area. Anthropometry data were analyzed using the Iowa reference population data adopted by INCAP (3).
In the same five regions, data from a sam- ple of 44 government health clinics were col- lected. These were used as the basis for calculating nutritional status indicators that could then be compared with the measure- ments obtained in the field. In collaboration with the Ministry of Health, each sample clinic was visited and clinic records were reviewed. From those records we obtained the recorded weight and age of each child 12-59 months of age who received a medical ex- amination in 1975-1976 and the date of that
examination. The weight-for-age or “Gomez” (4) nutrition grade calculated by the clinic nurse was recorded for comparison with the computer-calculated weight-for-age grade.
One indicator of the clinic attendees’ nutri- tional status was derived by calculating the percentage of children examined who had weight-for-age values less than 75 per cent of the Iowa reference standard. This indicator was termed the weight-for-age index.
A second indicator of the clinic attendees’ nutritional status was derived from clinical diagnoses of malnutrition made by Ministry of Health physicians in those clinics. Com- puterized Ministry of Health data from each sample clinic were tabulated to show the per- centage of that clinic’s attendees in the 12-59 month age group who were clinically diag- nosed as malnourished during 1975 and 1976. Only the results of initial visits were tabulated; data from subsequent follow-up visits by the same child were excluded. Like the weight-for-age indicator, the indicator based on the percentage of clinic attendees clinically diagnosed as malnourished was compared with the field survey data.
conditions (5), the two nutrition indicators and the diarrhea1 disease indicator were tabu- lated for the same three-month period in which the field survey measurements were made.
Results
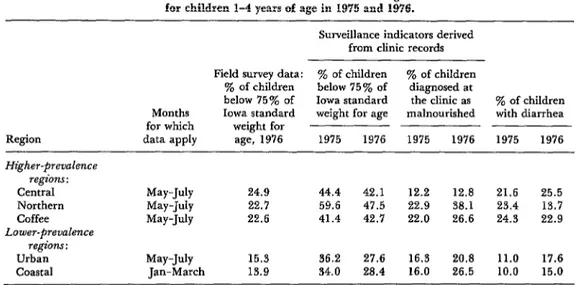
A comparison of the nutrition status in- dicators with field survey measurements is presented in Table 1. The malnutrition prevalence survey of 1976 indicated the geo- graphic areas studied could be segregated into two kinds of regions: higher-prevalence regions (the Central, Northern, and Coffee areas) with malnutrition prevalences ranging from 22.6 to 24.9 per cent and lower- prevalence regions (the Urban and Coastal areas) with malnutrition prevalences ranging from 13.9 to 15.3 per cent. The observed dif- ferences between malnutrition prevalences in these two sets of regions was highly significant (p < 0.01).
The clinic weight-for-age indicator showed similar patterns of high and low prevalence for both 1975 and 1976. However, the malnu- trition prevalences obtained for each region with this indicator were consistently about
twice the prevalences detected by the field survey for that region.
The clinical diagnosis indicator did not provide results that were consistent for both years studied, nor did it detect the high and low regional patterns brought out by the weight-for-age indicator.
Evaluation of diarrhea1 disease in the clinic populations (see Table 1) indicated that in
1975 diarrhea prevalences followed the same relatively high and relatively low regional pat- terns defined by field data and the weight-for- age index. The same was true of the 1976 diarrhea data with one notable excep- tion- the Northern region, which showed a relatively low diarrhea prevalence that year but a relatively high prevalence of malnutri- tion.
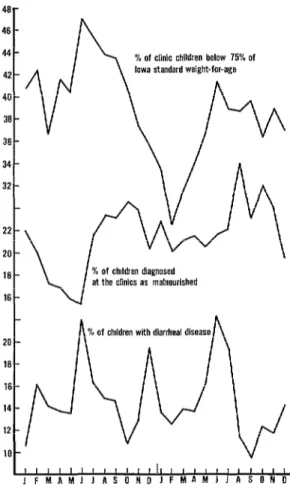
Over the three-month period for which field survey data were tabulated, the diarrhea prevalences shown did not correspond closely with prevalences of clinically diagnosed mal- nutrition. However, when the combined clini- cal data (from all the regions) were viewed over a two-year time span, a relationship could be observed between the prevalences of diarrhea and of clinically diagnosed malnu- trition (Figure 1). Peak diarrhea prevalences preceded peak clinical malnutrition preva-
Table 1. A comparison of nutritional field survey data with two nutritional indicators and diarrhea1 disease data derived from clinic records in five regions of El Salvador
for children 1-4 years of age in 1975 and 1976.
Surveillance indicators derived from clinic records
Region Higher-prevalence
regions : Central Northern Coffee Lower-prevalence
regions: Urban Coastal
Field survey data: y0 of children To of children y0 of children below 75% of diagnosed at
below 75% of Iowa standard the clinic as ‘% of children Months Iowa standard weight for age malnourished with diarrhea for which weight for
data apply age, 1976 1975 1976 1975 1976 1975 1976
May-July 24.9 44.4 42.1 12.2 12.8 21.6 25.5 May-July 22.7 59.6 47.5 22.9 38.1 23.4 13.7 May-July 22.6 41.4 42.7 22.0 26.6 24.3 22.9
Trowbridge et al. l NUTRITION SURVEILLANCE INDICATORS 241
20 -
16 -
16 -
14 -
12 -
10 -
Figure 1. Malnutrition indicator findings and re- corded diarrhea1 disease prevalences for children 14
years of age in the Salvadorean clinics surveyed, by month, in 1975-1976.
lences by several months, but both showed distinct and related seasonal patterns.
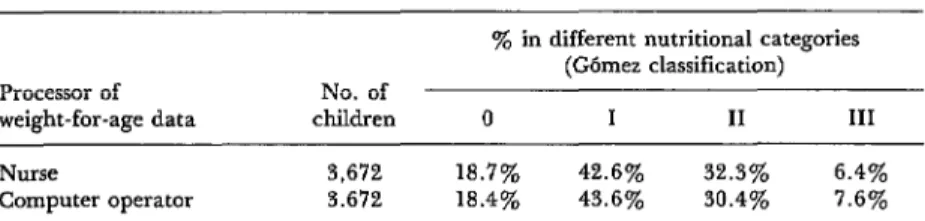
Comparison of weight-for-age grades of malnutrition calculated by the clinic nurses and by a computer operator using the same data indicated a high degree of cor- respondence between the two (Table 2). Overall, examination of data from 3,672 children l-4 years of age revealed no signifi- cant difference between nurse-calculated and computer-calculated results.
Discussion
The correlation between the clinic weight- for-age indicator and the field nutrition measurements supports the contention that
this indicator is useful and valid for nutrition surveillance. Also, the indicator’s consistency over the two years studied suggests that it reflects real and persistent nutritional characteristics of the study regions involved. The relationship between malnutrition, as reflected by this weight-for-age indicator, and diarrhea is consistent with the frequently observed link between diarrhea and malnutri- tion.
Nevertheless, the apparent advantages of the weight-for-age indicator must be bal- anced against its potential weaknesses. The fact that an association between the indicator and field measurements was found in this study provides no assurance that such an association would necessarily be found in other countries. Also, it is necessary to qualify the findings with important reservations con- cerning the representativeness of this type of health clinic data and the accuracy and reliability of the weight measurements record- ed.
The less precise correlation between the clinical diagnosis indicator and the field survey measurements suggests that this in- dicator may provide a less useful reflection of current nutritional status. Difficulties such as physicians’ subjectivity and lack of standard- ized methods in diagnosing malnutrition could partly account for this indicator’s ap- parent insensitivity.
Table 2. A comparison of nurse-calculated and computer-calculated prades of malnutrition based on the same weight-for-age data from
children 1-4 years of age in El Salvador, 1975-1976.
Processor of No. of weight-for-age data children
‘$& in different nutritional categories (Gbmez classification)
0 I II III
Nurse
Computer operator
3,672 18.7% 42.6% 32.3% 6.4% 3.672 18.4% 43.6% 30.4% 7.6%
valid indicator for use in surveillance of nutri- tional status, but one that cannot be expected to reflect short-term changes in nutritional conditions.
The surveillance indicators’ detection of seasonal malnutrition and diarrhea patterns has potential practical significance for plan- ning. Knowledge of seasonal prevalence peaks may help key maximum supplementary food and medical assistance to times of maximum nutritional hardship. The surveillance data may also help planners to define regions where nutritional conditions are most severe and to evaluate long-term nutritional changes.
The close correlation between nurse-calcu- lated and computer-calculated weight-for- age grades also has potential practical signifi-
cance. Our results suggest that readily avail-
able nurse-calculated nutrition grades could be used for surveillance by local and regional personnel without need of computer assis- tance.
Conclusions
The results of this study suggest that simple and readily available data from government
health clinics can be used in nutritional sur- veillance to derive indicators of nutritional status. The most sensitive indicator of the two assessed appears to be that derived from weight-for-age data. We found this indicator to reflect measured regional differences in malnutrition as well as seasonal changes in nutritional status. The surveillance indicator derived from clinical diagnosis data did not reflect regional differences in malnutrition and appears unsatisfactory for that purpose. However, when observed over a prolonged period, the clinical diagnosis indicator was found to reflect seasonal changes in malnutri- tion. This suggests that although it may be less sensitive to acute nutritional changes, the clinical diagnosis indicator might still play a useful role in detecting relatively long-term trends.
Of course, these results from El Salvador do not necessarily ensure that similar indicators derived from routinely reported health clinic data would be equally useful or valid in other countries. But their demonstrated usefulness and practicality in El Salvador does suggest that similar data in other countries merit evaluation for possible use in simple and prac- tical systems of nutrition status surveillance.
SUMMARY
Trowbridge et al. l NUTRITION SURVEILLANCE INDICATORS 243
regions of El Salvador. The field surveys were con- ducted during 1975-1976, and the clinical data analyzed pertained to those years.
The results of the comparison suggest that sim- ple data readily available at government clinics can be used to derive acceptable indicators of a popula- tion’s nutritional status. Of the two possible in- dicators assessed, the most sensitive appeared to be that derived from clinical weight-for-age data. For the Salvadorean areas studied, this indicator showed both regional differences in the prevalence of malnutrition and seasonal changes in nutritional
status. The other indicator, derived from clinically diagnosed cases of malnutrition, did not register these regional differences but did show seasonal changes. Despite its limitations, it appears that this latter indicator may still play a useful role in detec- ting relatively long-term trends.
Of course, there is no guarantee that these in- dicators will prove equally valid in other cir- cumstances and countries. But their demonstrated value in El Salvador does suggest that similar data in other countries merit evaluation for possible use in monitoring nutritional status.
REFERENCES
(I) World Health Organization. Methodology of (3) Jackson, R. L., and H. G. Kelly. J Pediutr
Nutritional Surueillance: Report of a Joint 27:215, 1945.
FAO/UNICEF/ WHO Expert Committee. WHO (4) Gomez, F., et al. J Trap Pediatr 2:77, 1956. Technical Report Series, No. 593. Geneva, 1976. (5) Trowbridge, F. L., and L. H. Newton. AmJ
(2) Zerfas, A. J. Am J Clin Nutr 28:782, 1975. Trap Med Hyg 28:135, 1979.
I
MONITORING OF PSYCHOTROPIC DRUGSA World Health Organization Expert Committee meeting in Geneva on 15-20 September 1980 has called for continuous monitoring of psychotropic drugs. WHO monitoring is needed, the committee says, to clearly establish causal relationships between drug use and the social and public health prob- lems that have become associated with drug-taking.
At present, the major obstacle to weighing a drug’s capacity for harm against its potential benefits is the absence of uniform and reliable data. In general, information is lacking on the quantities of potentially harmful drugs produced, the ways they are distributed, the manner in which they are prescribed, and some of their possible effects. Among other things, the com- mittee asserted, “further research is required to ascertain the role of psychotropic drugs in road traffic accidents.”
Such data would help determine whether a drug should be subject to con- trol under the 1971 Convention of Psychotropic Substances, a convention that gives WHO a mandate to recommend control measures when a drug is known to be a threat to public health and social welfare. Thus far in 1980, international control has been recommended for five psychotropic drugs. 1 Among these is phencyclidine, commonly known as “angel dust,” a drug manufactured for veterinary purposes that has come to be-widely abused by young people in North America.