• Nenhum resultado encontrado

Rev. Saúde Pública vol.41 suppl.1

N/A
N/A
Protected

Academic year: 2018

Share "Rev. Saúde Pública vol.41 suppl.1"

Copied!
11
0
0

Texto

(1)

José Ueleres Braga

Departamento de Epidemiologia. Instituto de Medicina Social. Universidade do Estado do Rio de Janeiro. Rio de Janeiro, RJ, Brasil

Correspondence:

José Ueleres Braga

R. Belisário Távora 653, apto. 202 Laranjeiras

22245-070 Rio de Janeiro, RJ, Brasil E-mail: ueleres@pq.cnpq.br Received: 1/30/2007 Approved: 3/27/2007

Tuberculosis surveillance and

health information system in

Brazil, 2001-2003

ABSTRACT

OBJECTIVE: To assess the quality of tuberculosis surveillance in Brazil.

METHODS: Local data from 2001 to 2003 were assessed according to the quality of detection and follow-up of the cases in the region, the quality of the information produced by the notifi cation system, and the load of morbidity of tuberculosis. Cities were classifi ed into four groups, according to tuberculosis epidemiologic stage and the quality of tuberculosis surveillance.

RESULTS: In the study period, about 8% of the Brazilian cities presented over 10% of the cases of tuberculosis notifi ed by the health care services of another city. In about 950 cities, the frequency of patients with pulmonary tuberculosis undergoing sputum examination was lower than 90%. In the North region, Amazonas, Pará and Amapá presented more cities classifi ed in the groups of poor tuberculosis surveillance. In the Northeast, Pernambuco, Ceará and Bahia presented the poorest surveillance. The South and Midwest regions presented greater number of cities with better tuberculosis surveillance.

CONCLUSIONS: One third of the Brazilian cities present poor tuberculosis surveillance. This picture is not homogeneous in Brazil, and the regions with highest tuberculosis incidence have a great number of cities with apparently insuffi cient control measures.

KEY WORDS: Tuberculosis, epidemiology. Morbidity. Diseases registries. Registries. Data source. Brazil.

INTRODUCTION

The purpose of tuberculosis (TB) surveillance is to be aware of the cases of the disease in the population, so that measures to stop transmission to susceptible individuals can be taken. However, cases diagnosed and notifi ed by the health service may represent only a proportion of the TB cases.1

Estimating the number of TB cases in a certain population has been a challenge to epidemiologists and planners on TB control.* Current indirect methods of estimation depend on the accuracy on other TB data, such as the number of people infected by Mycobacterium tuberculosis, and the number of deaths. These data depend on the good work of health services.**,*** Studies on the

* Braga UJ. O uso da modelagem espacial na estimativa dos dados da tuberculose no Brasil [doctorate thesis]. Rio de Janeiro: Instituto de Medicina Social da UERJ; 1997.

** Penna MLF. Dinâmica epidemiológica da tuberculose: um modelo matemático para simulação da efetividade do diagnóstico e tratamento dos casos [doctorate thesis]. São Paulo: Faculdade de Saúde Pública da USP; 1994.

(2)

prevalence of TB cases are rare, complex in metho-dology and, therefore, not very often performed. In this context, methodological approaches to assess the actions on TB surveillance are welcome because they can identify situations in which data on TB notifi cation are different from its actual incidence.

Even though all sick patients may be acknowledged by the health services, notifi cation of these cases by the information system may not occur or the record may be incomplete. Thus, even with the diagnoses of the TB cases, the notifi cation in the information system may be poor, preventing to know the incidence of the dise-ase.4 Therefore, the diagnosis ability and the complete notifi cation of TB cases are necessary so that the data on epidemiological surveillance are accurate. Likewise, data on notifi cation records must be good quality. In Brazil, assessment of the actions to control TB is en-couraged because the proportion of cure for the disease is below the goal of 85%.* Good quality of information is essential to assess the program, since it enables to see the magnitude of the disease transmission in the country, and to defi ne the goal of how many cases will be treated. Poor quality of information does not enable to see whether actions have been taken or if the data have not been suitably entered onto the information system. Additionally, the quality of information may refl ect on the disease surveillance. In these situations, it is not possible to clearly defi ne if the problem of controlling TB lies on a poor surveillance, or if the problem is partial or total lack of data.

Regarding epidemiologic surveillance in itself, it is important to distinguish between two types of data. The fi rst type concerns notifi cation of the disease, that enable to assess if districts can detect and notify cases; and the second is the follow-up data of the district from notifi cation until the patient is removed from the system. The present study did not aim at assessing the problems of TB underreporting, but rather the epide-miologic surveillance of TB in Brazil. The indicators assessed were based on the quality of detection and follow-up of cases in the region, the quality of infor-mation given by the inforinfor-mation system of the cases, and the burden of morbidity.

METHODS

The ecological approach was used to assess the charac-teristics and quality of TB surveillance in the Brazilian districts, especially in priority ones. Apart from double

notifi cations, all information was obtained in the data bank of Sistema de Informação de Agravos de Noti-fi cação (Sinan – Information System for Notifi able Diseases) from 2001 to 2003, made available in March 2005.** Measures that could best qualify these cities were selected, resulting in synthetic indicators.

Spatial smoothing of the rates was used to minimize the infl uence of underreporting. This procedure was to estimate built spatial averages, using as a neighboring criteria the nearness among the districts as geographical unities.3,4,***

Specifi c indicators for each of the three assessment dimensions of surveillance were: quality of detection and follow-up of cases (surveillance – ability to get cases and grant adherence to treatment); quality of tre-atment information (completeness of data of the system of information and duplicate reporting) and burden of morbidity (incidence rate). This last dimension was included in the assessment of TB surveillance because it considered that the magnitude of the disease (the inten-sity of its expression) may also infl uence its recognition by the health services. The quality of surveillance is believed to have different repercussion in regions with high and low number of TB notifi cations.

Initially, eight indicators were established for quality of detection and follow-up of cases. Three of them were excluded, either because they were repeated informa-tion, or because of the low distinction among cities: proportion of pulmonary cases whose sputum shows bacilli on smear in the second month; proportion of smear positive pulmonary cases that underwent HIV test, and proportion of smear positive pulmonary cases with short term treatment information directly obser-ved, called DOTS (Directly Observed Treatment Short Course). Indicators of detection and follow-up of selec-ted cases are lisselec-ted in Table 1. As the TB surveillance systems are managed by the districts’ authorities, it is hoped that, in the ideal situation, sick dwellers from one city are diagnosed and notifi ed by the health service of their own city.

To assess the burden of information, 16 indicators were studied. An initial assessment of the data indicated that seven of them did not distinguish the districts satisfacto-rily and were excluded: proportion of cases with not in-formed situation when starting treatment (if it was a new case); cases with no information regarding the clinical form; extra pulmonary TB cases with no information regarding the clinical form; regarding the performance of sputum examination, or serum examination for HIV;

* Ministry of Health. Health Surveillance Secretariat. National Program on Tuberculosis Control. Brasília; 2004.

** Ministry of Health. Health Surveillance Secretariat. Guia para cálculo de indicadores básicos e de avaliação da base de dados de tubercu-lose do Sistema de Informação de Agravos de Notifi cação – SINAN. Brasília; 2004.

(3)

with no information on the date the treatment started. All districts had similar proportions of absence of in-formation on control sputum examination in the fourth and sixth month, and the indicator of the outcome in the end was maintained, being more informative. Thus, the indicators of quality of information that remained were those of proportion of cases without information on: treatment surveillance, control sputum examination in the second, and outcome sputum examination when the treatment ended.

Based on the initial assessment, six indicators that recognized duplicate reporting were obtained from correlation of records (linkage). Three of them were excluded because they presented high collinearity with the others: real duplicate reporting proportion; propor-tion of duplicate reporting due to lack of informapropor-tion, and proportion of duplicate reporting with no expla-nation. Completeness indicators which discriminated well the situation of duplicate reporting are presented in Table 2.

Table 1. Indicators of quality of detection and follow-up of cases.

Indicator Numerator/Denominator

Proportion of new cases reported by the district of residence

Number of cases reported by the district of residence X 100 Number of new cases

Proportion of pulmonary cases undergoing sputum examination

Number of cases with sputum examination X 100 Number of pulmonary cases

Proportion of smear positive pulmonary cases with information about the end of treatment

Number of smear positive pulmonary cases with info about the end in the 9 monthth X 100 Number of smear positive pulmonary cases

Proportion of smear positive pulmonary cases that abandoned treatment

Number of smear positive pulmonary cases with info about abandonment in the 9 month X 100 Number of smear positive pulmonary cases

Proportion of smear positive pulmonary cases under-going DOTS therapy

Number of smear positive pulmonary cases under supervised treatment X 100 Number of smear positive pulmonary cases

DOTS: Directly Observed Treatment, Short Course

Table 2. Indicators of quality of information (completeness of cases).

Indicator Numerator/Denominator

Proportion of cases lacking data on supervi-sed treatment

Number of cases lacking data on supervised X 100 Number of new cases

Proportion of cases lacking control sputum examination in the 2nd month

Number of cases lacking sputum examination in the 2 month X 100 Number of new pulmonary cases

Proportion of cases lacking outcome on the end of treatment

Number of cases lacking outcome on the end of treatment X 100 Number of new cases

Proportion of duplicate reporting between the case

Total number of duplicates X 100 Number of duplicates

Proportion of duplicates due to transfer Number of duplicates due to transfer X 100 Total number of duplicate reporting

Proportion of duplicates by a different notifi cation unity

Number of duplication by notifying unity X 100 Number of total duplicate reporting

Table 3. Indicator of the burden of morbidity.

Indicator Numerator/Denominator

Incidence rate of tuberculosis in all forms

Number of new cases in the year X 100.000 Population of the respective year Incidence rate of smear positive

pulmonary tuberculosis

Number of new cases with smear positive pulmonary tuberculosis in the year X 100.000 Population of the respective year

Proportion of HIV positive among new cases

(4)

Table 4. Cut-off points of the indicators of surveillance and magnitude of tuberculosis in Brazil.

Indicator Cut-off point

Proportion of new cases reported by the district of residence 0.90

Proportion of pulmonary cases undergoing sputum examination 0.80

Proportion of smear positive pulmonary cases with information about the end of treatment 0.80

Proportion of smear positive pulmonary cases that did not abandon treatment 0.90 Proportion of smear positive pulmonary cases undergoing DOTS therapy 0.33

Proportion of cases not lacking data on supervised treatment 0.70

Proportion of cases not lacking control sputum examination in the 2nd month 0.70

Proportion of cases not lacking outcome on the end of treatment 0.70 Proportion of non-duplicates among the cases 0.70

Proportion of non-duplicates by transference 0.70

Proportion of non-duplicates by different reporting unity 0.70

Incidence rate of tuberculosis in all forms 50 per 100,000 inhab. Incidence rate of smear positive pulmonary tuberculosis 20 per 100,000 inhab.

Proportion of HIV positive among new cases 0.15

Table 5. Distribution of districts according to the classifi cation of tuberculosis surveillance and burden of the disease. Brazil, 2001-2003.

Unity (region)

Classifi cation of the epidemiological situation and quality of tuberculosis

GI GII GIII GIV Total

N % N % N % N % N %

Year 2001

North 279 62.1 32 7.1 30 6.7 108 24.1 449 100.0 Northeast 1348 75.2 91 5.1 79 4.4 274 15.3 1792 100.0

Southeast 1425 85.4 75 4.5 68 4.1 100 6.0 1668 100.0

South 1011 85.0 41 3.4 24 2.0 113 9.5 1189 100.0

Midwest 380 82.1 47 10.2 10 2.2 26 5.6 463 100.0 Brazil 4443 79.9 286 5.1 211 3.8 621 11.2 5561 100.0

Year 2002

North 266 59.2 31 6.9 31 6.9 121 26.9 449 100.0

Northeast 1212 67.6 86 4.8 77 4.3 417 23.3 1792 100.0 Southeast 1229 73.7 138 8.3 80 4.8 221 13.2 1668 100.0

South 1030 86.6 54 4.5 22 1.9 83 7.0 1189 100.0

Midwest 363 78.4 51 11.0 13 2.8 36 7.8 463 100.0

Brazil 4100 73.7 360 6.5 223 4.0 878 15.8 5561 100.0 Year 2003

North 237 52.8 32 7.1 34 7.6 146 32.5 449 100.0

Northeast 1110 61.9 118 6.6 88 4.9 476 26.6 1792 100.0

Southeast 1030 61.8 87 5.2 124 7.4 427 25.6 1668 100.0 South 1032 86.8 65 5.5 20 1.7 72 6.1 1189 100.0

Midwest 380 82.1 40 8.6 8 1.7 35 7.6 463 100.0

Brazil 3789 68.1 342 6.1 274 4.9 1156 20.8 5561 100.0

(5)

Four indicators of morbidity were structured, presented on Table 3. Incidence rate of pulmonary TB was ex-cluded because it was considered little discriminatory information.

Assessment of indicators considers the existence of minimum conditions of quality of surveillance, re-presented by the cut-off points re-presented on Table 4. According to this table, districts that met the criteria of at least three of the indicators of quality of detection, and at least four criteria of the indicators of quality of information, were considered as presenting “good quality of surveillance”. Districts with at least two conditions of the indicators of burden of the expressed disease were considered as presenting “concerning epidemiological TB situation”. Cities were classifi ed according to the quality of epidemiological surveillance

of the disease, compared and grouped according to federal unity and geographical region, resulting in four groups of districts:

• Group I (GI) – regular TB epidemiological situation (moderate to low incidence) and good quality of surveillance.

• Group II (GII) – concerning TB epidemiological situation (high incidence) and good quality of surveillance.

• Group III (GIII) – concerning TB epidemiological situation and poor quality of surveillance.

• Group IV (GIV) – regular TB epidemiological situation and poor quality of surveillance.

Table 6. Frequency of districts in the North according to classifi cation of tuberculosis surveillance and burden of the disease. 2001-2003.

State/Region

Classifi cation of the epidemiological situation and quality of tuberculosis surveillance

GI GII GIII GIV Total

N % N % N % N % N %

Year 2001

Acre 15 68.2 4 18.2 2 9.1 1 4.5 22 100.0

Amazonas 29 46.8 9 14.5 7 11.3 17 27.4 62 100.0

Amapá 8 50.0 1 6.3 1 6.3 6 37.5 16 100.0

Pará 70 49.0 10 7.0 10 7.0 53 37.1 143 100.0 Rondônia 38 73.1 3 5.8 4 7.7 7 13.5 52 100.0

Roraima 12 80.0 1 6.7 1 6.7 1 6.7 15 100.0

Tocantins 107 77.0 4 2.9 5 3.6 23 16.5 139 100.0 North 279 62.1 32 7.1 30 6.7 108 24.1 449 100.0

Year 2002

Acre 20 90.9 1 4.5 1 4.5 0 0.0 22 100.0

Amazonas 21 33.9 3 4.8 13 21.0 25 40.3 62 100.0 Amapá 9 56.3 2 12.5 3 18.8 2 12.5 16 100.0

Pará 54 37.8 16 11.2 7 4.9 66 46.2 143 100.0

Rondônia 41 78.8 3 5.8 4 7.7 4 7.7 52 100.0

Roraima 10 66.7 3 20.0 0 0.0 2 13.3 15 100.0 Tocantins 111 79.9 3 2.2 3 2.2 22 15.8 139 100.0

North 266 59.2 31 6.9 31 6.9 121 26.9 449 100.0

Year 2003

Acre 15 68.2 0 0.0 3 13.6 4 18.2 22 100.0 Amazonas 17 27.4 6 9.7 7 11.3 32 51.6 62 100.0

Amapá 7 43.8 2 12.5 1 6.3 6 37.5 16 100.0

Pará 58 40.6 15 10.5 16 11.2 54 37.8 143 100.0

Rondônia 30 57.7 4 7.7 1 1.9 17 32.7 52 100.0 Roraima 9 60.0 2 13.3 1 6.7 3 20.0 15 100.0

Tocantins 101 72.7 3 2.2 5 3.6 30 21.6 139 100.0

(6)

Dispersion charts have been made to present the cor-relation between the incidence and the quality of TB surveillance. Incidence was represented by the quality of detection and follow-up of cases (surveillance

– ability to capture cases and assure adherence to treatment). Quality of information was represented by completeness of data placed on the information system and duplicate reporting.

Figure 1. Classifi cation of districts, according to notifi cation by district of residence. Brazil, 2001-2003 (A-C).

0 100 200 300 400

0 100 200 300 400

0 100 200 300 400

TB i

ncide

nce rate (all forms), 2001

0 20 40 60 80 100

0 20 40 60 80 100

0 20 40 60 80 100

Proportion of new cases notified by district of residence 2001

A

2002 B

2003 C

Proportion of new cases notified by district of residence

Proportion of new cases notified by district of residence

TB i

ncide

nce rate (all forms), 2002

TB i

ncide

nce rate (all forms), 2003

Figure 2. Classifi cation of districts, according to sputum examination of pulmonary cases. Brazil, 2001-2003 (A-C).

0 100 200 300 400

0 100 200 300 400

0 100 200 300 400

TB i

ncide

nce rate (all forms), 2001

0 20 40 60 80 100

0 20 40 60 80 100

0 20 40 60 80 100

2001 A

2002 B

2003 C

Proportion of pulmonary cases that underwent sputum examination

TB incide

nce rate (all forms), 2002

TB i

ncide

nce rate (all forms), 2003

Proportion of pulmonary cases that underwent sputum examination

(7)

RESULTS

Regarding patients seeking health services in other districts, over 10% of the reported cases of residents from 316 districts (7.5%) were notifi ed by other city in 2001. This percentage was kept in the following years, suggesting a poor quality of TB surveillance (Figure 1).

Figure 2 shows the classifi cation of districts regarding the proportion of new pulmonary TB cases that did

not undergo sputum examination. Based only on the examination of the data bank, it was impossible to distinguish when examinations were not performed, and when the record was not placed on the report form. Indirectly, this measure refl ects the ability to capture new cases, since if only a small proportion of pulmonary TB cases undergo sputum examination, the examination of respiratory symptoms may not be properly conducted. Figure 2 points up that many districts presented poor percentage of patients

under-Table 7. Frequency of districts in the Northeast according to classifi cation of tuberculosis surveillance and burden of the disease. 2001-2003.

State/Region

Classifi cation of the epidemiological situation and quality of tuberculosis surveillance

GI GII GIII GIV Total

N % N % N % N % N %

Year 2001

Alagoas 79 77.5 9 8.8 3 2.9 11 10.8 102 100.0

Bahia 383 91.8 4 1.0 0 0.0 30 7.2 417 100.0 Ceará 117 63.6 30 16.3 7 3.8 30 16.3 184 100.0

Maranhão 132 60.8 13 6.0 23 10.6 49 22.6 217 100.0

Paraíba 186 83.4 7 3.1 5 2.2 25 11.2 223 100.0

Pernambuco 117 63.2 3 1.6 14 7.6 51 27.6 185 100.0 Piauí 176 79.3 11 5.0 11 5.0 24 10.8 222 100.0

Rio Grande do Norte 91 54.5 10 6.0 16 9.6 50 29.9 167 100.0

Sergipe 67 89.3 4 5.3 0 0.0 4 5.3 75 100.0

Northeast 1348 75.2 91 5.1 79 4.4 274 15.3 1792 100.0 Year 2002

Alagoas 88 86.3 5 4.9 0 0.0 9 8.8 102 100.0

Bahia 293 70.3 14 3.4 7 1.7 103 24.7 417 100.0

Ceará 100 54.3 15 8.2 19 10.3 50 27.2 184 100.0 Maranhão 125 57.6 21 9.7 15 6.9 56 25.8 217 100.0

Paraíba 183 82.1 4 1.8 2 0.9 34 15.2 223 100.0

Pernambuco 124 67.0 7 3.8 9 4.9 45 24.3 185 100.0

Piauí 166 74.8 13 5.9 8 3.6 35 15.8 222 100.0 Rio Grande do Norte 65 38.9 2 1.2 17 10.2 83 49.7 167 100.0

Sergipe 68 90.7 5 6.7 0 0.0 2 2.7 75 100.0

Northeast 1212 67.6 86 4.8 77 4.3 417 23.3 1792 100.0

Ano 2003

Alagoas 63 61.8 7 6.9 6 5.9 26 25.5 102 100.0

Bahia 246 59.0 42 10.1 18 4.3 111 26.6 417 100.0

Ceará 93 50.5 17 9.2 12 6.5 62 33.7 184 100.0

Maranhão 122 56.2 17 7.8 17 7.8 61 28.1 217 100.0 Paraíba 158 70.9 4 1.8 9 4.0 52 23.3 223 100.0

Pernambuco 100 54.1 6 3.2 13 7.0 66 35.7 185 100.0

Piauí 160 72.1 13 5.9 5 2.3 44 19.8 222 100.0

Rio Grande do Norte 108 64.7 6 3.6 8 4.8 45 26.9 167 100.0 Sergipe 60 80.0 6 8.0 0 0.0 9 12.0 75 100.0

(8)

going sputum examination: 12.8%, 17.7% and 20.4% for 2001, 2002 and 2003, respectively.

Figure 3 shows the proportion of pulmonary TB cases with positive smear and information about the end of the

Table 8. Frequency of districts in the Southeast according to the classifi cation of tuberculosis surveillance and burden of the disease. 2001-2003.

State/Region

Classifi cation of the epidemiological situation and quality of tuberculosis surveillance

GI GII GIII GIV Total

N % N % N % N % N %

Year 2001

Espírito Santo 61 78.2 9 11.5 0 0.0 8 10.3 78 100.0

Minas Gerais 846 99.2 0 0.0 0 0.0 7 0.8 853 100.0

Rio de Janeiro 21 22.8 16 17.4 30 32.6 25 27.2 92 100.0

São Paulo 497 77.1 50 7.8 38 5.9 60 9.3 645 100.0 Southeast 1425 85.4 75 4.5 68 4.1 100 6.0 1668 100.0

Year 2002

Espírito Santo 58 74.4 8 10.3 1 1.3 11 14.1 78 100.0

Minas Gerais 693 81.2 59 6.9 19 2.2 82 9.6 853 100.0 Rio de Janeiro 31 33.7 28 30.4 17 18.5 16 17.4 92 100.0

São Paulo 447 69.3 43 6.7 43 6.7 112 17.4 645 100.0

Southeast 1229 73.7 138 8.3 80 4.8 221 13.2 1668 100.0

Year 2003

Espírito Santo 54 69.2 6 7.7 3 3.8 15 19.2 78 100.0

Minas Gerais 646 75.7 49 5.7 29 3.4 129 15.1 853 100.0

Rio de Janeiro 16 17.4 12 13.0 28 30.4 36 39.1 92 100.0

São Paulo 314 48.7 20 3.1 64 9.9 247 38.3 645 100.0 Southeast 1030 61.8 87 5.2 124 7.4 427 25.6 1668 100.0

Table 9. Frequency of districts in the South according to the classifi cation of tuberculosis surveillance and burden of the di-sease. 2001-2003.

State/Region

Classifi cation of the epidemiological situation and quality of tuberculosis surveillance

GI GII GIII GIV Total

N % N % N % N % N %

Year 2001

Paraná 337 84.5 17 4.3 7 1.8 38 9.5 399 100.0

Rio Grande do Sul 409 82.3 22 4.4 13 2.6 53 10.7 497 100.0

Santa Catarina 265 90.4 2 0.7 4 1.4 22 7.5 293 100.0 South 1011 85.0 41 3.4 24 2.0 113 9.5 1189 100.0

Year 2002

Paraná 319 79.9 16 4.0 12 3.0 52 13.0 399 100.0

Rio Grande do Sul 442 88.9 31 6.2 5 1.0 19 3.8 497 100.0 Santa Catarina 269 91.8 7 2.4 5 1.7 12 4.1 293 100.0

South 1030 86.6 54 4.5 22 1.9 83 7.0 1189 100.0

Year 2003

Paraná 338 84.7 20 5.0 11 2.8 30 7.5 399 100.0 Rio Grande do Sul 428 86.1 34 6.8 8 1.6 27 5.4 497 100.0

Santa Catarina 266 90.8 11 3.8 1 0.3 15 5.1 293 100.0

(9)

treatment. It is possible to observe that many districts did not record the conditions in the end of the treatment, in 9.9% of the district in 2001, and another 35% in 2003. The assumption is that this increasing frequency of districts reveals the poor capacity of following-up patients undergoing treatment in the health unities.

A general assessment of all aspects of quality of sur-veillance enables a summary of TB control in Brazil, presented in Table 5. In this table the number of districts is classifi ed into the four groups, according to levels of surveillance and TB severity. The frequency of districts classifi ed in group II and IV (poorer quality of surveillance) increased from 2001 to 2003. At the same time, the number of cities with good surveillance and regular level of incidence decreased.

The trends were different among the regions: while North, Northeast, and Southeast worsened, the South improved and the Midwest kept similar conditions in the period.

The States of Amazonas, Pará, and Amapá presented more districts in the group of poor quality of surveillan-ce (groups III and IV) than the other states in the North. Lower frequency of districts with low disease burden and good surveillance was observed in the Amazonas, with high incidence rate. The states of this region pre-sented the worst conditions of TB control with little

more than half (62% in 2001 and 53% in 2003) of the districts in group I. The state of Tocantins presented the best surveillance performance and a reduced number of cases (Table 6).

In the Northeast, the states with greater disease burden were also those which presented poorer quality of surveillance: Pernambuco, Ceará, Bahia, Maranhão, and Rio Grande do Norte. On the other hand, Sergipe presented most of the districts classifi ed as group I, with good level of surveillance and regular incidence rate (Table 7).

The States of the Southeast region presented decrease in the capacity of surveillance and probably in TB control. In Rio de Janeiro, high incidence rates of the disease with low capacity to capture cases and poor quality of data reporting and follow-up of reported cases. The State of Espírito Santo was the one that reduced less its quality of TB surveillance in the Southeast (Table 8).

In the South a clear trend of worsening TB surveillance was not seen. The State of Rio Grande do Sul presented the less suitable conditions, and Santa Catarina presen-ted the best situation (Table 9).

Similar to the South, the Midwest also has states with good levels of TB surveillance. However, the regional levels of the indicators were infl uenced by Mato Grosso

Table 10. Frequency of districts in the Midwest according to the classifi cation of tuberculosis surveillance and burden of the disease. 2001-2003.

State/Region

Classifi cation of the epidemiological situation and quality of tuberculosis surveillance

GI GII GIII GIV Total

N % N % N % N % N %

Year 2001

Distrito Federal 1 100.0 0 0.0 0 0.0 0 0.0 1 100.0

Goiás 225 91.5 7 2.8 2 0.8 12 4.9 246 100.0 Mato Grosso do Sul 56 72.7 8 10.4 4 5.2 9 11.7 77 100.0

Mato Grosso 98 70.5 32 23.0 4 2.9 5 3.6 139 100.0

Midwest 380 82.1 47 10.2 10 2.2 26 5.6 463 100.0

Year 2002

Distrito Federal 1 100.0 0 0.0 0 0.0 0 0.0 1 100.0

Goiás 207 84.1 7 2.8 8 3.3 24 9.8 246 100.0

Mato Grosso do Sul 50 64.9 15 19.5 3 3.9 9 11.7 77 100.0

Mato Grosso 105 75.5 29 20.9 2 1.4 3 2.2 139 100.0 Midwest 363 78.4 51 11.0 13 2.8 36 7.8 463 100.0

Year 2003

Distrito Federal 1 100.0 0 0.0 0 0.0 0 0.0 1 100.0

Goiás 217 88.2 10 4.1 2 0.8 17 6.9 246 100.0 Mato Grosso do Sul 49 63.6 14 18.2 2 2.6 12 15.6 77 100.0

Mato Grosso 113 81.3 16 11.5 4 2.9 6 4.3 139 100.0

(10)

do Sul. In this state, lower frequencies of districts in group I, and greater frequency of districts in groups III and IV were observed. In Distrito Federal the best levels of surveillance and disease control were observed (Table 10).

DISCUSSION

Approximately one third of the Brazilian districts presented poor conditions of TB surveillance. In 2003, one in each four districts presented poor capacity to capture new TB cases or to record properly notifi cation and follow-up data.

This is not a homogeneous picture in Brazil, and the regions with more cases of the disease presented several districts with apparently poor control actions. This may indicate the presence of important areas with underre-porting of TB and poor performance of state programs to control the disease.

The profi le designed by the present study indicates that the more critical situation was concentrated in the states of the North, Northeast, and Southeast regions, where there are more TB cases in Brazil. However, other states with less increased reporting had many districts classifi ed as low level of surveillance such as Maranhão. The development of TB control actions more intensively by the teams of family health in Paraíba, Sergipe, and Alagoas explains the different situation of these states. In the other states, a low level of surveillance was observed.

The best situations observed in the South and Midwest regions are expected, since these states have reached more suitable levels of TB control. However, the state of Mato Grosso did not present quality in TB sur-veillance compared to the other states of the region. A plausible explanation for what occurs in Mato Grosso – and possibly in the other states of the North region – is that a great number of affl icted people are indigenous people, and that surveillance in this population is known to be more diffi cult than in the general population. Classifi cation (or stratifi cation) of the districts enabled to reveal those which should be more carefully assessed. The districts with low TB notifi cation and evidence of poor quality of surveillance may have high disease burden and still be “quiet”, preventing being acknow-ledge as a priority.

Studies on the assessment of TB surveillance in Brazil that could be compared with our outcomes have not been found. However, some assumptions have been made from the assessment of the epidemiological behavior of TB. The fi rst is: if TB is determined by poor socioeconomic conditions, it is expected that the low level of surveillance would be an explanation for the

absence of cases reported in some Brazilian districts. Figure 3. of ending of pulmonary cases. Brazil, 2001-2003 (A-C). Classifi cation of districts, according to information 0

100 200 300 400

0 100 200 300 400

0 100 200 300 400

0 20 40 60 80 100

0 20 40 60 80 100

0 20 40 60 80 100

2001 A

2002 B

TB i

n

cide

nce rate (all sites), 2003

2003 C

Proportion of smear positive pulmonary cases with information on termination

2003 C

Proportion of smear positive pulmonary cases with information on termination

Proportion of smear positive pulmonary cases with information on termination

TB i

ncide

nce rate (all sites), 2002

TB i

ncide

(11)

Another assumption is that, if the spatial distribution of TB is according to the distribution of its determinants in the space, the existence of places free from the disease in areas where a high rate is expected is not justifi ed. The low level of surveillance justifi es this fact. The approach used in the present study is an attempt to know the level of TB control in the districts, but some limitations must be considered. The fi rst is the use of data available in the system of TB information, rather than a fi eld investigation that included the observation of local conditions of TB surveillance in the districts. As previously mentioned, data were not extracted from charts that could distinguish failure to perform surveillance procedures, from failure to record on report forms, and follow-up. The second limitation refers to the arbitrariness of the cut-off points used in the criteria to classify districts. The third refers to the complete underreporting, that is, absence of report, making it impossible to calculate the quality of data indicators.

In this case, the absence of problems with the quality of these data was assumed. Last, the use of spatial smoothing tried to minimize severe underreporting, enabling to recognize high and low rate situations, and different levels of quality of epidemiological TB surveillance. Although the classifi cation of the district does not change when spatially smoothened rates were used, evidences of spatial dependence of TB suggest that some level of underreporting has been corrected.

Consistency of the outcomes may be confi rmed by the agreement between the levels of capture of cases and the quality of data in the studied districts, these aspects formed the assessment of the quality of surveillance.

To conclude with, the outcomes of the present study enabled to stratify the Brazilian districts according to their quality of surveillance. This classifi cation may help building control strategies in areas that have not been seen as priority, such as the improvement of surveillance actions.

1. Assunção RM, Barreto SM, Guerra HL, Sakurai E. Mapas de taxas epidemiológicas: uma abordagem Bayesiana. Cad Saude Publica. 1998;14(4):712-23.

2. Bailey TC, Gatrell AC. Interactive spatial data analysis. Essex: Longman Scientifi c & Technical; 1995.

3. Raviglione MC, Snider Jr DE, Kochi A. Global epidemiology of tuberculosis. Morbidity and mortality of a worldwide epidemic. JAMA. 1995;273(3):220-6.

4. Ruffi no-Netto A, Souza AMAF. Reforma do setor saúde e controle da tuberculose no Brasil. Inf. epidemiol. SUS. 1999;8(4):35-51.

Imagem

Table 1. Indicators of quality of detection and follow-up of cases.
Table 5. Distribution of districts according to the classifi cation of tuberculosis surveillance and burden of the disease
Table 6. Frequency of districts in the North according to classifi cation of tuberculosis surveillance and burden of the disease
Figure 2. Classifi cation of districts, according to sputum  examination of pulmonary cases
+4

Referências

Documentos relacionados

Os diretórios de empresas são bases de dados de empresas com um papel bastante importante, tanto no âmbito de prospeção de mercado como na divulgação da empresa. São

assessed the impact of measures such as the use of surveillance cultures for the early identiication of new cases and the implementation of contact precautions for patients

The expansion of epidemiologic surveillance activities, in addition to acute cases of Chagas disease, integrating cases of the disease in the chronic phase, has to be

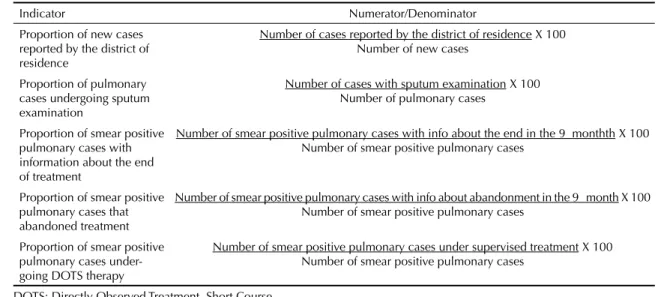
Chart 1 – Dimensions and indicators of assessment of the care produced to tuberculosis cases in Primary Health Care according to the elements of the adapted Chronic Care Model –

[r]

AVR - Vascular surgeon and coordinator chief, Serviço de Cirurgia Vascular e Endovascular, Pontifícia Universidade Católica do Rio de Janeiro (PUC-Rio); Scientific director,

The current study set out to explore the views of ostomy patients (colorectal cancer survivors) regarding concepts and cognitions on health and illness, aiming to answer the

Ao longo dos anos, a Mega Sena fez vários premiados, mas percebe-se também (de acordo com o site da Caixa Econômica Federal) que muitos sorteios acabaram sem vencedor(es) e,