Alan R. Himnan
Systems for the surveillance of communicable diseases either exist or are being develofied in most parts of the world. The @?-pose of this paper is to describe methods for making the best possible use of the information obtained.
The Reliability of Surveillance Data
The first issue to deal with when considering the handling of surveillance data (particularly morbidity data) reported by physicians is whether or not the data are reliable, since in most places not all physicians report. Furthermore, those re- porting do not necessarily constitute a re- presentative sample of physicians in the community, and they do not necessarily report every case they see. In some coun- tries, only those physicians involved in government services are expected to report; and it may be argued that this circumstance is another factor mitigating against use of the data.
It is my belief, however, that morbidity data are indeed usable and useful, even in the face of underreporting. Of course, one must be careful not to over-analyze these
‘Condensed version of a paper presented at the Regional Seminar on Systems of Epidemiologic Sur- veillance of Communicable Diseases Including Zo- onoses held at Rio de Janeiro, Brazil, on 3-8 Decem- ber 1973.
2Formerly Assistant Commissioner, New York State Department of Health, Albany, New York, U.S.A. Present address: Immunization Division, Center for Disease Control, Atlanta, Georgia SO333, U.S.A.
data or to place too great a reliance on small changes.
One way of indicating whether morbidity data are reflecting true occurrences is to verify the trends shown by observation. This can be accomplished in a variety of ways, one of the simplest being to ask practi- tioners how the current level of a given illness compares to its level in previous seasons or previous years. Or, in the case of diseases requiring hospitalization, hospital records can be used to show incidence trends.
Further insight into the reliability of morbidity data as indicators can be gained by comparing them to data provided by other reporting mechanisms. For example, one might compare the reported incidence of tuberculosis with reported deaths caused by this disease. (Death reporting, done through a separate mechanism, is generally felt to give a reasonable reflection of reality.) Such a comparison in New York State revealed that in the past there has been good agreement between these two types of reports. That is, the ratio of the reported death rate to the reported case incidence remained generally constant until the intro-
Hinman l SURVEILLANCE INFORMATION 339
duction of effective chemotherapeutic agents in the late 1940’s, when it began to show a steady decline.
One can also make direct comparisons between the reporting of a disease and the “real” occurrence of that disease. For example, in Israel a comparison was made between cases of viral hepatitis reported by physicians in private practice and the recorded incidence of the disease in a popu- lation covered by an insurance plan which required recording the diagnosis of each illness resulting in a physician visit (1). This study showed that although the report- ing by private physicians was only about 37.4 per cent complete, the distribution of reported cases by season and age closely paralleled that recorded for the insured population. The country’s private physi- cians were then contacted every two weeks and asked whether or not they had seen any cases of viral hepatitis. This active can- vassing raised the number of cases reported, resulting in a reporting level thought to be 96 per cent complete (in terms of compari- son with the insurance data). The seasonal and age trends obtained with this active sur- veillance technique also paralleled those indicated by the insurance data.
Another relevant study was a nationwide survey of venereal disease reporting carried out by the American Social Health Associa- tion and the U.S. Center for Disease Control. The survey, first conducted in 1963, was repeated in 1968 with similar results (2). In this study, all U.S. physicians were asked to state the number of infectious syphilis and gonorrhea cases they had actually treated over the preceding three months. The numbers obtained were then compared to the number of reports which had been received by health departments during the same period. The 1968 study showed that the physicians had reported only 18.7 per cent of the infectious syphilis cases and 16.9 per cent of the gonorrhea cases that they had treated.
A study with a somewhat different focus was conducted in Upstate New York (New York State exclusive of New York City) in 1971 (3). This focused on the specialties of physicians who reported particular disease conditions. For example, only 0.63 per cent of the state’s licensed physicians had re- ported one or more measles cases in 1971. Although this could have reflected growing control over the disease, such an explana- tion seemed unlikely. Since many specialists (psychiatrists, orthopedic surgeons, etc.) would not be expected to see measles, an analysis was made in terms of the cases re- ported by physicians in different specialties. This showed that only 3.2 per cent of the pediatricians had reported one or more measles cases that year. It is clear that a much higher percentage of pediatricians actually saw measles, but what that per- centage was is not truly known.
This same study also analyzed the data provided by physicians reporting cases of gonorrhea, a disease which is epidemic in New York. This analysis showed that the following percentages of physicians re- ported one or more cases of gonorrhea in 1971: 25.0 per cent of the public health physicians, 21.1 per cent of the obstetrician- gynecologists, 17.7 per cent of the general practitioners, 13.8 per cent of the urologists, and 8.83 per cent of all physicians. Although these data do not indicate the true incidence of measles and gonorrhea, they do give some indication of the great need to educate physicians about the purposes of reporting.
Morbidity Reports
reporting level concerned. For example, at the city, county, or district level, the pa- tient’s exact address may be needed, but at higher levels the relevant political subdivi- sion should suffice. Additional information that can prove extremely useful at times in- cludes the patient’s marital status, whether or not the patient was pregnant, whether or not the patient was hospitalized, his or her race and/or socioeconomic status, and the outcome of the case.
Data Collection
The ten commonly accepted elements of data collection (4) are as follows:
1)
2)3) 4) 5)
6)
7)
8)
9)
10)
Mortality registration Morbidity reporting Epidemic reporting
Epidemic field investigations Laboratory investigations Individual case investigations Epidemiologic surveys
Animal reservoir and vector distribu- tion studies
Data on utilization of drugs and bio- logicals
Demographic and environmental data
The first two of these have already been discussed, and the next two are specifically applicable to epidemic situations. The remaining six, however, are applicable to a wide range of situations, and a brief descrip- tion of these would seem appropriate.
Laboratory Investigations
This is naturally a very important part of surveillance, and the data obtained can be of very great benefit. For example, the salmonella surveillance system in theunited States is based almost exclusively on labora- tory reporting of salmonella isolations. As might be expected, most of the isolates are
Salmonella typhimurium, followed by Sal-
monella enteritidis and Salmonella new- port. Nevetheless, some of the most im- portant findings are those involving infre- quently observed serotypes rather than common ones. In 1965-1966, for instance, U.S. laboratories reported 29 isolates of an extremely rare serotype, Salmonella new
brunswick, from 17 states throughout the country. Further information was obtained about each person from whom the organism was isolated. Investigation revealed that nearly one-half of those affected were children under the age of one year. Further investigation revealed that the illness re- sulted from ingestion of contaminated non- fat dried milk. As a result of this investiga- tion, a very detailed survey was made of dried milk processing procedures, and some basic nationwide changes in
techniques were introduced (5).
processing
Individual Case Investigations
Efiidemiologic Surveys
Surveys are also an important element of surveillance, malariometric surveys being a classic example. Other types of surveys may not involve direct contact between the patient and the surveyor. For example, New York State has a law requiring all children entering school for the first time to be protected against polio, measles, rubella, and diphtheria. In 1972, a survey of all the state’s elementary schools showed, as might be expected, that immunization was incom- plete. In fact, on a statewide basis only 83 to 87 per cent of the entering students were immunized against any given disease, and there was great variation from place to place. This survey enabled corrective action to be undertaken.
Reservoir and Vector Studies
Studies of reservoirs and vectors are obvi- ously important in planning vector control measures. This applies especially to the planning of intermittent control measures- such as adulticiding-for areas of arbovirus activity where source reduction techniques are not used.
Data on Utilization of Drugs and
Biologicah
These data may frequently supplement or take the place of information which might be more difficult to gather from other sources. For instance, knowledge about the distribution of a particular vaccine can give
Hinman l SURVEILLANCE INFORMATION 341
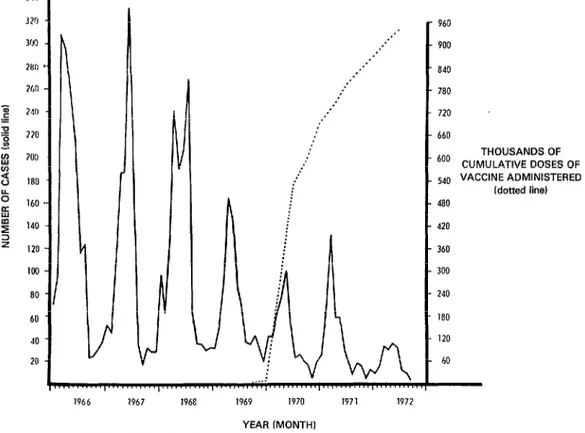
Figure 1. Reported incidence of rubella and cumulative rubella vaccine use in New York State, exclusive of New York City, 1966-1972.
, , , , ,
1966 1967 1968 1969 1970 1971 1972
YEAR (MONTH1
960
900
840
780
720
660
THOUSANDSOF
‘O” CUMULATIVE DOSES OF
540 VACCINE ADMINISTERED
Idotted line)
480
420
360
300
240
180
120
a rough idea of the population’s immune status, although it does not tell what age groups have been immunized or how much of the distributed vaccine has been used. Data on the actual administration of vaccines can be much more helpful in this regard, and can be correlated with the re- ported incidence of disease. For example, Figure 1 correlates the use of rubella vaccine with the incidence of rubella in Upstate New York. As might be expected, the number of cases reported has declined with increasing vaccine use.
Demografihic and Environmental Data
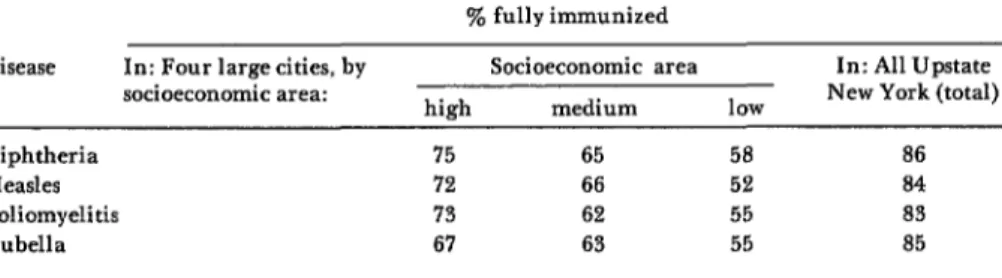
These play an essential role in defining the populations from which surveillance data are received. We have used one demo- graphic variable (socioeconomic status) in showing the immunity level of children entering New York State schools in several cities in 1972. These data, contained in Table 1, clearly indicate a need to improve immunization activities in areas with low socioeconomic levels in order to protect children against these preventable diseases.
Environmental data are particularly important when dealing with vector-borne diseases but may also be relevant in other
settings, e.g., when a sudden spell of cold weather leads to crowding indoors.
Use and Dissemination of Surveillance Data
The primary purpose of surveillance data, as regards communicable diseases, is to provide a basis for action-either imme- diate remedial action or longer-term action performed by ongoing preventive programs. This refers not only to action by govern- ment agencies, but also to action within the private sector.
Clearly, mere collection of surveillance data is useless. Such data, once collected, must be analyzed and used to plan action. All too frequently, the information ob- tained is allowed to gather dust in some corner of a statistical clerk’s office, leaving those responsible for establishing priorities in communicable disease control and other health programs unaware of the true situa- tion. To prevent this, it is the duty of the communicable disease epidemiologist to thoroughly analyze surveillance data and to make sure that each policy-maker involved is aware of their significance.
In this same vein, the information ob- tained through surveillance should be dis- seminated as widely as possible, consistent with practicality. It is absolutely essential that those who submit reports receive some indication that those reports are being seen. The most direct way to ensure this is to follow up on reported cases. For instance,
Table 1. Percentages of fully immunized children among school entrants in Upstate New York and in four large cities* by socioeconomic area. September 1972.
y0 fully immunized Disease In: Four large cities, by
socioeconomic area:
Socioeconomic area In: All Upstate
hiEh medium low New York (total)
Diphtheria 75 65 58 86
Measles 72 66 52 84
Poliomyelitis 73 62 55 83
Rubella 67 63 55 85
Hinman l SURVEILLANCE INFORMATION 343
health department investigation of a case reported by a physician is concrete proof to the physician that his reports are important. As a side-benefit, the investigation thus becomes a very valuable means of retaining his collaboration. Obviously, however, not all disease cases could be investigated. For this reason, it is important that the reporting source receive at least some sort of minimal, less individualized form of feed- back.
In Upstate New York, a monthly com- municable disease newsletter is sent to all licensed physicians as well as to radio and television stations, newspapers, and any other interested parties. This newsletter, patterned after the Center for Disease Con- trol’s MOT bidity and Mortality Weekly Re@ort, contains a table summarizing the
number of cases of different diseases reported during the current month; it also shows the cases reported during the year to date and compares those figures with the preceding year’s experience. There is also a narrative section which discusses vaccine recommendations, treatment recommenda- tions, recent disease outbreaks, recent devel-
opments in communicable disease control, etc. As the State Health Department is not a
federal agency and does not have franked
postage, the cost of this newsletter is signifi- cant. However, during the first two years of
the newsletter’s existence the number of
physicians who reported cases of communi-
cable disease to the health department in- creased by more than 25 per cent. The results thus appear to far outweigh the requisite expense.
SUMMARY
Surveillance data lay the groundwork for advantage. This article provides a basic review of effective large-scale health actions. Sometimes, these three problems and ways to approach them, however, it is hard to obtain surveillance data, to drawing illustrative examples from various determine the reliability of collected data, or to sources, including the author’s own experience. ensure that the data will be used to maximum
REFERENCES
(I) Brachott, D., and J. W. Mosley. Viral hepatitis in Israel: The effect of canvassing phy- sicians and the apparent epidemiological pat- tern. Bull WHO: 457-464, 1972.
(2) Fleming, W. L., J. W. Brown, J. F. Donohue, et al. National survey of venereal dis- ease treated by physicians in 1968. JAMA 211:
1827-1830, 1970.
(3) Hinman, A. R. Re#orfing of Communicu-
ble Diseases. Paper presented at the 100th annual meeting of the American Public Health Associa-
tion held at Atlantic City, New Jersey, on 15 November 1972.
(4) World Health Organization. National and
Global Surveillance of Communicable Diseases.
WHO Working Document ESR/67.9, prepared for technical discussions at the Twenty-first World Health Assembly. Geneva, 1967.