Introduction
Azide and thiocyanate complexes of sever-al metsever-allic cations have been systematicsever-ally studied in our laboratories with a view to understanding their coordination chemistry (equilibria) [1-3] and developing their analytical applications [4-12]. There is great analogy between the azide and the thiocyanate ligands (pseudohalides), since they develop the same red color in acid solution con-taining iron(III). Some of our studies have been of a comparative character, showing that the azide system is much more stable than the thiocyanate one. As part of these continuous investigations, it is expected that chromium(III) will form complexes with the pseudohalide azide in the same way that other transition metals such as iron, copper, nickel, and cobalt.
In the literature, studies carried out by Sherif and Orab [13,14] in aqueous medium using the visible region revealed the existence of a rela-tionship between the several free ligand (azide) and chromium(III) concentrations with absor-bance, producing colorings ranging from violet to green. Moreover, the solution was reported to develop blue tones under great ligand excess. In the work of Templeton & King [15], the effect of perchloric acid concentration on the formation of pentaaquoazidochromium(III) compounds was also reported. The main objective of the latter work was to determine the kinetics and equilibri-um of this system. The authors reported maximequilibri-um absorption at 270 nm, under highly acid concen-trations, which was attributed to interactions between azidochromium(III) and/or hydrogen azi-dochromium(III) and the perchlorate ion. The
www.scielo.br/eq
Volume 31, número 4, 2006
Spectrophotometric study of the chromium(III)/azide system
in the ultraviolet region and its analytical application
*L. M. Lourenço, F. G. Martins, V. R. Balbo, A. C. Pimenta, J. R. M. Castro, J. F. Andrade
Departamento de Química, Faculdade de Filosofia, Ciências e Letras de Ribeirão Preto - USP, Av. Bandeirantes, 3900 (Campus da USP),14040-901, Ribeirão Preto , SP, Brazil.
Abstract: A sensitive and alternative method for the spectrophotometric determination of
chromium(III) based on the formation of chromium(III)/azide complexes was established by investigating a new band in the ultraviolet region. The best experimental conditions for the analytical determination of this metallic ion were: ligand and perchloric acid analytical concentration = 493 and 12.0 mmol L-1, respectively; aqueous medium; T = 25.0 ºC; contact time = 1 hour. The maximum
molar absorptivity coefficient occurred at 287 nm (average 1.481 ± 0.008 ×10⁴L mol-1cm-1), leading
to the determination of metal ion concentrations one hundred times lower than the ones formerly determined in the visible region. The system obeys Beer’s Law and is suitable for chromium determination in the 0.702-2.81 mg L-1concentration range (15-65% T, 1.00 cm-width quartz cells).
Analytical applications of the current method were tested with a nutritional supplement containing chromium. Results were compared with those obtained with atomic absorption spectrometry.
results of a quantitative treatment in the ultraviolet region obtained by these authors were unsuccess-ful. Ever since, this region of the spectrum has been abandoned for investigation of the chromi-um(III)/azide system.
In the present work, optimization of the experimental conditions for the study of the chromium(III)/azide system in the ultraviolet region has been accomplished. The quantification of this metal ion complex considering its maxi-mum absorption in the ultraviolet region has also been carried out in real samples.
The proposed method was tested for a nutritional supplement sample, showing good agreement with results obtained by means of atom-ic absorption spectroscopy.
Experimental details
Apparatus and reagents
Spectrophotometric measurements were accomplished on a UV-Visible Beckman DU-70 spectrophotometer, using a quartz cell of 1.00 cm path length. A Shimadzu AA-680 atomic absorp-tion spectrophotometer was used for reference analyses, in order to compare the results obtained through both methods.
Potentiometric titrations were accom-plished on a Micronal B-374 pHmeter, using 5.00 mL Metrohm piston burets. A Tecnal TE-184 ther-mostatic bath was used for studies on temperature effect, as well as to control the temperature after the establishment of the ideal conditions. For treat-ment of the analyzed samples, a Corning PC-320 hotplate was employed.
Deionized water (with conductivity inferior to 1µS) was used in the preparation of all samples and solutions. All reagents were of analytical puri-ty grade.
The sodium azide solution (3.52 mol L-1)
was standardized by potentiometric titration with silver nitrate, using a combined electrode (reference electrode Ag/AgCl and silver wire as indicator). Perchloric acid (0.302 mol L-1) was
potentiometri-cally standardized with a standardized solution of sodium hydroxide, which had been previously adjusted with phthalate potassium acid. The chromi-um(III) perchlorate solution (2.023 mmol L-1, pH ≅
1) was acidified with perchloric acid and was stan-dardized by means of the spectrophotometric method of chromium in steel determination using potassium dichromate salt purchased from Merck. The standardization measurements were accom-plished at 438 nm. AR grade organic solvents (Acetone – Merck (ACS, ISO); Tetrahydrofuran – Merck (ACS); 1-Propanol Vetec; Ethanol – Merck; Methanol – Merck; Acetonitrile – Vetec) were used without any prior treatment. For the opening of the nutritional supplement samples, nitric acid 65% Merck and Perchloric acid 70% Merck were used. The sodium tartrate employed was PA grade and it was purchased from Carlo Erba.
All the saline solutions, generally used as their respective nitrates or sodium salts, for the interference study were prepared in the concentra-tion of 0.20 mol L-1, and diluted as appropriate.
Treatment of nutritional supplement samples A nutritional supplement sample containing chromium was tested. It was purchased at drug-stores in its commercially available pure salt form. The sample was manufactured by Albion®
Laboratories, and Cromo Chelavite®´s was its trade
name (Chromium Dinicotinate Glycinate), which is also known as chromium chelate.
According to the manufacturing labo-ratories, the amount of chromium present in the nutritional supplement containing chromium chelate was 2.5% in mass.
The mass of the samples were weighed using an analytical balance and it had been previ-ously established so as to obtain a chromium con-centration of approximately 1.0 mmol L-1in a
vol-umetric flask of 100 mL after suitable treatment. The procedure was accomplished inside an exhaustion chapel. The chapel was cleaned in a way that no other organic reagent, paper, rubber, or any other substances incompatible with perchloric acid were present.
loss, and it was performed until the release of dense smoke was observed. At this point, the temperature of the heating plate was immediately decreased so that mild boiling was obtained. This was done to avoid the release of steam for as long as 5 minutes, ensuring chromium oxidation. The sample was then quantitatively transferred to a 100 mL volu-metric flask and the volume was completed with deionized water. To facilitate understanding, this sample will be called the Supplement Sample Stock. Aliquots of such Supplement Sample Stock were pipetted into 25 mL volumetric flasks. For the preparation of the final sample in these volumetric flasks, chromium(VI) was reduced to chro-mium(III) with the addition of some drops of hydrogen peroxide (5 volumes or less). The excess of this reagent was 1.5 times the quantity necessary to discolor the yellow samples. After complete reduction, sodium hydroxide was slowly added in a predetermined amount under vigorous stirring, so as to neutralize the excess acid.
To determine the exact amount of sodium hydroxide that should be added, an aliquot of the Supplement Sample Stock was taken and hydrogen peroxide was added to it. Next, excess sodium tar-trate was added in the salt form, and the resulting sample was titrated with sodium hydroxide. Knowing the concentration of perchloric acid pres-ent in the Supplempres-ent Sample Stock, the excess acid contained in the pipetted volume was then neutralized in the 25 mL volumetric flask, in a way that the resulting solution contained a concentra-tion of 12.0 mmol L-1of the remaining acid. The
sample that resulted from such sample treatment will be called Treated Supplement from this point. After such treatment, the ligand still had to be added at an ideal concentration, temperature, and contact (reaction) time so that the flask could finally be filled to the mark.
The presence of sodium tartrate throughout the titration was necessary to avoid formation of chromium(III) hydroxide, which could affect the alkalimetric titration.
Results and Discussion
Several factors such as acidity, ligand con-centration, temperature, and contact time affect the
formation of the complex species (absorbance val-ues) in the case of the chromium(III)/azide system. Under the best acid and ligand concentrations, the maximum absorption occurs at 287 nm, being this band more sensitive than the visible one located between 400 and 700 nm, which was used in the work of Sherif and Orab [14]. It has also been noticed [16] that, although the azide ligand also absorbs in the ultraviolet region, such absorption is limited to areas around 230 nm (under the pres-ent conditions). The absorption of azide at 287 nm is weak, thus allowing spectrophotometric meas-urements for the chromium(III)/azide system at low concentrations in the ultraviolet region.
Measurements at 287 nm were only carried out in this work after optimization of the condi-tions previously used by Sherif [13] in the visible region, when factors such as acidity, ligand con-centration, nature and concentration of solvent, temperature and contact time were investigated too. After this optimization [16], it was possible to notice that the same conditions considered ideal in the visible region could be employed in the ultra-violet region, leading to the determination of metal ion concentrations a hundred times lower than the ones determined in the former region.
One of the first problems faced with this system concerned the strong turbidity observed upon metal (chromium) addition to the ligand (azide). This happens probably due to metal hydrolysis or to the insolubility of the formed species. Perchloric acid was thus added to the samples to overcome this problem, because it has low coordination ability, offering no competition to the azide ligand. Because HN3 is a weak acid
(pKa = 4.65) [17], it was assumed that all the
added HClO4 led to the formation of hydrazoic
acid. In this way, the free ligand concentration, [N3-], was approximately equal to the analytical
concentration of the added ligand, CN3- , minus
the concentration of added perchloric acid. Fig.1 shows the effect of acidity on the spectrum of the system in aqueous medium, at a free ligand concentration of 200 mmol L-1 and
fixed contact time and temperature. Acid concen-trations lower than 10.0 mmol L-1was not used,
allowing the pH to remain below 6.0 for the formed buffer solution (HN3/NaN3). The most
and the acidity condition employed here was 12.0 mmol L-1for practical reasons.
The behavior observed in Fig.1 can be explained by the fact that there was more formation of HN3 (weak acid) at higher acid concentrations
and, consequently, there was lower availability of the free ligand to form the absorbent complexes.
Figure 1. Effect of the acidity on the spectrum of the system (CCr3+ = 3.96 × 10⁻² mmol L-1;
[] = 200 mmol L-1; CHClO
4 mmol L-1= variable: (a)
= 10.0, (b) = 20.0, (c) = 100 and (d) = 200; T = 25.0 ºC; t = 1 hour; Sample = Blank + Metal; Blank = Acid + Ligand).
Initially, a study of the influence of differ-ent solvdiffer-ents (acetone, tetrahydrofuran, methanol, ethanol, and propanol) on the spectrum of the chromium(III)/azide system was carried out for a concentration of 60% (v/v). Generally, the solva-tion effect increased complex formasolva-tion, increas-ing the sensitivity of the spectrophotometric
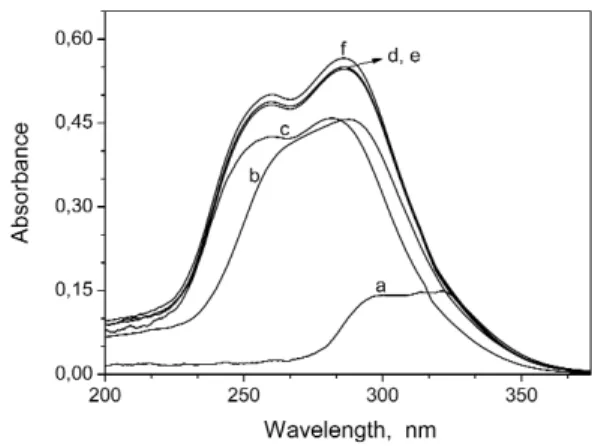
tech-Fig.2 shows the effect of the analytical con-centration of the ligand on the spectrum of the sys-tem at constant chromium(III) concentration and fixed acidity (12.0 mmol L-1). A small
bathochromic effect could be noticed with increas-ing ligand concentration. Azide analytical concen-trations higher than 500 mmol L-1, as seen at
Amaxvalues (maximum absorbance), did not lead to
a significant increase in absorbance, so this limit was fixed. The complete saturation between metal and ligand only happened at ligand concentrations of about 900 mmol L-1, which was considered
excessive. So, the concentration of 500 mmol L-1
was chosen as the most promising one for the accomplishment of the measurements. For analyti-cal simplicity (pipetting), a ligand analytianalyti-cal con-centration of 493 mmol L-1was chosen to continue
the studies.
Figure 2. Effect of the ligand analytical concentra-tion on the spectrum of the system (CCr3+ = 3.96 ×
10-2mmol L-1; T = 25.0 ºC; CHClO
4= 12.0 mmol L -1; CN
3- mmol L-1= variable: (a) = 100, (b) = 200, (c)
= 300, (d) = 400, (e) = 500, (f) = 600, (g) = 900; t = 1 hour; Sample = Blank + Metal; Blank = Acid + Ligand).
Figure 3. Effect of some solvents on the system spec-trum (CCr3+ = 3.96 ×10⁻²mmol L-1; CN3- = 200
mmol L-1; CHClO
4= 12.0 mmol L-1; Csolvent= 60%
nique. Fig. 3 shows the influence of some solvents on the spectrum of the present system, for a ligand analytical concentration of 200 mmol L-1.
At the employed ligand concentration, most of the solvents provided an increase in the absorbance values. Ethanol was the solvent cho-sen to continue the comparative studies between the organic and aqueous medium. It is known that acetone, unlike the other solvents, absorbs strong-ly at wavelengths lower than 320 nm, justifying the high interference and low sign obtained in the spectrum in the presence of this solvent.
In Fig. 4, at a ligand concentration close to that considered ideal in aqueous medium (500 mmol L-1), the presence of ethanol only brought
about a small increase to absorbance values, mak-ing the aqueous medium the most promismak-ing for the accomplishment of the measurements. The use of solvents such as acetone and tetrahydrofuran did not provide the solvatochromic effects for the present chromium(III)/azide system, as observed previously [9-12].
Employing the best conditions of ligand concentration and acidity in aqueous medium (493 mmol L-1and 12.0 mmol L-1respectively), with a
chromium(III) analytical concentration of only
Figure 4. Effect of the ligand analytical concentra-tion on the spectrum of the system in aqueous and organic medium (CCr3+ = 3.96 × 10⁻² mmol L-1;
CHClO4 = 12.0 mmol L-1; T = 25.0 ºC;
t = 1 hour; Sample = Blank + Metal; Blank(aq)= Acid
+ Ligand; Blank(EtOH)= Acid + Solvent + Ligand).
3.96 ×10⁻²mmol L-1, the effect of the temperature
and contact time on the formation of the absorbent complex species was verified (Fig. 5). A tempera-ture of 20 ºC provided slow reaction, but led to higher absorbance values for longer contact times, reaching a constant absorbance value after 2 hours, which is too long. Increasing the tempera-ture enabled the system to reach a stable level faster, although a small decrease in the absorbance value was obtained at higher temperatures. This latter fact can be justified by the loss of the azide ligand in the hydrazoic acid (volatile) form. A con-tact time of 60 minutes at T = 25.0 ºC showed to be the most promising condition for the accom-plishment of the measurements, once at this tem-perature and reaction time, 98.7% of the highest absorbance value was reached.
Figure 5. Effect of the temperature and contact time on the absorption measurements carried out at 287 nm.
The absorbance reached a maximum value after a contact time of 360 minutes (6 hours Table 1).
Using the most promising conditions (acid perchloric analytical concentration = 12.0 mmol L -1, ligand analytical concentration = 493 mmol L-1, T
= 25.0 ºC and contact time = 1 hour), the analytical curve was obtained from 15 samples. The slope of the straight line obtained from the linear regression supplied a mean molar absorptivity coefficient of (1.481 ± 0.008) ×104L mol-1cm-1for the
Considering the ideal range of absorbance values between 0.2 and 0.8, the metal can therefore be determined in the concentration range 0.702 to 2.81 mg L-1at 287 nm, using the experimental
condi-tions above established.
Precision studies were accomplished for 20 samples containing 3.96 × 10⁻² mmol L-1
(2.06 mg L-1) chromium(III). An absorbance of
0.606 ± 0.001 with a confidence limit of 95% was obtained.
For the interference study, cations (used as nitrates) and anions (used as sodium) salts were added separately to the sample and the results of each of them were compared with the control samples. The conditions for both the control sam-ple and that containing the interfering ion of inter-est were identical, except for the fact that the con-trol one did not contain the diverse ion. The pos-sible interfering ion was added to the sample in a way that concentrations of 4.0 mmol L-1, 2.0
mmol L-1, 0.40 mmol L-1, or 0.040 mmol L-1
would be obtained in the volumetric flask. These concentrations are equivalent to approximately 100, 50, 10, and 1 times the amount of chromi-um(III) present in the sample. Respectively, the employed conditions of acidity, ligand concentra-tion, temperature, and contact time were the same as the ones pre-estabished with a chromium(III) concentration of 3.96 ×10⁻²mmol L-1(2.06 mg L -1) measured at 287 nm. Interference was
consid-ered to take place in samples where the error was higher than 5%, considering the real chro-mium(III) concentration. Of the 30 species
stud-ied, F-, Cl-, Br-, NO
3-, IO3-, BrO3-, SCN-, SO42-,
S2O52-, Li+, K+, Mg2+, Ba2+, Zn2+, and NH4+did
not interfere at concentrations that were up to 100 times higher than that of chromium(III). The ions I-, NO
2-, CO32-, HCO3-, and Mn2+did not interfere
at concentrations that were up to 50 times higher than that of chromium(III). The ions OH-, S
2O8
2-, H2PO4-, HPO42-, and Cd2+ did not interfere at
concentrations that were up to 10 times higher than that of chromium(III). The ions HC8H4O4
-and Co2+did not interfere at concentrations equal
to that of chromium(III). Finally, Fe3+, Cu2+, and
Hg2+ were the most interfering ions (E R >5%),
even at concentrations lower than that of chromi-um(III). The Al3+ ion led to sample turbidity, of
thus, making the absorbance measurements impossible.
Table 2 shows the results obtained with the nutritional supplement Cromo Chelavite® using
the spectrophotometric method developed in this work. The results were compared with those obtained by the atomic absorption technique (Standard addition method), with errors lower than 5%, as seen in Table 3. The expected value refers to the chromium(III) concentration according to what is stated in the label of the nutritional sup-plement by the supplier.
conditions as the real sample of the nutritional supplement. The ligand was then added under the ideal conditions of temperature and contact time, and measurements were done at 287 nm. Results are in Table 4.
The validity of the proposed method was thus confirmed, with good recovery of the added chromium concentration value. The obtention of good results with the proposed spectrophotometric method and their agreement with the atomic absorption technique (standard addition) in the case of the nutritional supplement Cromo Chelavite®make it a potential way of determining
chromium in other products.
Conclusions
We have developed an aternative method for the analysis of chromium(III) ions that is high-ly sensitive. This high sensitiveness is due to the use of an interesting absorption band not
previ-ously reported in the literature, for the chromi-um(III)/azide system.
The presence of organic solvents tested in this work did not influence the absorption profile of the chromium(III)/azide system, as had been observed for analogous iron(III)/azide system, mainly in the presence of tetrahydrofu-ran.
Under the best experimental conditions, absorbance of the chromium(III) complexes were measured at 287 nm, where the molar absorptiv-ity was (1.481 ± 0.008) ×104 L mol-1cm-1. The
system obeyed the Beer´s law, and it is suitable for chromium(III) determination over a concen-tration range of 0.702 to 2.81 mg L-1(15-65% T).
For 100% stability to be reached, a contact time of 360 minutes (6 hours) was necessary. Of the 30 species investigated in the interference study, Fe3+, Cu2+, and Hg2+ were the ions that more
interfered on the results.
supplement Cromo Chelavite®. The results were
compared with those from atomic absorption measurements and a very good agrement between these two techniques was obtained.
In conclusion, under ideal conditions and by controlling some possible interference, the proposed method can be precise, accurate and simple.
Acknowledgements
The authors are grateful to the CAPES for financial support and to Cynthia Maria de Campos Prado Manso for linguistic advices.
Recebido em : 11/09/2006. Aceito em: 21/11/2006.
L. M. Lourenço, F. G. Martins, V. R. Balbo, A. C. Pimenta, J. R. M. Castro, J. F. Andrade. Estudo espectrofotométrico do sistema cromo(III)/azoteto na região do ultravioleta e seu aproveita-mento analítico.
Resumo: Um método sensível e alternativo para a determinação espectrofotométrica de cromo(III) foi
proposto. O estudo é baseado na formação dos complexos cromo(III)/azoteto, investigando uma nova banda na região do ultravioleta. As melhores condições experimentais para a determinação analítica deste íon metálico foram: concentração analítica de ligante e ácido perclórico de 493 e 12,0 mmol L-1,
respec-tivamente; meio aquoso, T = 25.0 ºC, tempo de contato = 1 hora. Nessas condições, o máximo de absorção para o sistema cromo(III)/azoteto ocorreu no comprimento de onda de 287 nm, com um coefi-ciente de absortividade molar médio de 1,481 ± 0,008 ×104L mol-1cm-1, permitindo a determinação
deste íon em concentrações cem vezes menores em relação à região do visível. O sistema obedece a lei de Beer e mostra-se adequado para a determinação de cromo na faixa de concentração de 0,702-2,81 mg L-1(15-65% T, em uma cubeta de quartzo de 1,00 cm). Aplicações analíticas para o método proposto
foram testadas em um suplemento nutricional contendo cromo. Os resultados foram comparados com os da técnica de espectrometria de absorção atômica.
Palavras-chave: cromo; azoteto; azida; espectrofotometria; complexos.
References
[1] G. O. Chierice, E. A. Neves, Polyhedron 2 (1983) 31. [2] E. A. Neves, J. F. Andrade, Polyhedron 5 (1986) 717. [3] N. Coichev, E. A. Neves, Polyhedron 8 (1989) 641. [4] J. F. Andrade, O. M. Guimarães, Anal. Chim. Acta 271 (1993) 149.
[5] E. A. Neves, J. F. Andrade, G. O. Chierice, Anal. Lett. 18 (1985) 707.
[6] R. Luca, J. E. Bevilácqua, E. A. Neves, J. F. Andrade, Anal. Lett. 20 (1987) 389.
[7] O. M. Guimarães, J. F. Andrade, E. A. Neves, G. O., Chierice, Anal. Lett. 26 (1993) 2491.
[8] D. R. Carmo, J. F. Andrade, O. M. Guimarães, Anal. Lett. 28 (1995)1897.
[9] C. J. Chacarolli, J. F. Andrade, O. M. Guimarães, V. R. Balbo, C. S. Venezuela, F. S. Teruel, Anal. Chim. Acta 411 (2000) 217.
[10] F. G. Martins, J. F. Andrade, A. C. Pimenta, L. M. Lourenço, J. R. M. Castro, V. R, Balbo, Eclética Química 30 (2005) 63.
[11] A. P. O. Sader, Estudo espectrofotométrico do sistema cobalto (II)/tiocianato e seu aproveitamento analítico. 2002. 91f. Dissertação (Mestrado em Química) - FFCLRP, Universidade de São Paulo, Ribeirão Preto / SP.
[12] A. C. Pimenta, J. F. Andrade, F. G. Martins, L. M. Lourenço. Formação de complexos no sistema ferro(III)/azoteto/tetraidrofurano. 27ª. Reunião Anual da SBQ, Salvador, SBQ, 2004. Resumo QA262.
[13] F. G. Sherif, W. M. Oraby, J. Inorg. Nucl. Chem. 17 (1961) 152.
[14] F. G. Sherif, W. M. Oraby, H. Sadek, J. Inorg. Nucl. Chem. 24 (1962) 1373.
[15] J. C. Templeton, E. L. King, J. Am. Chem. Soc. 93 (1971) 7160.
[16] L. M. Lourenço, Estudo espectrofotométrico do sistema crômio (III)/azoteto e seu aproveitamento analítico. 2003. 95f. Dissertação (Mestrado em Química) - FFCLRP, Universidade de São Paulo, Ribeirão Preto / SP.