The impact of foreign capital on profitability:
the case of Portuguese manufacturing SMEs
Luís Pacheco
Department of Economics and Management, Portucalense University,
Room 201, Rua Dr. António Bernardino de Almeida, 541-619, 4200-072 Porto, Portugal
Email: luisp@upt.pt
Abstract: The objective of this paper is to examine the relationship between the firms’ ownership and control structure, in particular the presence of foreign capital, and its profitability. The relation between profitability and ownership and control structure is a topic less studied in the literature. This paper uses a balanced panel data of 5.722 firms for the period 2010–2017, researching if the presence of foreign capital influences financial performance. Possible nonlinear effects or moderating and interaction roles between variables are also tested. Our results evidence that, despite foreign firms’ higher levels of profitability, the degree of foreign ownership and institutional difference generally showed a non-significant relation with profitability. Nevertheless, there seems to exists a nonlinear relation between the development level of the country of origin of the share capital and profitability, with the results indicating that firms with share capital originated from more advanced countries attain a higher financial performance.
Keywords: ownership structure; profitability; small and medium enterprises; SMEs; manufacturing sector; foreign investment.
Reference to this paper should be made as follows: Pacheco, L. (2020) ‘The impact of foreign capital on profitability: the case of Portuguese manufacturing SMEs’, Int. J. Globalisation and Small Business, Vol. 11, No. 4, pp.391–412.
Biographical notes: Luís Pacheco is a Professor of Economics and Finance at Universidade Portucalense (Porto – Portugal) and Universidade de Aveiro (DEGEIT). He earned his PhD in Economics (Technical University of Lisbon – Portugal), MSc in Monetary and Financial Economics (Higher Institute of Economics and Management – Lisbon, Portugal) and a Degree in Economics (Universidade Portucalense (Porto – Portugal). His research interests include financial economics, SMEs, financial markets and tourism management.
1 Introduction
The increase in international capital flows over the last decades motivated the research about the potential impacts of those flows on firm performance (Gomes and Ramaswamy, 1999; Kotabe et al., 2002). Due to the significance of foreign direct investment (FDI) among the other sources of international flows, this paper follows that
micro perspective focusing on small and medium enterprises (SMEs), rather than the usual macro perspective adopted when studying the impacts of FDI on economic growth.
Joint-ventures (JVs) and wholly foreign-owned firms coexist in Portugal, rendering particularly relevant an analysis of the influence of different degrees of foreign ownership on firm performance. Wholly-owned firms are subsidiaries of a parent firm from another nation, which has full ownership and sole responsibility for the management of the operation. On the other hand, JVs involve a local and or a foreign partner that share the ownership, management, risks and rewards of the newly formed entity. According to INE (2018), there are 6,455 foreign subsidiaries operating in Portugal (1.6% of all non-financial firms), a number reflecting the country’s peripheral nature. The majority of firms are owned by intra-EU firms, are classified as SMEs, have a non-exporting profile, attain productivity levels above average, pay higher wages and are concentrated on the following sectors: commerce, construction and industry.
This paper fulfils a gap in the literature since:
1 distinguishes not only between domestic and foreign-owned firms, but also between wholly and partly foreign-owned firms
2 examines the possible nonlinearity of the ownership-profitability relation
3 uses a set of control variables and tests the presence of moderating and interaction roles between variables.
To the best of our knowledge, with the exception of the paper from Barbosa and Louri (2005), this is the first empirical paper examining the relationship between ownership and control levels of foreign subsidiaries with firm profitability in Portugal. The choice of a national dataset allows us to compare our results with similar studies in other countries (e.g., Dimelis and Louri, 2002; Barbosa and Louri, 2005; Azzam et al., 2013; Gelübcke, 2013). From this comparison we expect to gain some insights into country-specific factors influencing SMEs’ financial performance, which are frequently rooted in the domestic environment (Narayanan, 2015; Stouraitis et al., 2017) and at the same time understand the importance of the performance-promoting channel of FDI, particular when assuming the form of JVs.
The rest of the paper is structured as follows. Section 2 reviews the literature on the relation between foreign ownership and firm financial performance. The section also presents the other determinants of profitability and the hypotheses to be tested in the paper. Section 3 presents the variables, the data and the methodology to be used. Section 4 presents and discusses the empirical results while Section 5 presents the concluding remarks.
2 Literature review
The present paper is focused on the determinants of firm financial performance assessing if that performance is influenced by the presence and magnitude of foreign capital. Firm performance is a multidimensional construct heavily researched in the literature (e.g., Venkatraman and Ramanujam, 1986), but here we are interested on the association of performance with the firm’s ownership and control structure, in particular the effects of foreign ownership on profitability. Modes of entry and equity ownership are key variables in international business research (e.g., Li and Guisinger, 1991; Nitsch et al.,
1996) and the impact of corporate governance on firms’ strategic decision-making and performance has been well documented in the literature (e.g., Shleifer and Vishny, 1986; Demsetz and Villalonga, 2001), mostly for large and listed firms, but the idiosyncrasies of SMEs and the presence of foreign capital associated with different firms’ financial performance has been less studied.
2.1 The characteristics of foreign-owned firms and their impacts on profitability
Foreign-owned subsidiaries possess a set of firm-specific advantages that are not available to domestic firms, such as access to technological, financial and human resources or the ability to exploit economies of scale, that enhance their performance and results (Harris, 2002; Harris and Robinson, 2003; Yudaeva et al., 2003; Caves, 2007; Girma and Görg, 2007; Temouri et al., 2008; Halkos and Tzeremes, 2010).
Despite the generally accepted hypothesis that foreign-owned firms outperform domestic firms, at least in developing or emerging countries, several authors found evidence of little or no superior performance (e.g., Globerman et al., 1994; Griffith, 1999; Konings, 2001; Barbosa and Louri, 2005; Benfratello and Sembenelli, 2006; Huang and Shiu, 2009; Azzam et al., 2013). Domestic firms may possess a better knowledge of the local environment or the necessary connections with political and local authorities. Other authors argued that the divergent results between countries were due to country-specific factors (e.g., Barbosa and Louri, 2005; Gelübcke, 2013).
A large number of papers present the limitation of adopting a simple view, using a dummy variable to distinguish firms between foreign-owned and domestic-owned, not properly analysing the situations in-between, for instance the presence of JVs, with varying degrees of foreign ownership. For instance, when studying different countries and time periods, some authors generally evidenced that firms characterised by different degrees of foreign ownership may perform differently (Blomström and Sjöholm, 1999; Dimelis and Louri, 2002; Greenaway et al., 2014).
Blomström and Sjöholm (1999) showed that foreign ownership is associated with higher labour productivity but that does not depend whether firms are majority or minority owned by foreigners and Dimelis and Louri (2002) evidenced that foreign ownership entails a productivity advantage, which is more important in fully or majority foreign-owned firms. More recently, using several measures of performance, Greenaway et al. (2014) found that JVs perform better than wholly foreign-owned and purely domestic firms. These authors also tested a nonlinear relation between the two variables, evidencing that foreign ownership and performance are linked by an inverted U-shaped relationship. Although productivity and profitability initially rise with foreign ownership, they start declining once the ownership stake exceeds about 60%. This interesting nonlinear relation, also evidenced by Akimova and Schwödiauer (2004) and Hintosova and Kubikova (2016), suggests that some domestic ownership is necessary to ensure optimal performance. The reasons for such a nonlinear relation are not well explored but could be supported by the agency theory and the potential conflicts arising between (foreign) owners and (national) managers and workers. In particular, Akimova and Schwödiauer (2004) argued that the nonlinearity is due to an institutional environment adverse to FDI. Given the exploratory nature of this paper, the presence of this nonlinear relation will also be tested.
Differences in performance between firms can be related to differences in firm-specific advantages, as well as different characteristics of the industry where firms operate. Theoretically, in the context of competitive markets it is expected that within the same industry firms converge to similar levels of performance (Cubbin and Geroski, 1986). Hansen and Wernerfelt (1989) and Rumelt (1991) evidenced that industry effects played a modest role in explaining the variability in performance. Thus, regarding profitability, it is relevant to study if there are significant differences between foreign-owned and domestic firms within particular industries, where the specificities of both type of firms could exert some influence.
Another interesting topic, grounded in the institutional economics literature, is the issue of development difference and institutional distance. Specifically, the question if profitability could be affected by the country of origin of share capital and its development/institutional distance towards the host country (e.g., Chari and Shaikh, 2017). According to Gaur and Lu (2007) and Trapczynski and Banalieva (2016), the effect of ownership is contingent on institutional difference and host country experience. Additionally, international experience attenuates the negative effects of cultural distance (Li et al., 2014) and there is evidence that in host countries with higher cultural distance, foreign affiliates of firms with international experience have lower survival chances (Sousa and Tan, 2015). The recent paper from Trapczynski and Banalieva (2016) presented a complete literature review on this issue but, albeit the ‘paradox of distance’, most of the literature points that a larger institutional distance reduces firm performance due to higher uncertainty and transaction costs (Zaheer, 1995; Zaheer and Hernandez, 2011).
As a result of this literature review, we can now state a first set of hypotheses to be tested:
H1 The degree of foreign ownership is positively related with firm profitability. H1a Foreign ownership has a positive effect on profitability.
H1b That effect is non-monotonic.
H1c That effect differs between sectors of activity.
H2 Firms with foreign share capital coming from more institutionally developed countries present higher levels of profitability.
2.2 Additional determinants of profitability
Even though our paper is focused on the relation between foreign presence in firms’ equity and financial performance, it is included a set of control variables in order to rule out alternative determinants of the sampled firms’ performance. Besides their direct impact on performance, we intend to explore the potential moderating role of some organisational characteristics in influencing the foreign ownership-profitability relationship. The variables used here and traditionally used in studies about performance determinants (e.g., Greenaway et al., 2014; Trapczynski and Banalieva, 2016) are firm age, size, internationalisation and debt.
Theoretically, older firms should possess a greater stock of knowledge and experience, which could have a positive impact on performance. Older firms have
enjoyed the benefits of learning, are not prone to the liabilities of newness and can, therefore, enjoy superior financial performance. For example, brand, reputation and legitimacy are some strategic resources that firms build with time. Older firms could also be better equipped to learn from their experiences in the past and would possess more skills to implement their learning in new undertakings (Singla and George, 2013). Yet, as firms age they tend to become more conservative and prone to inertia, having difficulties in dealing with changes in their competitive environment (Hannan and Freeman, 1984; Aggarwal and Gort, 1996). Albeit the impact of age on performance is ultimately an empirical question, our expectation is that age negatively moderates the effect of foreign ownership on performance since foreign firms have to face a learning process when operating in a new and unfamiliar environment.
Regarding the impact of size on performance, the literature points to the fact that size can be a source of competitive advantage because larger firms have at their disposal greater technical and commercial opportunities, allowing them access to economies of scale, greater bargaining power and the capability to raise barriers to deter potential competitors or have an easier access to capital markets (Dhanaraj and Beamish, 2003; Thomas and Eden, 2004). Nevertheless, fixed costs, increased monitoring needs and organisational inefficiencies associated with larger size could outweigh the benefits of increased market power, with the larger flexibility of smaller firms being a competitive advantage (Chen and Hambrick, 1995). Additionally, size could only influence performance in certain industries, given specific differences in terms of the degree of competition or the existence of economies of scale (Bamiatzi et al., 2016). According to the agency theory, it is expected a negative relationship between size and profitability, since the separation of ownership and control creates a conflict between managers and shareholders, which in turn could shift the objective from maximising benefits for others towards management, such as survival or growth. In sum, the literature is ambiguous about the existence of competitive advantages positively related to size, so that the sign of that relation remains an empirical issue.
The discussion of the effects of internationalisation on performance has mainly covered large firms, with the literature generally finding a positive relation (e.g., Lu and Beamish, 2004; Hsu et al., 2013). Lu and Beamish (2006) argued that exporting has been extensively employed by firms as an internationalisation strategy. Empirical studies on samples of SMEs have revealed the existence of a ‘liability of foreignness’ at the beginning of the internationalisation process via FDI, and a positive relationship between exports and profitability. Empirical results of prior studies have been inconclusive with some studies finding a positive impact of the degree of internationalisation (e.g., Kim et al., 1989; Qian, 2002; Tsao and Chen, 2012; Hsu et al., 2013), others finding no effect (e.g., Hoskisson and Hitt, 1990; Morck and Yeung, 1991; Vithessonthi, 2016) and still others finding a negative effect (e.g., Singla and George, 2013; Xiao et al., 2013; Vithessonthi and Racela, 2016).
Regarding leverage, some studies show that SMEs prefer going into debt before increasing capital to finance their investments, thus avoiding the entry of external shareholders (Anderson et al., 2003). However, other studies evidenced that SMEs prefer to be more prudent, not going into debt in order to avoid losing their independence to creditors (López-Garcia and Aybar-Arias, 2000). Given that SMEs could have specific concerns in terms of privacy, control and generational transition, they tend to prefer
internal financing policies, favouring the reinvestment of their own funds to capital increases or long-term debt (Gallo et al., 2004). Nevertheless, their attitude towards debt could change as generations, managers and the business as a whole evolves (Lussier and Sonfield, 2009). In sum, debt ratios are included here because a firm’s ownership may influence its capital structure (Demsetz and Lehn, 1985; Randøy and Goel, 2003) and, in line with the agency and pecking order theories we expect a negative relationship between SMEs indebtedness and its profitability.
So, regarding the control variables, we state the following set of hypotheses: H3 The relation between foreign ownership and profitability differs between younger
and older firms, the latter being more profitable.
H4 The relation between foreign ownership and profitability differs between larger and smaller firms, the latter being more profitable.
H5 The relation between foreign ownership and profitability differs between export oriented and domestic oriented firms, the former being more profitable.
H6 The relation between foreign ownership and profitability differs between more or less indebted firms, the latter being more profitable.
3 Materials and methods
3.1 Dependent and independent variables
Prior studies have used a broad range of performance measures ranging from outcomes achieved in the product markets (such as sales growth: Siddharthan and Lall, 1982; Grant, 1987), to accounting measures (such as ROA, ROS and ROE: Riahi-Belkaoui, 1998; Lu and Beamish, 2001) as well as market-based measures (such as beta and risk-adjusted returns: Michel and Shaked, 1986; Goerzen and Beamish, 2003). A key problem with narrow measures is that they may not be representative of firm performance, which may differ from traditional profitability ratios (Pangarkar, 2008). Firm performance measures tend to be related, as firms with greater productivity are more likely to have greater profitability and to experience higher rates of growth. Nevertheless, they can display low levels of correlation (Thomsen and Pedersen, 2000). For instance, many SMEs in the early stages of their evolution might place a strong emphasis on sales growth.
Due to data availability, and in line with the industrial organisation paradigm, it is assumed that all firms are profit-maximising and, accordingly, their performance will be measured exclusively by profitability variables. The use of ROA is widely supported by the literature and has been used in several studies analysing the relationship between internationalisation and firm performance (e.g., Barbosa and Louri, 2005; Greenaway et al., 2014; Trapczynski and Banalieva, 2016), being generally considered to be a key performance indicator and superior to alternative measures such as ROE which is sensitive to the firm’s capital structure (Miller et al., 2016). Additionally, ROA and related profitability measures can be easily computed from financial statements and compared in cross-country surveys.
ROA is computed as net income scaled by the book value of total assets. In order to check robustness, we also proxy financial performance using EBITDA and EBIT instead of ROA (respectively, variables REBITDA and REBIT). The variable return on sales (ROS) is also tested as a profitability measure being computed as net income divided by total sales.
The independent variable foreign ownership (FO) is computed as the percentage of the firm’s capital that is foreign-owned, being expected a positive relation with profitability. This is a common way to measure foreign ownership, and was for example used by Halkos and Tzeremes (2010), Greenaway et al. (2014), Konings (2001) and Hintosova and Kubikova (2016) among others.
We assume that when foreign share capital comes from a country that is more institutionally developed than the host-country that should be beneficial for the firm, benefiting from the experience and cost-efficient methods brought by foreign capital. So, the variable institutional difference (INST) between Portugal and the country of origin of the share capital is measured using Holmes et al. (2008) heritage index of economic freedom or HIEC. Higher values for HIEC indicate greater institutional development, so that more positive (negative) values for INST indicate that the host-country is more (less) institutionally developed than the parent-country, being expected a negative (positive) relation. Additionally, alternatively to INST and as robustness check, traditional development variables such as HDI (Human Development Index) and GDP per capita (in PPP) differences between Portugal and the capital’s country of origin are also tested.
3.2 Control variables
Even though our paper is focused on the relation between the degree of foreign ownership and profitability, we include the following set of control variables in order to rule out alternative determinants of the sampled firms’ performance: firm age, size, internationalisation and debt.
For kurtosis reasons, variables age (AGE) and size (SIZ) are measured, respectively, as the log of the number of years since the firm’s inception and the log of total assets.
Concerning the variable ‘internationalisation’ (EXP), we will use the traditional variable for export intensity (ratio of foreign sales to total sales). The debt level of the firm is measured by short-term (STD) and long-term debt (LTD), respectively, current liabilities/total assets and non-current liabilities/total assets.
3.3 Data and methodology
This paper analyses a sample of SMEs from the manufacturing sectors (codes 10 to 32, from the European Classification of Economic Activities – NACE – Rev. 2) obtained from Sistema de Análise de Balanços Ibéricos (SABI), a financial database powered by Bureau van Dijk (with the exception of the variables measuring ‘institutional difference’ and development levels). Applying the criteria for SMEs definition (Commission Recommendation 2003/361/EC), thus excluding a large number of micro firms (which employ fewer than ten persons and whose annual turnover and/or annual balance sheet
does not exceed 2M€), considering only firms already existing in 2010 and presenting complete data from 2010 to 2017, excluding firms with negative debt ratios or equity and liabilities greater than assets and winsorising the observations below (and above) the 1st (and 99th) percentile, in order to eliminate spurious outliers, we obtained a balanced panel data of 5,722 SMEs distributed by all manufacturing sectors.
Table 1 presents a detailed description of our sample. The sample is composed of mature SMEs, with an average age of 30 years, accounting for 229,708 employees, a turnover near 23,000 M€, total assets of 23,930 M€ and an average ROA of 2.9% in 2017. The sample has 76.4% of small firms (4,372) and 23.6% of medium firms (1,350) and all relevant sectors are represented. The average percentage of foreign ownership is around 4%, with 269 firms with partial or total foreign ownership, with share capital coming from 28 different countries. In those 269 firms there are 198 wholly foreign-owned firms and 71 JVs, respectively with average ROA of 4.2% and 3.0%. Foreign ownership is more relevant in highly capital intensive sectors, such as sectors 19/20/21, 27, 29 and 30.
Table 1 Distribution of the sample by industry classifications
Industry classification
(NACE) Number of firms Small firms (%) Aver. number of empl. Average sales (th€) Exports (%) Average EBITDA (th€) Foreign ownership (%) Food products (10) 821 78.6% 36.2 5,049.0 7.6% 351.1 2.4% Beverages and tobacco
(11/12) 129 88.4% 26.5 4,702.1 27.7% 741.1 7.0%
Textiles (13) 327 71.2% 47.8 4,756.4 32.0% 496.4 3.2% Wearing apparel (14) 457 66.1% 52.0 3,795.2 61.5% 265.4 1.4% Leather and related
products (15) 394 58.9% 53.7 3,869.3 49.2% 281.9 2.0% Wood and of products
of wood and cork (16) 323 86.4% 30.8 3,584.6 26.3% 335.4 2.0% Paper and paper
products (17) 108 68.5% 51.4 7,452.4 15.3% 724.9 10.1% Printing and reproduction of recorded media (18) 199 86.4% 29.6 2,161.4 5.2% 306.7 0.5% Refined petroleum, chemicals, man-made fibres and pharmaceutical products (19/20/21) 161 73.9% 44.5 7,431.9 19.0% 753.9 16.7%
Rubber and plastic
products (22) 306 73.2% 44.0 5,512.5 23.7% 692.6 6.9% Other non-metallic
mineral products (23) 443 81.0% 34.8 3,008.8 30.7% 426.2 4.0% Notes: Small firms are firms with less than 50 employees. Sectors 11/12 and 19/20/21 are
aggregated since the sample only comprises a very small number of firms in sectors 12, 19 and 21.
Table 1 Distribution of the sample by industry classifications (continued)
Industry classification
(NACE) Number of firms Small firms (%) Aver. number of empl. Average sales (th€) Exports (%) Average EBITDA (th€) Foreign ownership (%) Basic metals (24) 55 61.8% 52.8 7,503.2 34.6% 824.3 4.6% Fabricated metal products (25) 995 80.7% 35.7 3,153.1 27.2% 404.1 3.6% Computer. communication and electronic equip. (26) 27 66.7% 61.4 7,037.7 36.5% 618.7 11.1% Electrical equipment (27) 111 77.5% 40.5 4,260.5 30.0% 437.5 9.7% Machinery and equipment (28) 285 76.5% 40.3 3,916.3 32.7% 482.6 5.5% Motor vehicles.
trailers and parts (29) 86 62.8% 53.0 4,874.2 40.5% 521.2 12.8% Other transport equipment (30) 22 54.6% 58.7 6,106.5 45.2% 625.9 18.2% Furniture (31) 341 82.1% 32.0 1,947.8 32.7% 218.1 0.9% Other manufacturing activities (32) 132 84.9% 31.3 2,073.0 19.3% 193.7 6.1% 5,722 76.4% 40.1 4,019.0 28.6% 411.9 4.0%
Notes: Small firms are firms with less than 50 employees. Sectors 11/12 and 19/20/21 are aggregated since the sample only comprises a very small number of firms in sectors 12, 19 and 21.
Before estimating the different models we present in Table 2 some descriptive statistics and the correlation matrix of the variables. The sample’s mean values for the different variables, differentiating between the two kinds of firms are presented, together with the results of a test for differences in mean values between the two sub-samples. Notice that foreign firms present better performance measures, are larger, export-oriented and display lower levels of indebtedness. The t-tests for equality of means show that there are considerable differences between domestic and foreign-owned firms with regard to profitability. Also, we find that foreign firms are larger and less indebted, which may contribute to the positive differential in profitability.
Regarding the correlation coefficients, they are generally low. According to Gujarati and Porter (2008), when the correlation coefficients are above 50%, the problem of collinearity becomes significant. Observing the correlation coefficients between the variables they are always below 50%. Additionally, VIF tests for the different independent variables present very low values. Therefore the problem of collinearity between explanatory variables will not be relevant. Notice that foreign ownership is negatively correlated with institutional difference, meaning that foreign share capital comes mainly from more developed countries.
Table 2 Descriptive statistics and correlation matrix between independent variables Do mest ic firms (n = 54 53) F ore ig n f irms (n = 269 ) Mean d iffer . (t– te st) FO I N ST AG E SIZ EX P ST D L TD R OA 2. 9% 3. 9% 5. 62 ( *** ) 0. 034 (* **) –0 .113 (** *) –0 .0 91 (* ** ) 0. 049 ( *** ) 0. 08 5 (* **) –0 .123 (** *) –0 .1 70 ( *** ) R E B IT DA 9. 4% 10 .2 % 3. 94 ( *** ) 0. 021 (* **) –0 .122 (** *) –0 .1 64 (* ** ) –0 .011 (** ) 0. 04 2 (* **) –0 .097 (** *) –0 .0 92 ( *** ) R E B IT 4. 9% 6. 0% 5. 34 ( *** ) 0. 032 (* **) –0 .110 (** *) –0 .1 09 (* ** ) 0. 045 ( *** ) 0. 08 8 (* **) –0 .091 (** *) –0 .1 45 ( *** ) R O S 2. 2% 2. 5% 1. 17 0. 003 –0 .086 (** *) –0 .0 15 (* ** ) 0. 031 ( *** ) –0 .0 27 ( *** ) –0 .053 (** *) –0 .0 71 ( *** ) FO … 85 .7 % ... 1 –0 .1 15 (* ** ) 0.0 07 0. 22 2 (* ** ) 0.1 64 (** *) –0 .0 15 (* ** ) –0 .05 0 (* ** ) INS T … –4 .6 % ... 1 –0 .0 07 –0 .1 89 (* ** ) –0 .15 8 (* ** ) 0. 07 6 (* ** ) 0. 04 1 (* ) AG E 3. 1 3. 1 0. 69 1 0. 285 ( *** ) 0. 03 8 (* **) –0 .217 (** *) –0 .1 11 ( *** ) SI Z 7. 4 8. 7 56 .96 ( *** ) 1 0. 27 7 (* **) –0 .086 (** *) 0. 00 7 E X P 26 .3 % 52 .5 % 32 .13 (*** ) 1 0. 073 (*** ) –0 .0 48 (*** ) ST D 41 .1 % 39 .0 % –4 .46 (*** ) 1 –0 .2 89 (*** ) L T D 16 .4 % 13 .0 % –9 .66 (*** ) 1 No te s: * p < 0. 10; * *p < 0. 05 ; * ** p < 0 .01. ‘Domest ic fi rms’ a re fi rms wi th f ully n ati onal share cap ital; ‘F or ei gn fir ms’ a re firms wi th p ar tial or to ta l fore ig n own ersh ip ; ROA = ret urn on asse ts ; REBIT DA = E B IT DA/t ot al a ssets; RE BIT = E B IT /t ot al asse ts; ROS = re turn o n sa le s; FO = percent ag e o f fo re ig n sh are cap ita l; IN ST = H IE CPort ugal – HIE Cpa re nt count ry ; A G E = lo ga ri th m of fi rm a ge , in y ea rs; SIZ = f irm si ze , me as ured by th e lo ga rithm of t ot al a sset s; E X P = tota l e xport s as a pe rc enta ge o f t ot al sa le s; ST D = cur re nt liab ilitie s/ tot al asset s; LTD = n on-cu rre nt li ab ili ties/ total asse ts.
The relation between foreign ownership and profitability is addressed with a panel data methodology estimated through three different regression models: pooled ordinary least squares (POLS), fixed-effects model (FEM) and random-effects model (REM). Applying the Breusch-Pagan and Hausman tests to choose the most appropriate regression technique, the Breusch-Pagan test leads to the rejection of the null hypothesis, indicating that REM is more appropriate than POLS whereas the Hausman test leads to the non-rejection of the null hypothesis that REM is preferable to FEM.
4 Results and discussion
4.1 Empirical results
The regression results for the random-effects model are presented in Table 3, where the alternative dependent variables are run on the variables ‘foreign ownership’ (FO) and ‘institutional difference’ (INST) and the control variables AGE, SIZ, EXP and debt (STD and LTD). The results with ROS as the dependent variable are not presented since are very similar to the others. The first column presents the results for all firms considering only the control variables. The following columns present separate results for the domestic and foreign firms’ sub-samples. Notice that the results for ROA, REBITDA and REBIT are very similar. With the full specifications the random-effects model results present a goodness of fit near 10%.
Since one of the objectives of this paper is to test the presence of nonlinear effects of foreign ownership in profitability, we alternatively test the variables FO, INST, HDI and PPP and their squares as independent variables, for the sub-sample of ‘foreign firms’ (Table 4). If the sign of the coefficients associated with the variable and its square differ in sign, a non-monotonic relationship between profitability and foreign ownership is obtained. Due to space limitations, only the most significant results are presented.
Finally, testing the presence of differences between industries, Table 5 presents the results for the different sectors of activity.
4.2 Discussion
We now analyse the results at the light of the different hypotheses. The first row in Table 3 evidences that ‘foreign ownership’ does not seem to have a significant impact on profitability thus not confirming H1a and the results from Hintosova and Kubikova (2016). This lack of evidence that foreign-owned firms perform better than domestic firms is in line with the results reported by Konings (2001) and Barbosa and Louri (2005), meaning that the knowledge of the domestic market may be an important factor for profitability. Well established relationships among domestic firms, their owners and their managers, provide some advantages to domestically-owned firms that cannot be attained by foreign-owned firms.
Table 3 Random-effects model results All fi rm s ( n = 5,7 22) D omes ti c fir m s (n = 5,45 3) For ei gn fir m s ( n = 26 9) ROA ROA R EBITDA R O A R EBITD A
ROA ROA ROA
R O A RO A 0. 104* ** 0.106 *** 0.24 2** * 0.03 3 0.14 9** * 0 .028* * 0.035 *** 0.031* ** 0. 03 0** * 0.03 5** * C (0 .0 04 ) (0 .0 04 ) (0 .0 05 ) (0 .0 27 ) (0 .0 35 ) (0 .0 11 ) (0 .0 03 ) ( 0. 00 5) (0 .0 04 ) (0 .0 27 ) 0.012 FO ( 0.013 ) –0.07 6** IN ST (0 .0 37 ) –0.150 ** HDI (0 .0 70) –0 .001 *** –0 .0 01* * PP P (0 .0 03 ) (0 .0 00 ) Con tro ls –0.02 0** * –0 .0 21** * –0 .036 *** –0.013 *** –0 .025 *** –0 .013 *** AGE (0 .0 01 ) (0 .0 01 ) (0 .0 01 ) (0 .0 05 ) (0 .0 06 ) (0 .0 06 ) 0. 006* ** 0.006 *** 0.00 4** * 0. 012* ** 0.01 1** * 0.01 1** * SIZ (0 .0 00 ) (0 .0 00 ) (0 .0 01 ) (0 .0 03 ) (0 .0 04 ) (0 .0 03 ) 0. 016* ** 0.017 *** 0.01 8** * 0.014 ** 0.020 ** 0.01 2 EXP (0 .0 01 ) (0 .0 01 ) (0 .0 02 ) (0 .0 07 ) (0 .0 08 ) (0 .0 11 ) –0.10 3** * –0 .1 03** * –0 .123 *** –0.107 *** –0 .132 *** –0 .106 *** STD (0 .0 02 ) (0 .0 02 ) (0 .0 03 ) (0 .0 11 ) (0 .0 14 ) (0 .0 17 ) –0.11 8** * –0 .1 16** * –0 .131 *** –0.177 *** –0 .201 *** –0 .176 *** LTD (0 .0 02 ) (0 .0 02 ) (0 .0 03 ) (0 .0 14 ) (0 .0 17 ) (0 .0 27 ) Over al l R 2 0.10 0. 10 0.07 0.10 0.07 0.01 0 .0 1 0.01 0.01 0.11 No te s: H D I = HD IPortu ga l – HD Ipare nt c ou nt ry ; PP P = GDP p er cap itaPort ugal – GDP p er cap it apare nt c oun try ( in th ous and d oll ar s) . St an dar d-dev ia tions pr es ented in b rack et s. * p < 0. 10; * *p < 0. 05 ; *** p < 0 .0 1.
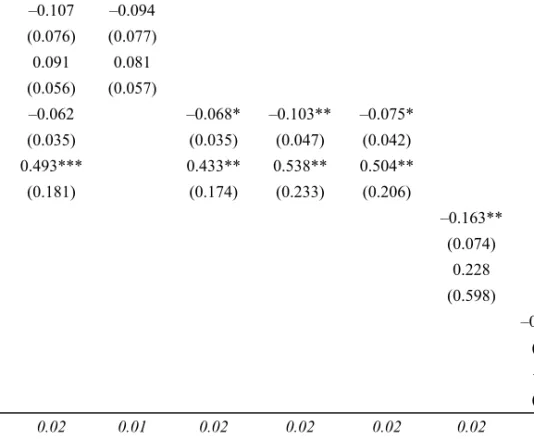
Table 4 Random-effects model results: testing the presence of nonlinearities
ROA ROA ROA REBITDA REBIT ROA ROA
0.051** 0.055** 0.033*** 0.094*** 0.053*** 0.029*** 0.028*** C (0.022) (0.023) (0.004) (0.005) (0.005) (0.000) (0.004) –0.107 –0.094 FO (0.076) (0.077) 0.091 0.081 FO2 (0.056) (0.057) –0.062 –0.068* –0.103** –0.075* INST (0.035) (0.035) (0.047) (0.042) 0.493*** 0.433** 0.538** 0.504** INST2 (0.181) (0.174) (0.233) (0.206) –0.163** HDI (0.074) 0.228 HDI2 (0.598) –0.001*** PPP (0.000) –0.000 PPP2 (0.000) Overall R2 0.02 0.01 0.02 0.02 0.02 0.02 0.02
Notes: Standard-deviations presented in brackets. *p < 0.10; **p < 0.05; ***p < 0.01.
Considering only the wholly or partial foreign-owned firms and regarding the possibility of a nonlinear relationship, the results presented in Table 4 show that the degree of foreign ownership also does not have a significant non-monotonic effect of profitability, thus not confirming H1b. Nevertheless, institutional difference displays a significant U-shaped relation with profitability. That nonlinear relation is significant for the different measures of profitability but is less significant when considering the differences in terms of HDI or GDP per capita. Figure 1 plots this interesting result, showing that firms with foreign share capital coming from more institutionally advanced countries (lower levels for INST) display increasingly levels of profitability, whereas capital from lagging countries result on lower levels of profitability. Also, capital coming from less institutionally advanced countries seems to exert a slightly positive impact on performance. This result, which partially confirms H2, evidences the potentially lower profitability levels obtained by firms where part or whole of the capital comes from less developed countries, which lack the necessary resources, technologies and managerial and international networking skills to obtain higher levels of profitability (Huang and Shiu, 2009; Greenaway et al., 2014). Additionally, we could posit the hypothesis that cultural distance, in absolute terms, has a positive effect in performance, a result deserving further research.
Table 5 Random-effects model for different manufacturing sectors. ROA as dependent variable C AE 10 11/12 13 14 15 16 17 18 19 /2 0/21 22 0.0 93* ** 0.033 0.092 *** 0.1 18* ** 0.163 *** 0. 115* ** 0 .10 3** * 0.1 19* ** –0.005 0.122 *** C (0 .01 0) (0.023) (0 .0 17) (0.016 ) (0.0 15) (0 .01 6) (0.0 24) (0 .02 3) (0.027 ) (0 .0 17) –0 .022 ** –0 .04 6** * –0 .0 01 –0.054 ** – 0.0 10 –0 .01 7 –0.009 0.01 1 0.005 –0 .0 16 FO (0 .01 1) (0.015) (0 .0 14) (0.025 ) (0.0 16) (0 .01 5) (0.0 14) (0 .05 4) (0.012 ) (0 .0 11) –0 .04 6 –0.210 –0 .1 63 –0 .14 6 – 0.0 16 –0 .08 0 0.1 47 –0 .14 5 –0.014 –0 .0 88 INS T 0. 084 (0.140) (0 .1 57) (0.204 ) (0.1 04) (0 .20 0) (0.1 71) (0 .99 0) (0.102 ) (0 .0 89) –0.014 *** –0 .0 09* * –0 .019 *** – 0.0 40* ** –0 .03 3** * –0.019 *** – 0.01 6** * –0.017 *** – 0.0 21* ** –0 .01 6** * AG E (0 .00 2) (0.004) (0 .0 04) (0.004 ) (0.0 03) (0 .00 4) (0.0 05) (0 .00 5) (0.006 ) (0 .0 04) 0.0 05* ** 0.00 7** 0.009 *** 0.0 16* ** 0.009 *** 0. 00 3 0.00 7** 0.00 3 0. 01 7** * 0.005 *** SIZ (0 .00 1) (0.003) (0 .0 02) (0.002 ) (0.0 02) (0 .00 2) (0.0 03) (0 .00 3) (0.003 ) (0 .0 02) 0. 014 * –0.005 0.00 5 0.0 11* * 0. 00 9** 0.0 26* ** 0.0 17 0.0 51* ** 0. 03 5** * 0. 01 5** EXP (0 .00 7) (0.008) (0 .0 06) (0.005 ) (0.0 04) (0 .00 5) (0.0 14) (0 .01 6) (0.012 ) (0 .0 07) –0.108 *** – 0.07 6** * –0 .114 *** – 0.1 35* ** –0 .12 6** * –0.099 *** – 0.11 4** * –0.108 *** – 0.0 69* ** –0 .13 3** * STD (0 .00 6) (0.010) (0 .0 09) (0.009 ) (0.0 08) (0 .00 8) (0.0 13) (0 .01 1) (0.011 ) (0 .0 09) –0.118 *** – 0.08 2** * –0 .138 *** – 0.1 69* ** –0 .17 7** * –0.111 *** – 0.13 7** * –0.112 *** –0.016 * –0 .14 5** * LTD (0 .00 7) (0.010) (0 .0 11) (0.010 ) (0.0 11) (0 .00 9) (0.0 14) (0 .01 2) (0.008 ) (0 .0 10) Over all R 2 0.06 0.14 0.1 1 0. 13 0.1 8 0. 10 0.15 0.08 0.09 0.1 7 No tes: St and ar d-dev iatio ns pres en ted in br acke ts. *p < 0 .10 ; **p < 0.0 5; ** *p < 0 .01.
Table 5 Random-effects model for different manufacturing sectors. ROA as dependent variable (continued) 23 24 25 26 27 28 29 30 31 32 0.07 4** * 0.03 0 0.1 22* ** 0.18 9** 0.05 8* 0.122 ** * 0.12 6** * 0.09 6 0.14 9* ** 0. 201* ** C (0.015 ) (0.04 7) (0 .0 09) (0 .0 79) (0 .032 ) (0.01 7) (0.03 3) (0.0 98) (0.0 14) (0 .0 27 ) 0.00 9 0.00 4 –0 .0 13* –0.06 6 –0.0 20 –0 .0 17 – 0.017 –0 .0 72* * –0 .02 1 –0.00 4 FO (0.012 ) (0.03 2) (0 .0 07) (0 .0 66) (0 .018 ) (0.01 4) (0.02 4) (0.0 30) (0.0 23) (0 .0 21 ) 0.17 7 0.27 2 – 0.07 0 –0.27 8 0. 520* * 0.07 5 – 0.211 0.50 6 –0 .34 6 –0.16 2 INST (0.152 ) (0.46 0) (0 .0 69) (0 .6 40) (0 .239 ) (0.09 6) (0.26 9) (0.4 78) (0.2 20) (0 .2 70 ) –0 .0 13* ** –0 .013 –0 .02 6** * –0 .0 37* –0 .0 28* ** –0 .029 *** –0 .023 *** –0 .07 1** * – 0.02 1** * –0.03 2* ** AG E (0.003 ) (0.00 9) (0 .0 02) (0 .0 20) (0 .007 ) (0.00 4) (0.00 8) (0.0 24) (0.0 03) (0 .0 06 ) 0. 004* * 0 .0 09* 0.0 08* ** 0 .0 06 0 .017 *** 0.008 ** * 0.01 1** * 0.03 7** * –0 .00 0 0. 00 4 SIZ (0.002 ) (0.00 5) (0 .0 01) (0 .0 08) (0 .004 ) (0.00 2) (0.00 4) (0.0 09) (0.0 02) (0 .0 03 ) 0.02 0** * 0.043 ** 0.0 13* ** –0.01 1 0. 010 0.026 ** * 0.00 7 –0 .07 4** * 0.02 4* ** 0. 00 3 EXP (0.004 ) (0.01 7) (0 .0 03) (0 .0 24) (0 .012 ) (0.00 6) (0.01 1) (0.0 24) (0.0 05) (0 .0 11 ) –0 .0 92* ** –0 .081 *** –0 .11 4** * –0 .091 ** –0 .0 93* ** –0 .096 *** –0 .180 *** –0 .11 7** * – 0.11 6** * –0.13 8* ** ST D (0.008 ) (0.02 2) (0 .0 05) (0 .0 41) (0 .018 ) (0.00 9) (0.01 8) (0.0 34) (0.0 08) (0 .0 14 ) –0 .1 02* ** –0 .116 *** –0 .13 3** * –0.24 9** * –0 .1 54* ** –0 .119 *** –0 .207 *** –0 .15 1** * – 0.11 9** * –0.13 7* ** LT D (0.008 ) (0.02 7) (0 .0 06) (0 .0 51) (0 .022 ) (0.01 2) (0.02 2) (0.0 45) (0.0 09) (0 .0 16 ) Over all R 2 0. 06 0.04 0.13 0.14 0.1 0 0. 13 0.23 0.11 0.13 0.14 Not es: Standar d-de via tion s pres en ted in br acke ts.* p < 0 .10; **p < 0.05 ; *** p < 0 .0 1.
Figure 1 Effect of institutional difference on performance
The quadratic nature of the relationship between institutional difference and profitability calls for major attention to these effects by policymakers. An implication of our results is that policymakers should focus their energies in attracting FDI from significantly more developed countries, enhancing the performance results of those firms and their spillover effects to the economy. Capital coming from less developed countries also seems to have a positive effect, possibly due to some sort of positive ‘cultural’ promoting and complementing effects. Globally, these results mean that when capital comes from countries similar to Portugal in terms of institutional/cultural development levels, the impacts on profitability are lower. Nevertheless, our exploratory results should be treated with caution since, as argued by Lind and Mehlum (2010) and Haans et al. (2016), a significant coefficient associated to a squared variable is not sufficient to establish a quadratic relationship. So, future developments of this issue should use the adequate formal procedures presented by those authors when testing for the presence of a U-shaped relation.
Regarding the other hypotheses related with the control variables (Table 3), the coefficients are always significant, confirming Hypotheses H4, H5 and H6. Regarding the variable AGE, and confirming the results from Barbosa and Louri (2005), firm’s age seems to have a negative impact on profitability. Possibly, older firms are more likely to be in the maturity phase, with lower levels of growth opportunities and, consequently, lower profitability levels. Smaller firms present better profitability levels as a result of their flexibility and operational efficiency, contrary to large firms, which face increased monitoring costs and bureaucratisation. Additionally, and confirming previous results (e.g., Greenaway et al., 2014), export-oriented firms tend to present higher levels of profitability and more indebted firms are less profitable, independently of the maturity of the debt. This last result, which is typically found in the literature, is in line with the predictions of the agency and pecking order theories, since a high level of leverage imposes a fixed financial commitment on the firm, reducing the free cash flows available to management (Vieira, 2017). Notice that the stronger impact of firm size and indebtedness on profitability is also evidenced in Table 3, where the respective coefficients present higher values for ‘foreign firms’. Due to their non-significance, and for brevity reasons, the results for interaction effects between foreign ownership and the control variables are not presented in Table 3, thus not validating the existence of
significant differences between 100% domestic firms and partial or totally foreign owned firms.
Finally, Hypothesis H1c posits that the foreign ownership impact on profitability differs between sectors of activity. So, regarding differences between industries, Table 5 partly confirms H1c, evidencing that foreign capital seems to exert a slightly negative effect on performance across sectors, particularly in sectors 10, 11/12, 14, 25 and 30. With some exceptions, this negative effect seems to be stronger in those sectors with a larger proportion of small firms and lower internationalisation and foreign ownership levels, possibly due to the fact of being highly competitive sectors, with mature firms with well defined markets and networks. There is no evidence of positive effects deriving from foreign capital and institutional differences also seem to be irrelevant.
5 Conclusions
Management theories should not consider firms just as a value maximising entity regardless of its owners. Different owners and managers have different risk attitudes, face different incentives and bring to the firm different resources, so similar firms could present different degrees of performance. Some recent studies have compared performance between foreign-owned and domestic-owned firms. While some of those studies have found that foreign-owned firms outperform their domestic counterparts, other studies evidenced the opposite. Only a limited number of papers have attempted to examine how the degree of foreign ownership in a firm influences its profitability.
This exploratory paper contributes to fill that gap studying the differences between domestic and foreign-owned firms (wholly or partially owned by foreign share capital). The degree of foreign ownership and institutional difference generally showed a broadly non-significant relationship with profitability, meaning that the origin of the capital does not seem to exert any influence of the different firms’ profitability levels. Nevertheless, there seems to exists a nonlinear relationship between the development level of the country of origin of the share capital and profitability, with the results indicating that firms with share capital coming from more institutionally diverse countries attain higher profitability levels.
Regarding the main questions addressed in this paper, we can answer that: 1 compared to other firms, foreign firms are more profitable
2 profitability is positively impacted when foreign capital comes from more institutionally and economically advanced countries
3 there is a significant positive relation between firm’s size and degree of
internationalisation with profitability and a significant negative impact of firms’ age and level of indebtedness on profitability.
This paper gives a contribution to the literature about foreign capital impact on performance, studying if there are significant differences between domestic and foreign-owned firms in terms of profitability. Nevertheless, some limitations of this study should be mentioned:
1 This paper uses a balanced panel data of 5,722 firms that survived throughout the period from 2010 to 2017. Potentially, during that period there were firms exiting the market due to reasons related to low profitability. This selection bias in our sample constitutes a limitation, meaning that our results should be treated with caution. 2 Firms’ performance is affected by many variables that were not considered (e.g.,
managerial labour and product markets, political and economic factors or even the personality of shareholders and managers). Notice that, our results evidence
profitability differences between the two types of firms, but those differences are not specifically explained by the employed variables, failing to take account of the complexity of interests that are involved in an ownership structure. Possibly, considering internal factors such as knowledge transfer, R&D, product positioning and marketing, it would possible to unveil the differing impacts on firm
performance.
3 Profit manipulation and transfer pricing by foreign-owned firms could potentially create a bias in profitability measures. So, a multifaceted measurement could be more appropriate (Delios and Beamish, 2004).
4 The dataset comprises 5,722 firms, but only 269 have partial or total foreign ownership. Ideally, a larger number of observations and firms, in particular of ‘foreign firms’, allowing a clearer differentiation between wholly foreign-owned firms and JVs, could result in more robust results.
5 Finally, we admit in this paper that the causality goes from foreign ownership to profitability, disregarding the potential endogeneity, with the more profitable firms attracting foreign investors.
Future papers, employing a larger dataset, should perform GMM regressions as a robustness check to that issue. Also, the profitability measures used in the literature differ widely, leaving us with the question whether our results are dependent on the measures used and on the specific context of the Portuguese economy.
Given the importance of the performance-promoting channel of FDI, particularly when assuming the form of JVs, our findings may be of use in the optimisation of investments promotion policies. In particular, our results imply that policymakers should develop efforts to attract foreign capital, potentially under the form of JVs, promoting the establishment of international partnerships between domestic firms and firms located in countries with higher levels of institutional development.
Acknowledgements
This work is supported by FEDER funds from COMPETE 2020 and Portuguese funds – PORTUGAL 2020. Project IEcPBI – Interactive Ecosystem for Portuguese Business Internationalization – POCI-01-0145-FEDER-032139.
References
Aggarwal, R. and Gort, M. (1996) ‘The evolution of markets and entry, exit and survival of firms’,
The Review of Economics and Statistics, Vol. 78, No. 3, pp.489–498.
Akimova, I. and Schwödiauer, G. (2004) ‘Ownership structure, corporate governance, and enterprise performance: empirical results for Ukraine’, International Advances in Economic
Research, Vol. 10, No. 1, pp.28–42.
Anderson, R., Mansi, S. and Reeb, D. (2003) ‘Founding family ownership and the agency cost of debt’, Journal of Financial Economics, Vol. 68, No. 2, pp.263–285.
Azzam, I., Fouad, J. and Ghosh, D. (2013) ‘Foreign ownership and financial performance: evidence from Egypt’, International Journal of Business, Vol. 18, No. 3, pp.232–254.
Bamiatzi, V., Bozos, K., Cavusgil, S. and Hult, G. (2016) ‘Revisiting the firm, industry, and country effects on profitability under recessionary and expansion periods: a multilevel analysis’, Strategic Management Journal, Vol. 37, No. 7, pp.1448–1471.
Barbosa, N. and Louri, H. (2005) ‘Corporate performance: does ownership matter? A comparison of foreign-and domestic-owned firms in Greece and Portugal’, Review of Industrial
Organization, Vol. 27, No. 1, pp.73–102.
Benfratello, L. and Sembenelli, A. (2006) ‘Foreign ownership and productivity: is the direction of causality so obvious?’, International Journal of Industrial Organization, Vol. 24, No. 4, pp.733–751.
Blomström, M. and Sjöholm, F. (1999) ‘Technology transfers and spillovers: does local participation with multinationals matter?’, European Economic Review, Vol. 43, Nos. 4–6, pp.915–923.
Caves, R. (2007) Multinational Enterprise and Economic Analysis. 3rd ed., Cambridge University Press, Cambridge.
Chari, M. and Shaikh, I. (2017) ‘Defying distance? Cross border acquisitions by emerging economy firms’, Thunderbird International Business Review, Vol. 59, No. 2, pp.173–186. Chen, M. and Hambrick, D. (1995) ‘Speed, stealth, and selective attack: how small firms differ
from large firms in competitive behaviour’, Academy of Management Journal, Vol. 38, No. 2, pp.453–482.
Cubbin, J. and Geroski, P. (1986) ‘The convergence of profits in the long run: Inter-firm and inter-industry comparisons’, Journal of Industrial Economics, Vol. 35, pp.427–442.
Delios, A. and Beamish, P. (2004) ‘Joint venture performance revisited: Japanese foreign subsidiaries worldwide’, Management International Review, Vol. 44, No. 1, pp.69–91. Demsetz, H. and Lehn, K. (1985) ‘The structure of corporate ownership: causes and consequences’,
Journal of Political Economy, Vol. 93, No. 6, pp.1155–1177.
Demsetz, H. and Villalonga, B. (2001) ‘Ownership structure and corporate performance’, Journal
of Corporate Finance, Vol. 7, No. 3, pp.209–233.
Dhanaraj, C. and Beamish, P. (2003) ‘A resource‐based approach to the study of export performance’, Journal of Small Business Management, Vol. 41, No. 3, pp.242–261.
Dimelis, S. and Louri, H. (2002) ‘Foreign ownership and production efficiency: a quantile regression analysis’, Oxford Economic Papers, Vol. 54, No. 3, pp.449–469.
Gallo, M., Tàpies, J. and Cappuyns, K. (2004) ‘Comparison of family and non family business: financial logic and personal preferences’, Family Business Review, Vol. 17, No. 4, pp.303–318.
Gaur, A. and Lu, J. (2007). ‘Ownership strategies and survival of foreign subsidiaries: impacts of institutional distance and experience’, Journal of Management, Vol. 33, No. 1, pp.84–110. Gelübcke, J. (2013) ‘The performance of foreign affiliates in Germany manufacturing: evidence
from a new dataset’, Review of World Economics, Vol. 149, No. 1, pp.151–182.
Globerman, S., Ries, J. and Vertinsky, I. (1994) ‘The economic performance of foreign affiliates in Canada’, Canadian Journal of Economics, Vol. 27, No. 1, pp.143–156.
Goerzen, A. and Beamish, P. (2003) ‘Geographic scope and multinational enterprise performance’,
Strategic Management Journal, Vol. 24, No. 13, pp.1289–1306.
Gomes, L. and Ramaswamy, K. (1999) ‘An empirical examination of the form of the relationship between multinationality and performance’, Journal of International Business Studies, Vol. 30, No. 1, pp.173–187.
Grant, R. (1987) ‘Multinationality and performance among British manufacturing companies’,
Journal of International Business Studies, Vol. 18, No. 3, pp.79–89.
Greenaway, D., Guariglia, A. and Yu, Z. (2014) ‘The more the better? Foreign ownership and corporate performance in China’, The European Journal of Finance, Vol. 20, Nos. 7–9, pp.681–702
Griffith, R. (1999) ‘Using the ARD establishment data to looking at foreign ownership and productivity in the United Kingdom’, Economic Journal, Vol. 109, No. 456, pp.416–442. Gujarati, D. and Porter, D. (2008) Basic Econometrics, 5th ed., McGraw-Hill, Irwin.
Haans, R., Pieters, C. and He, Z. (2016) ‘Thinking about U: theorizing and testing U and inverted U shaped relationships in strategy research’, Strategic Management Journal, Vol. 37, No. 7, pp.1177–1195.
Halkos, G. and Tzeremes, N. (2010) ‘The effect of foreign ownership on SMEs performance: an efficiency analysis perspective’, Journal of Production Analysis, Vol. 34, pp.167–180. Hannan, M. and Freeman, J. (1984) ‘Structural inertia and organizational change’, American
Sociological Review, Vol. 49, No. 2, pp.149–164.
Hansen, G. and Wernerfelt, B. (1989) ‘Determinants of firm performance: the relative importance of economical and organizational factors’, Strategic Management Journal, Vol. 10, pp.399–411.
Harris, R. (2002) ‘Foreign ownership and productivity in the United Kingdom – some issues when using the ARD establishment level data’, Scottish Journal of Political Economy, Vol. 49, No. 3, pp.318–335.
Harris, R. and Robinson, C. (2003) ‘Foreign ownership and productivity in the United Kingdom: estimates for UK manufacturing using the ARD’, Review of Industrial Organization, Vol. 22, No. 3, pp.207–223.
Hintosova, A. and Kubikova, Z. (2016) ‘The effect of the degree of foreign ownership on firms’ performance’, Review of Economic Perspectives, Vol. 16, No. 1, pp.29–43.
Holmes, K., Feulner, E. and O’Grady, M. (2008) Index of Economic Freedom: The Link between
Economic Opportunity and Prosperity, The Heritage Foundation and The Wall Street Journal,
Washington, DC [online] http://www.heritage.org.
Hoskisson, R. and Hitt, M. (1990) ‘Antecedents and performance outcomes of diversification: a review and critique of theoretical perspectives’, Journal of Management, Vol. 40, No. 4, pp.767–798.
Hsu, W., Chen, H. and Cheng, C. (2013) ‘Internationalization and firm performance of SMEs: the moderating effects of CEO attributes’, Journal of World Business, Vol. 48, No. 1, pp.1–12. Huang, R. and Shiu, C. (2009) ‘Local effects of foreign ownership in an emerging financial market:
evidence from qualified foreign institutional investors in Taiwan’, Financial Management, Vol. 38, No. 3, pp.567–602.
Instituto Nacional de Estatística (INE) (2018) Estatísticas da Globalização, Lisboa, Portugal, 19 November.
Kim, C., Hwang, P. and Burgers, W. (1989) ‘Global diversification strategies and corporate profit performance’, Strategic Management Journal, Vol. 10, No. 1, pp.45–57.
King, M. and Santor, E. (2008) ‘Family values: ownership structure, performance and capital structure of Canadian firms’, Journal of Banking and Finance, Vol. 32, No. 11, pp.2423–2432.
Konings, J. (2001) ‘The effects of foreign direct investment on domestic firms’, Economics of
Transition, Vol. 9, No. 3, pp.619–633.
Kotabe, M., Srinivasan, S.S. and Aulakh, P.S. (2002) ‘Multinationality and firm performance: the moderating role of R&D and marketing capabilities’, Journal of International Business
Studies, Vol. 33, No. 1, pp.79–97.
Li, J. and Guisinger, S. (1991) ‘Comparative business failures of foreign-controlled firms in the United States’, Journal of International Business Studies, Vol. 22, No. 2, pp.209–224. Li, Y., Vertinsky, I. and Li, J. (2014) ‘National distances, international experience, and venture
capital investment performance’, Journal of Business Venturing, Vol. 29, No. 4, pp.471–489. Lind, J. and Mehlum, H. (2010) ‘With or without U? The appropriate test for a U shaped
relationship’, Oxford Bulletin of Economics and Statistics, Vol. 72, No. 1, pp.109–118. López-Garcia, J. and Aybar-Arias, C. (2000) ‘An empirical approach to the financial behaviour of
small and medium sized companies’, Small Business Economics, Vol. 14, No. 1, pp.55–63. Lu, J. and Beamish, P. (2004) ‘International diversification and firm performance: the S-curve
hypothesis’, Academy of Management Journal, Vol. 47, No. 4, pp.598–609.
Lu, J. and Beamish, P. (2006) ‘SME internationalization and performance: growth vs. profitability’,
Journal of International Entrepreneurship, Vol. 4, No. 1, pp.27–48.
Lu, J. and Beamish, P.W. (2001) ‘The internationalization and performance of SMEs’, Strategic
Management Journal, Vol. 22, Nos. 6–7, pp.565–586.
Lussier, R. and Sonfield, M. (2009) ‘Founder influences in family businesses: analyzing combined data from six diverse countries’, Journal of Small Business Strategy, Vol. 20, No. 1, pp.103–118.
Michel, A. and Shaked, I. (1986) ‘Multinational corporations vs domestic corporations; financial performance and characteristics’, Journal of International Business Studies, Vol. 18, No. 3, pp.89–100.
Miller, S., Lavie, D. and Delios, A. (2016) ‘International intensity, diversity, and distance: unpacking the internationalization-performance relationship’, International Business Review, Vol. 25, No. 4, pp.907–920.
Morck, R. and Yeung, B. (1991) ‘Why investors value multinationality’, Journal of Business, Vol. 64, No. 2, pp.165–187.
Narayanan, V. (2015) ‘Export barriers for small and medium-sized enterprises: a literature review based on Leonidou’s model’, Entrepreneurial Business and Economics Review, Vol. 3, No. 2, pp.105–123.
Nitsch, D., Beamish, P. and Makino, S. (1996) ‘Entry mode and performance of Japanese FDI in Western Europe’, Management International Review, Vol. 36, No. 1, pp.27–43.
Pangarkar, N. (2008) ‘Internationalization and performance of small and medium-sized enterprises’, Journal of World Business, Vol. 43, No. 4, pp.475–485.
Qian, G. (2002) ‘Multinationality, product diversification and profitability of emerging US small and medium sized enterprises’, Journal of Business Venturing, Vol. 17, pp.611–633.
Randøy, T. and Goel, S. (2003) ‘Ownership structure, founder leadership, and performance in Norwegian SMEs: implications for financing entrepreneurial opportunities’, Journal of
Business Venturing, Vol. 18, No. 5, pp.619–637.
Riahi-Belkaoui, A. (1998) ‘The effects of the degree of internationalization on firm performance’,
International Business Review, Vol. 7, pp.315–321.
Rumelt, R. (1991) ‘How much does industry matter?’, Strategic Management Journal, Vol. 12, No. 3, pp.167–185.
Shleifer, A. and Vishny, R. (1986) ‘Large shareholders and corporate control’, The Journal of
Political Economy, Vol. 94, Nos. 3–1, pp.461–488.
Siddharthan, N. and Lall, S. (1982) ‘Recent growth of the largest US multinationals’, Oxford
Singla, C. and George, R. (2013) ‘Internationalization and performance: a contextual analysis of Indian firms’, Journal of Business Research, Vol. 66, No. 12, pp.2500–2506.
Sousa, C. and Tan, Q. (2015) ‘Exit from a foreign market: do poor performance, strategic fit, cultural distance, and international experience matter?’, Journal of International Marketing, Vol. 23, No. 4, pp.84–104.
Stouraitis, V., Mior Harun, M. and Kyritsis, M. (2017) ‘Motivators of SME initial export choice and the European Union regional effect in manufacturing’, International Journal of
Entrepreneurial Behavior & Research, Vol. 23, No. 1, pp.35–55.
Temouri, Y., Driffield, N. and Anon Higon, D. (2008) ‘Analysis of productivity differences among foreign and domestic firms: evidence from Germany’, Review of World Economics, Vol. 144, No. 1, pp.32–54.
Thomas, D. and Eden, L. (2004) ‘What is the shape of the multinationality-performance relationship?’, Multinational Business Review, Vol. 12, No. 1, pp.89–110.
Thomsen, S. and Pedersen, T. (2000) ‘Ownership structure and economic performance in the largest European companies’, Strategic Management Journal, Vol. 21, No. 6, pp.689–705. Trapczynski, P. and Banalieva, E. (2016) ‘Institutional difference, organizational experience, and
foreign affiliate performance: evidence from Polish firms’, Journal of World Business, Vol. 51, pp.826–842.
Tsao, S-M. and Chen, G-Z. (2012) ‘The impact of internationalization on performance and innovation: the moderating effects of ownership concentration’, Asia Pacific Journal of
Management, Vol. 29, pp.617–642.
Venkatraman, N. and Ramanujam, V. (1986) ‘Measurement of business performance in strategy research: a comparison of approaches’, Academy of Management Review, Vol. 11, No. 4, pp.801–814.
Vieira, E. (2017) ‘Debt policy and firm performance of family firms: the impact of economic adversity’, International Journal of Managerial Finance, Vol. 13, No. 3, pp.267–286.
Vithessonthi, C. (2016) ‘Capital investment, internationalization, and firm performance: evidence from Southeast Asian countries’, Research in International Business and Finance, Vol. 38, pp.393–403.
Vithessonthi, C. and Racela, O. (2016) ‘Short and long-run effects of internationalization and R&D intensity on firm performance’, Journal of Multinational Financial Management, Vol. 34, pp.28–45.
Xiao, S., Jeong, I., Moon, J., Chung, C. and Chung, J. (2013) ‘Internationalization and performance of firms in China: moderating effects of governance structure and the degree of centralized control’, Journal of International Management, Vol. 19, pp.118–137.
Yudaeva, K., Kozlov, K., Melentieva, N. and Ponomareva, N. (2003) ‘Does foreign ownership matter’, Economics of Transition, Vol. 11, No. 3, pp.383–409.
Zaheer, S. (1995) ‘Overcoming the liability of foreignness’, Academy of Management Journal, Vol. 38, No. 2, pp.341–363.
Zaheer, S. and Hernandez, E. (2011) ‘The geographic scope of the mnc and its alliance portfolio: resolving the paradox of distance’, Global Strategy Journal, Vol. 1, pp.109–126.