Contents lists available atScienceDirect
Global Ecology and Conservation
journal homepage:www.elsevier.com/locate/gecco
Original research article
Do the passerine traits’ dynamic patterns indicate the
ecological status of agro-forestry ecosystems? A modelling
approach for ‘‘Montado’’ management assessments
Tilahun Mulatu
a,b,c,*
, Rita Bastos
b, Mário Santos
b, José Paulo Sousa
c,
Pedro Martins da Silva
c, João Alexandre Cabral
baChair of Ecosystem Planning and Management, Ethiopian Institute of Architecture, Building Construction and City Development, Addis Ababa University, P.O.Box 518, Addis Ababa, Ethiopia
bLaboratory of Applied Ecology, CITAB - Centre for the Research and Technology of Agro-Environment and Biological Sciences, Universidade de Trás-os-Montes e Alto Douro, 5000-911, Vila Real, Portugal
cCentre for Functional Ecology, CFE – Department of Life Sciences, University of Coimbra, Calçada Martim de Freitas, 3000-456, Coimbra, Portugal
a r t i c l e i n f o
Article history: Received 13 May 2016
Received in revised form 2 September 2016 Accepted 2 September 2016
Available online 27 September 2016 Keywords:
Oak agro-forestry systems Montado
Land use/land cover dynamics Passerine functional trait Stochastic Dynamic Methodology
a b s t r a c t
Context The ‘‘Montado’’, a human shaped oak agro-forestry dominated landscape of South
Western Europe has been experiencing series of changes following the implementation of different agricultural policies. Such changes are responsible for shifting the structure and composition of ‘‘Montado’’ landscape and hence the biodiversity of the system, either by agriculture abandonment or intensification. Traditional oak agro-forestry management practices, which focused on improving the ecological status of a single and common land use (oak agro-forestry), is taken as a conservation paradigm against the perceived changes in the system.
Aims We aimed to identify the effect of oak agro-forestry management on ‘‘Montado’’ biodiversity as indicator for ecological status of ‘‘Montado’’ landscape.
Methods A recently developed spatially explicit Stochastic Dynamic Methodology (StDM)
was applied to model the spatial and temporal patterns of the land use/land cover changes and predict responses in biodiversity patterns, with a focus on passerine functional traits (grassland, woodland and generalist species richness), considering scenarios with and without oak agro-forestry management.
Results Model outputs showed that oak agro-forestry management favored the expansion
of oak agro-forestry at the expense of other land uses, mainly oak forest and agricultural areas. On the other hand, passerine richness exhibits a gradual decline facing the intensifi-cation of oak agro-forestry management practices, with higher declining rate observed for grassland passerine species.
Conclusion The oak agro-forestry management does not seem to improve the ecological
status of ‘‘Montado’’ landscape, and neither does its abandonment. Hence the conservation paradigm should focus on improving the multi-functionality of the system than merely focusing on a single and common land use
© 2016 The Authors. Published by Elsevier B.V. This is an open access article under the CC BY-NC-ND license (http://creativecommons.org/licenses/by-nc-nd/4.0/).
*
Corresponding author at: Chair of Ecosystem Planning and Management, Ethiopian Institute of Architecture, Building Construction and City Development, Addis Ababa University, P.O.Box 518, Addis Ababa, Ethiopia.E-mail address:[email protected](T. Mulatu). http://dx.doi.org/10.1016/j.gecco.2016.09.001
2351-9894/©2016 The Authors. Published by Elsevier B.V. This is an open access article under the CC BY-NC-ND license (http://creativecommons.org/ licenses/by-nc-nd/4.0/).
are being abandoned (Jones et al., 2011). The ‘‘Montado’’ (‘‘Dehesa’’ in Spain) is a traditional human shaped oak agro-forestry dominated system of Iberian Peninsula that has been experiencing series of changes due to the CAP implementation, compromising land use multi-functionality and biodiversity (Beaufoy, 2013).
The ‘‘Montado’’ landscape comprising around 23% of forested land in Portugal (Surovà et al., 2001) characterized by a mosaic of different land use types ensured by the multi-functionality of the typical agricultural practices. This system is dominated by oaks (Quercus suber L. and Quercus ilex Lam.) and recognized as a single and generic land use type of traditional oak agro-forestry (Pinto-Correia and Godinho, 2013). The ‘‘Montado’’ system comprises diverse management options i.e. agriculture, oak agro-forestry including livestock farming and forestry with different ecological roles that contribute to maintain biodiversity as a whole (Beaufoy, 2013). Therefore, the idea of representing the multi-functional ‘‘Montado’’ system as a single land use type (oak agro-forestry) has revealed widely differing views on how and what to measure for quantifying the real complexity of such heterogeneous systems (Pinto-Correia and Godinho, 2013).
Traditional management practices in ‘‘Montado’’ system has contributed for maintaining the ecological status of the system. These management practices, in the context of this research, include diverse anthropogenic influences in the system, such as shrub clearance, extracting tree barks of oak for its use as wine bottle stopper, diverse agro-forestry activities in the system (Acácio, 2009). According toPinto-Correia and Mascarenhas(1999), the main agricultural changes are either: (1) the abandonment of oak agro-forestry management or (2) the intensification of agriculture, both altering the structure and functioning of the system. Additionally, the abandonment of oak agro-forestry management is responsible for the expansion of shrub communities on non-fertile and dry lands and for the increasing area of woodland forests on fertile and humid areas (Acácio, 2009). Conversely, the agricultural intensification involving oak forest exploitation for cork, charcoal and livestock production is also responsible for compromising both its health and productivity and for reducing heterogeneity in the system (Pinto-Correia and Mascarenhas, 1999). The conservation paradigm for the entire ‘‘Montado’’ landscape is focused on improving the ecological status of oak agro-forestry areas through minimizing either the effect of agricultural intensification or abandonment of oak agro-forestry management (Pinto-Correia and Mascarenhas, 1999). However gearing conservation efforts only on a dominant land cover may not necessarily leads to conservation of a multifunctional landscape like ‘‘Montado’’. Hence, the implication of this conservation paradigm on the biodiversity and ecological status of ‘‘Montado’’ system is of utmost importance. This particular research is aimed at evaluating the efficiency of this conservation paradigm toward maintaining the ecological status of ‘‘Montado’’ landscape using robust ecological indicators.
The use of ecological indicators is crucial for investigating changes taking place in a given environment (Lindenmayer, 1999;Dale and Beyeler, 2001;Carignan and Villard, 2002;Niemi and McDonald, 2004). Although the relations between birds and agricultural changes are complex, some studies have been produced using birds as ecological indicators in agro-ecosystems (e.g. Suárez-Seoane et al., 2002;Santos and Cabral, 2004;Cabral et al., 2007;Sirami et al., 2008). In a previous overview of this problematic in Mediterranean agro-ecosystems,Santos and Cabral(2004) suggested that passerine communities present several characteristics that have justified their relevance as ecological indicators namely: (1) they usually occur in high densities in the studied habitats, (2) they are functionally placed at an intermediate position in the food webs (Moreby and Stoate, 2001), (3) they provide cheap and easy measurements (due to their conspicuous nature) if standard methodologies are applied (Bibby et al., 1992;Ralph et al., 1993), (4) they are sensitive to landscape and agricultural changes from microhabitat to landscape level (Saab, 1999;Carignan and Villard, 2002), (5) for many species, demography, behavior, distribution and phenology are connected with seasonal and spatial changes in farming practices (Ormerod and Watkinson, 2000), and (6) they have the capacity for population recovery in response to good management practices in previously disturbed ecosystems (Kati et al., 2004;Schulze et al., 2004). The use of multiple species as ecological indicators is crucial for understanding the global response of species richness to disturbance at a community level (Kati et al., 2004;
Schulze et al., 2004). When these species are grouped into trophic guilds is even more efficient in reflecting the ecological response to land use gradients, both in composition and functioning terms (Santos and Cabral, 2004). The categorization of foraging behavior traits among bird species represent an added-value in order to model distinct response of birds to changes in grassland and woodland ecosystems (Preiss et al., 1997), facilitating to understand the ecological consequences, namely in terms of total bird species richness distribution, associated with the gradient of land use changes expected to occur in the study area.
With regard to how anthropogenic environmental changes will affect the abundance of species, the definition of guilds, traits or richness as indicators within communities in disturbed ecosystems is a great challenge in most ecological integrity studies (Andreasen et al., 2001). Conventionally, such potential indicators are usually estimated by using biological indices, which reduce the dimensionality of complex ecological datasets to a single univariate statistics and ordination methods (e.g.
Cabral et al., 2007). Nevertheless, when the time factor is present within the data, biological indices are unable to estimate, in a comprehensible way, the structural changes when the habitat conditions are substantially changing (Jørgensen and De Bernardi, 1997). Therefore, ecological integrity studies have been improved by creating spatially explicit dynamic models that simultaneously attempt to capture the structure and composition in systems affected by long-term environmental disturbances (e.g. Bastos et al., 2012). These are, for instance, the impacts resulting from the implementation of new agricultural paradigms (Santos and Cabral, 2004).
In this scope, since many of the ecosystem phenomenological aspects are holistic, the main vocation of the Stochastic Dynamic Methodology (StDM) is a mechanistic understanding of the holistic ecological processes, based on statistical parameter estimation methods (Santos et al., 2013). This study is based on the premise that the general statistical patterns of ecological phenomena are emergent indicia of complex ecological processes that do indeed reflect the operation of universal law-like mechanisms (Cabral et al., 2007). StDM was already used, tested and validated for modeling the trend of ecological indicators in response to dynamic environmental scenarios in different contexts (Silva-Santos et al., 2006;Cabral et al., 2007;
Cabecinha et al., 2009;Santos et al., 2010;Silva-Santos et al., 2010;Bastos et al., 2012;Hughes et al., 2012;Carvalho et al., 2013;Bastos et al., 2016).
The main objective of the current study is to recreate the drivers’ dynamics acting on ‘‘Montado’’ land uses, anticipating the ecological consequences of such changes for the passerine community as a whole, expressed by the respective main functional traits under with and without oak agro-forestry management scenarios. The information obtained from this study is used to evaluate the currently operating management options and to come up with a suitable tool to support decision-making in the scope of the need for rapid, standardized and cost-saving assessment methodologies for a better conservation of the ‘‘Montado’’, ensuring its relevance for biodiversity.
For demonstration purposes, our approach tested two possible contrasting scenarios, which should involve either oak agro-forestry management intensification (scenario 1) or abandonment of oak agro-forestry management (scenario 2). According to CLC classification, the specific land use type that represents the typical ‘‘Montado’’ system is oak agro-forestry (Bossard et al., 2000;Pinto-Correia and Godinho, 2013). Therefore, for understanding the effect of management activities on the biodiversity of the ‘‘Montado’’, the scenario 1 (with oak agro-forestry management i.e. considering oak reforestation and shrub management) prevents any change from oak agro-forestry to other type of land uses while allowing changes from any other land use type to oak agro-forestry. Conversely, in the scenario 2 (without oak agro-forestry management) the LU/LC abandonment was simulated by changes from the typical ‘‘Montado’’ system (oak agro-forestry) to deep woodland (oak forest) or shrub land.
2. Material and methods
2.1. Study area
The study area is an administrative region of central Portugal, the Samora Correia county. The study area (8◦ 56′
W and 38◦
45′
N;Fig. 1) comprises 30,578 ha of ‘‘Montado’’ landscape. The area is characterized by typical Mediterranean climate with ‘‘mean annual rainfall of 669 mm and mean annual temperature of 16.8◦
C’’ (see for climate data athttp: //en.climate-data.org/location/507327/). The altitude of the study area ranges from 8 to 46m (see for elevation map athttp:
//www.floodmap.net/Elevation/Elevationmap/?gi=226386). The western and northern part of the study area is dominated
by areas that are under significant human influence, represented mainly by intensive agriculture (7014 ha) and built-up areas (642 ha). The southern and central part of the study area is dominated by oak forest (9887 ha), frequently interspersed by pastures, arable lands, agricultural lands, eucalyptus, and coniferous forests. The CLC information for other land covers including complex cultivation patterns, permanent crops (fruit trees and berry plantation, olive groves, vineyards), and water bodies was not extracted by the buffers around each sampling point. Therefore, these land covers (grouped here as unclassified land covers inFig. 1) and built-up area will remain constant in our dynamic model without causing any effect on our response variables.
2.2. Bird species survey and sampling point characterization
The species data for the current study was taken from bird counts carried out on the BioAssess project. BioAssess project was a pan European project that aimed to assess biodiversity changes resulting from different land use management systems in different European countries (Silva, 2012). In Portugal, six sampling sites (Fig. 1) were selected within the study area, namely in oak forests (site 1), eucalyptus forests (site 2), in oak forests with a gradual decrease of tree density (increasing degree of fragmentation) (sites 3, 4 and 5), and in agricultural areas (site 6). Sampling within each site was based on a regular square grid of 16 sampling points (4 by 4 points spaced out by 200 m). Bird census was obtained using point counts at each sampling plot, during the years 2001 and 2002. In each year, bird sampling was undertaken in four separate visits spread throughout the passerine reproductive season (i.e. from March to June). Bird species were recorded by sound and sight at each sampling plot during five minutes (Bibby et al., 1992). Counts were made in dry weather conditions with little wind, starting at dawn or soon thereafter. During each 5 min count the observer recorded all birds, as long as they were deemed to be using the square (e.g. for nesting, displaying, hunting) into distance bands of 0–25 m, 25–50 m, 50–100 m and
>
100 m from the sampling point. The bird surveys were all performed by the same ornithologist.A total of 39 passerine species identified were considered for grouping the respective richness in foraging traits (Appendix A,Table A.1). Non-passerines were excluded due to the possibility of their distribution patterns not directly connected with seasonal and spatial oak agro-forestry changes at the microhabitat/local scale. Information on the foraging trait of each species identified obtained through consulting wide range of studies includingCramp et al.(1977–1994),
Fig. 1. (a) Location of Iberian peninsula and Portugal in Europe, (b) Location of the study area (Samora Correia county) in Portugal and (c) Location of the
six selected sampling sites and land use (LU) backgrounds (LU1 — Oak forest; LU2 — Eucalyptus forest; LU 3, LU 4 and LU 5 — Oak forest with a gradual increasing degree of fragmentation and LU 6 — Agricultural areas) for field data collection on bird counts, including land use/cover variables assessment within a 500 m buffer around sampling points.
Fradet(1998),Antczak et al.(2004),Surmacki(2004) andPark et al.(2008) is used to categorize the 39 species into their respective trait groups i.e. grassland, woodland and generalist species (Appendix A,Table A.1).
A buffer of 500 m around each sampling point (Heikkinen et al., 2004) was used for LU/LC characterization using the vector format of Corine Land Cover 2000 (CLC2000,EEA, 2009), from where a total of fourteen CLC LU/LC categories were associated with our sampling points (Appendix B,Table B.1). In this context, agri-natural vegetation (AV) was characterized as areas mainly occupied by agriculture with significant extents of natural vegetation. Permanently irrigated arable lands and rice fields were considered as agricultural areas (AG), while shrub lands (including moors and heath lands) and transitional shrub lands were considered generically as shrub lands (S). Natural grasslands were considered as non-irrigated arable lands (NA). Industrial or commercial units, sport and leisure facilities were merged as built-up areas (BA). Since the CLC layer does not differentiate oak forest (F) and eucalyptus forests (E) (both described as broad-leaved forest), additional data from the COS90layer (i.e. Portuguese LU/LCmap for 1990) (DGT, 2016) was used to identify the eucalyptus forests distribution within the known distribution of broad-leaved forest in the study area. The distribution of the two oak species (Quercus suber L. and
Quercus ilex Lam.) is merged as oak forest distribution since the CLC2000 does not differentiate the distribution of the two
species. Additionally, a wide variety of landscape metrics (Appendix C,Table C.1) were calculated to characterize each of the 89 monitored points using Fragstats 4.2.1⃝R
(McGarigal and Marks, 1994).
2.3. Statistical analysis
Generalized Linear Models (GzLM) were used to test for the relationships between response and explanatory variables. The response variables are the richness of each passerine foraging trait considered, representative from woodland, grassland and generalist species, whereas the explanatory variables are the prevailing environmental conditions represented by the percentage of area occupied by each land use class or landscape metric (Table 1). The data summary for these metrics (Appendix D.1, supplementary materials online) is available as supplementary material online. In order to avoid multi-collinearity, predictors for the passerine traits were tested for pair-wise correlation using Spearman’s rho correlation coefficient and only predictors with correlation lower than 0.7 (Wisz and Guisan, 2009) and Generalized Variance Inflation Factor lower than 5 were considered (Neter et al., 1996) (Table 1). To overcome the dependence on sample size and to allow comparability among models, the Akaike Information Criterion (AIC) was calculated for each model to rank the candidate models (Burnham and Anderson, 2002). The GzLM were run (with a Poisson variance distribution and log-link function) considering all (valid) combinations of explanatory variables for the passerine trait richness. The best model was selected according to the lower value of AIC and incorporated into the StDM model construction (Table 2). The statistical analysis was carried out using the statistical analysis software GenStat 13.0⃝R
Table 1
The selected land use/land cover explanatory variables (after Spearman’s correlation and Variance Inflation Factor test) and their respective variable codes used in the GzLM analysis.
Selected independent variables
Level Variable code Description
Patch F_AREA Patch area of oak forest in hectares Class F_PLAND Percentage of oak forest
Class NA_PLAND Percentage of non-irrigated arable land Class AF_PLAND Percentage of oak agro-forestry Class C_PLAND Percentage of coniferous forest Class AG_PLAND Percentage of agricultural areas Class AV_PLAND Percentage of agri-natural vegetation Class S_PLAND Percentage of shrub land
Class F_PARA_MN Parameter to area ratio for oak forest Landscape PR Patch richness
Table 2
The regression equations, degrees of freedom (DF), the coefficient of determination (Pseudo R2 aj), F-values, their significance level for all combinations reported and AIC value, as selected by GzLM analysis for foraging trait groups. The specification of all variables is expressed inTable 1.
Equation DF Pseudo R2
aj F P AIC
Richness woodland species (Rwood) log(Rwood)=1.29+0.0109 5 73.55 28.14 <0.001 91.16 (NA_PLAND)−0.02138 (AG_PLAND)+0.00414 (AF_PLAND )−0.0000896 (F_AREA)+0.00759 (F_PLAND) Richness grassland species (Rgrass) log(Rgrass)=0.776+0.01187 4 57.18 9.41 <0.001 91.5 (AG_PLAND)+0.0712 (AV_PLAND)+0.01074 (AF_PLAND )+0.00869 (F_PLAND)
Richness generalist species (Rgen) log(Rgen)=1.120−0.00987
4 61.76 10.33 <0.001 89.56 (AG_PLAND)+0.00469
(F_PLAND)+0.0107 (C_PLAND)+0.0599 (PR)
F_PLAND — Percentage of oak forest, NA_PLAND — Percentage of non-irrigated arable land, AF_PLAND — Percentage of oak agro-forestry, C_PLAND — Percentage of coniferous forest, AG_PLAND — Percentage of agricultural areas, AV_PLAND — Percentage of agri-natural vegetation, F_AREA — Patch area of oak forest in hectares, PR — Patch richness.
2.4. Conceptualization of the spatially explicit StDM
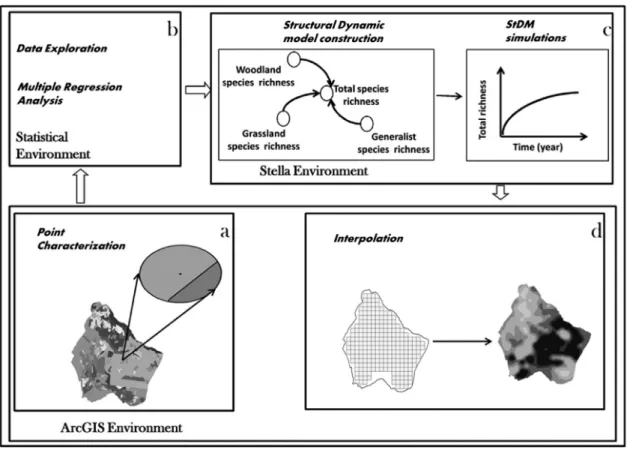
The StDM protocol proposed is based on the relationships analyzed in the previous statistical procedures, supported by datasets that include variability gradients of the most significant explanatory variables of the studied habitats. Sequences of different steps (including the preliminary land use characterization of the sampling points) are interrelated within the spatially explicit StDM framework. In a holistic perspective, the partial regression coefficients (Table 2) represent the global influence of the selected land use (explanatory) variables that are representative of several habitats and complex ecological processes in each 500 m buffer around the sampling points (Fig. 2(a)). After, three main steps are performed which include linking the outputs from statistical analysis (GzLM;Fig. 2(b)) to the dynamic model construction system (StDM;Fig. 2(c)) and the final integration of those outputs into a Geographic Information System (GIS;Fig. 2(d)) to obtain spatially explicit StDM outputs.
2.5. Dynamic model construction
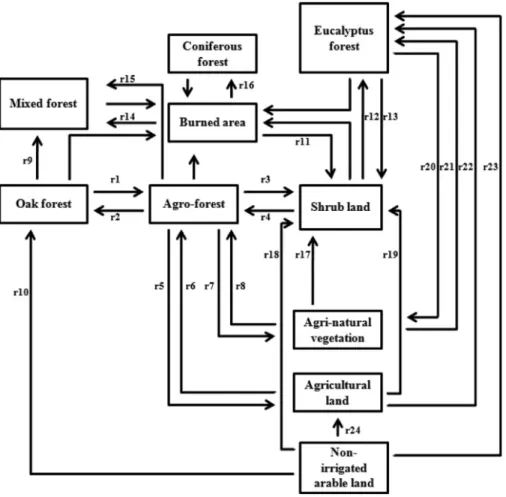
In order to recreate changes in the prevalent LU/LC types for each study unit, succession rates of the representative LU/LC dynamics at the study unit level (1 km2) were considered in the conceptual model (Fig. 3). For the dynamic model
parameterization, the available data on history of land use dynamics in the ‘‘Montado’’ system i.e. the rates of change between the respective land uses/covers in the system determined through aerial photo interpretation of land use/cover for the last 45 years (Acácio, 2009) and 15 years (Silva et al., 2011) was used to estimate the annual rates (Fig. 3) of changes between
Fig. 2. The general framework of the spatially explicit StDM and the steps involved for (a) Land use characterization of sampling points, (b) Statistical
multivariate regression analysis to define the convenient parameters that contextualize the habitat descriptors at lower scales, (c) Construction of the dynamic model, which allows the StDM simulations of passerine traits’ responses, (d) Spatial projection of the resultant stochastic dynamic simulations per study unit and geographical interpolation enabling the creation of spatio-temporal patterns for passerine traits’ responses.
the different land uses/covers. To calculate these annual rates (AR) the following formula was used (Chaves et al., 2000): AR
= [
(1+
ATR) exp(1/
TIY)] −
1where, ATR is the actual total rate inferred fromSilva et al.(2011) andAcácio and Holmgren(2014) and TIY is the time interval in years (Appendix E.1, supplementary materials online). Therefore, the main transition and/or ecological succession processes among the LU/LC considered were used to mediate the condition flows between oak forest, oak savannah, and shrub community (Fig. 3).
The oak savanna (oak agro-forestry) stands represent the typical ‘‘Montado’’ system with understory management/grazing (Bossard et al., 2000). From the analysis ofAcácio and Holmgren(2014), the oak savannas represent previous successional stages of shrub and oak forests whereas direct changes from oak forest to shrub land result from forest fire or drought in the region. The change from shrub land to oak forest occurs only if there is a strict restoration of oak forest in the region.
The basic principle of StDM protocol is given by the system dynamics balance between gains and losses of state variables, described by difference equations, which acts as environmental influences on response variables mediated by the respective partial regression coefficients. The StDM explanatory variables represent the different LU/LC types of the ‘‘Montado’’ landscape which are intricately linked to one another and determine the passerine species richness composition. Stochastic forest fire events were incorporated into the model to understand the effect of this potential driver on LU/LC dynamics. A fire occurrence probability once in 62 years was obtained from geographic information on annual burnt areas for the study area (ICNF, 2016). Accordingly, a random fire occurrence once in 62 years was used for the current model. The impact of fire (fire intensity) also made to vary randomly between zero (no effect) to one (total removal of a particular LU/LC within a study unit). After the calibration procedures, the average number of 4.21
±
1.66 fires per km2 (mean±
standarddeviation) obtained per study unit in 50 years of simulation, from 100 independent stochastic simulations, was considered a reliable reproduction of the regional historical trends of fire events with an average value of 3.91
±
2.82 fires per km2 (mean±
standard deviation).Different extent of fire proneness was considered since each LU/LC is characterized by specific resistance to fire (Silva et al., 2009). The fire proneness for agricultural areas and land uses/covers without forest/shrub cover i.e. agri-natural vegetation and non-irrigable arable land is not incorporated in the model since these land uses/covers are insignificantly affected by
Fig. 3. The conceptual diagram showing the main land use/cover (LU/LC) dynamics between oak forest, oak agro-forestry, shrub land and other land use
types with influence on the passerine traits’ dynamics (StDM response variables). Arrows indicate the flows between LU/LC types, the processes (r1) to (r24) represent the estimated annual rates for the expected changes between the respective LU/LC types. Arrows without labels represent the changes from LU/LC types into burned areas which is determined by fire occurrence probability and the fire proneness of respective LU/LC types. The remaining land use i.e. built-up area is not included in the conceptual diagram assuming that it will remain the same throughout the simulation period.
forest fire (Jaiswal et al., 2002). The time unit chosen was the year and the simulation was established for a period of 30 years. StDM conceptual sub-models of land use dynamics, fire probability and burned areas, patch richness and response variables (Appendix F — Figure F.1 to Figure F.5) and the equation for explanatory (land use) variables, response variables (bird species richness) and for fire probability, fire proneness, actual total rate of change, time for change and management options used in StDM model construction (Appendix G — Table G.1 to Table G.4) are available as supplementary materials online. For the development of the StDM dynamic model, the software STELLA 9.0.3⃝R
was used.
2.6. Spatio-temporal projections
To generate stochastic dynamic projections of the passerine foraging groups distribution facing the LU/LC changes expected for the study area (comprising a total of 252 grid cells or study units), every study unit was characterized considering the available initial land cover data for the year 2000 (t
=
0) (Appendix D.1, Supplementary materials online). Since the dynamic model simulations are influenced by stochastic factors associated with fire events, 100 independent simulations per study unit were carried out in order to capture the average local species richness trends of the passerine foraging groups, assuming the time frames of 1st, 15th and 30th year for demonstration purposes. Although the combination of all study units captures the main gradients of the habitats that characterize the study area, each spatial output per study unit only represents a preliminary discrete contribution for the global pattern of the passerine traits spatial occurrence. Therefore, in order to incorporate spatial autocorrelation among species richness per study unit (Zhang and Murayama, 2000), an ordinary kriging interpolation was selected, taking into consideration the type of data that resulted from the StDM simulations (i.e. with continuous, non-discrete distribution and the absence of normally distributed data) and the expected spatial relations between point data (Sherman, 2011) for the overall study area (regional scale). Additional study units, located at the external borders of the study area, were simulated for interpolation purposes in order to incorporate patternsof locations were grouped into appropriate distance class to capture local variation between neighboring sample points (lag size of 0.015 km2) (Jopp et al., 2010). Finally, we tested the fitting of the interpolated results (in relation to the modeled
data) by cross validating the predictions of the spatial model with the results from the StDM simulations for each study unit (Bastos et al., 2012). This interpolation contributes to produce spatial patterns of the response variables, creating an integrative picture, in space and time, of the passerine richness’ responses to the gradients of habitat changes, both with oak agro-forestry management (scenario 1) and without oak agro-forestry management (scenario 2). The spatial analyses were carried out using ArcGIS⃝R
10.2.1 Geographic Information System software.
3. Results
3.1. Bird species richness simulation
Woodland passerine species showed an expectable positive correlation with forest related variables (F_PLAND and AF_PLNAD) and an inverse trend with agricultural areas (AG_PLAND) (Table 2). However, this foraging trait also shows positive relationships with other non-forest related land cover, non-irrigated arable land (NA_PLAND), and a negative relationship with the patch area of oak forest (F_Area). The grassland species displayed positive relationships with the influence of both forest and non-forest related variables, however agri-natural vegetation (AV_PLAND) has the predominant effect on this trait response. Generalist species showed a contrasting response to grassland species, being positively associated with forest related variables and negatively with non-forest related variables. Unlike woodland and grassland species, generalist species also showed a positive correlation with the coniferous forests (C_PLAND) and patch richness (PR) influences.
3.2. LU/LC dynamics simulation
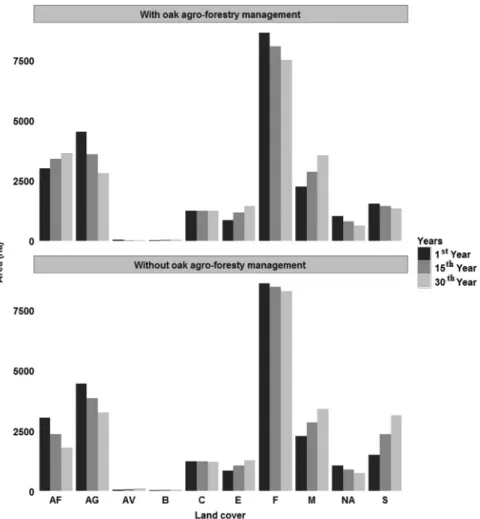
Under scenario 1, agri-natural vegetation, oak forest, agricultural and non-irrigated arable land exhibits a declining pattern (Fig. 4). The same pattern was also evident under the scenario 2, but with higher decline rates in scenario 1. In scenario 1, oak agro-forestry showed an increase through time together with burnt areas, mixed forest and eucalyptus forest in contrast to what is observed for scenario 2. In consequence, shrub land showed a clear declining pattern through time in the scenario 1. However coniferous forest remains stable for the entire period of simulation.
For the scenario without oak agro-forestry management (scenario 2), the entire thirty year period of prediction showed a declining trend for oak forest, oak agro-forestry, agricultural and non-irrigated arable land, while shrub land, burned areas, agri-natural vegetation, mixed and eucalyptus forest showed an inversing trend. However, the coniferous forest remained stable for the whole period, similar to what was observed under the scenario 1.
3.3. Passerine species richness trends facing ‘‘Montado’’ contrasting scenarios 3.3.1. Trends in foraging traits
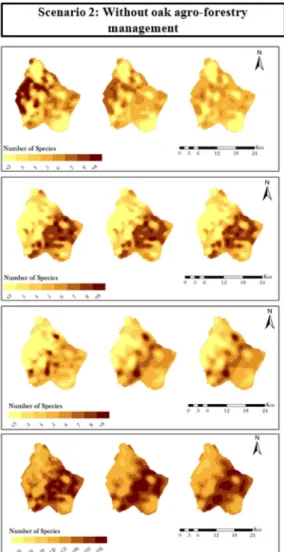
The spatial projections (Fig. 5) indicate temporal and spatial variability among different locations within the study area, for both scenarios. Species richer areas for grassland species were found in the eastern verges of the study area while for woodland species the distribution is mainly coincident with the central and western part of the study area. The projected maps for grassland species in both scenarios show a decline in richness for the most favorable areas (with more than eight species observed per grid cell). These richer areas, that were originally concentrated in eastern margin of the study area, declined leaving small areas with no more than seven species per grid cell. Under scenario 2, the same declining pattern in species richer areas was observed, although with lower rates compared with the scenario 1.
The projected maps for woodland species show a declining pattern in species richer areas for both scenarios. These areas, originally distributed in the central and western part, become more fragmented during the last period of simulation. Although both grassland and woodland species experience decline in both scenarios, the decline for grassland species is comparatively more pronounced than for woodland species.
With regard to generalist species, the projected maps showed an increasing pattern of richness distribution along time for both scenarios, although slightly more evident in scenario 1. Looking at the projected map for the three traits, the most favorable location for generalist species occurrence coincides with the interface between the most favorable areas of grassland and woodland species.
3.3.2. Trends in total species richness
The passerine total species richness was obtained by adding up the partial contributions of each trait with the intention of understanding the overall patterns of species responses, at the community level, to land use dynamics. Although the
Fig. 4. The main trends of LU/LC simulated for the study area, considering the time frames of 1st, 15th and 30th year for demonstration purposes. AF — Oak
agro-forestry, AG — Agriculture, AV — Agri-natural vegetation, B — Burned areas, C — Coniferous forest, E — Eucalyptus forest, F — Oak forest, M — Mixed forest, NA — Non-irrigated arable land, S — Shrub land.
average total species richness, obtained from the 252 grid cells in whole study area, showed no significant variation through time, the pattern of heterogeneity among different locations was evident in the study area, ranging from a maximum of 25 species and a minimum of 7 species. The spatial dynamic trends under scenario 1 exhibit a continuous reduction in species richness throughout the thirty years of simulation. By contrast in the scenario 2 the resultant trends show increasing number of species during the first fifteen years, followed by an inverse gradual trend until the end of the simulation.
4. Discussion
4.1. Effect of land use patterns on species diversity
In general, the land use dynamics in the study area facilitates the expansion of areas with intense and intermediate canopy while reducing the proportion of open areas. Moreover, such increase in canopy cover (oak forest, eucalyptus forest and oak agro-forestry areas) was even more pronounced when the scenario of oak agro-forestry management was implemented through avoiding land abandonment and promoting oak reforestation. Coniferous forest remains nearly constant since its dynamics is highly dependent on forest fire occurrence, which is rare in our study area (Silva et al., 2011). Other land cover types including eucalyptus forests showed increasing patterns in both scenarios due to the current increasing trend of converting unproductive agricultural areas into eucalyptus forest (Kardall et al., 1986;Jones et al., 2011).
Overall, the simulation results show that the trends simulated for the foraging traits selected were not indifferent to the habitat changes expected to occur in the studied ‘‘Montado’’ agro-ecosystems, where oak forest and agricultural areas represent the dominant drivers. Woodland passerines were highly associated with the area of oak forest, oak agro-forestry and agri-natural vegetation while showing negative relation with agricultural areas because the activity of most forest adapted passerines is minimal in open systems (Tellería, 2001;Suárez-Seoane et al., 2002;Sirami et al., 2008). However,
Fig. 5. Spatial–temporal patterns for the passerine foraging traits (grassland, woodland and generalist species) and total richness in the study area,
considering both scenarios and the time frames selected for demonstration purposes (1st, 15th and 30th year): with oak agro-forestry management (scenario 1) and without oak agro-forestry management (scenario 2). Rgrass — Grassland species richness, Rwood — Woodland species richness, Rgen — Generalist species richness and Rtot — Total species richness.
despite the increasing trend observed for oak agro-forestry under scenario 1, a higher decline in oak forests was observed since the increasing pattern for oak agro-forestry is not just at the expense of shrub land but also some area from the oak forest is being converted to oak agro-forestry as a result of oak agro-forestry management. This main trend may explain the overall decline observed for woodland passerine species in the region (Preiss et al., 1997) also observed in scenario 1.
On the other hand, the simulations for grassland passerine species seem to be mainly influenced by changes with consequences at forest ecotones, especially between oak forests and agricultural lands, since this foraging trait also includes forest hedge species (Tellería, 2001). Other conventional studies that investigated the effects of changes in hedgerow agricultural practices on passerine bird richness have come to similar conclusions (e.g.Hinsley and Bellamy, 2000;Donald et al., 2002).
Our simulations reveal that generalist species, as well as woodland species, are positively influenced by oak forest and negatively influenced by agricultural areas. This trait is also associated with coniferous forest and total patch richness, which enables them to take advantage of the mosaic of different land cover types (Gil-Tena et al., 2007).
4.2. Spatio-temporal dynamics in the total species richness with and without oak agro-forestry management scenarios
Considering that our reference outputs at the traits level are in agreement with other studies that investigated the ecological consequences of similar agro-forestry changes, which seems to represent a credible modeling performance, the projected maps for the total species richness enable us to discuss the holistic trends at the community level for both scenarios.
The trait groups studied responded to the oak agro-forestry management scenarios simulated, which is consistent with the findings ofGodinho and Rabaça(2011). However, the trait groups analyzed (grassland, woodland and generalist species) responded differently to oak agro-forestry management. In the scenario 1, the decline of grassland species was higher than other trait groups, following the pattern of open area reduction discussed previously and with clear consequences for the species richness depletion of the passerine community distribution patterns as a whole. This is because most grassland species in our region are highly adapted to Mediterranean human shaped systems like ‘‘Montado’’ in coexistence with managed open habitats (Tellería, 2001).Pereira et al.(2014), consistent with our findings, also indicated that oak agro-forestry management is responsible for the decline of insectivorous species, a large proportion of which area are also grassland species in our study area. However, in scenario 2 these consequences are not continuous along the thirty years period since there is a slight increase of total species richness till the fifteen year. This could indicate the importance of reducing disturbance (inherent to oak agro-forestry management intensification) to improve the biodiversity in the system. Nevertheless, further decline in richness will occur when the extent of abandonment increases in the system, namely as a result of its detrimental effect on the traditional ‘‘Montado’’ characteristics.
The simulation results reflect well the shift of the ‘‘Montado’’ oak agro-forestry toward new expected conditions and the indicators proposed are capable of responding with credibility to key changes. Therefore, considering that almost all northern Mediterranean countries are, or will be, regulated by CAP policies, encouraging the intensification of production processes, the study region will probably lose many of its traditional characteristics and the respective ecological integrity will decline (Lautenbach et al., 2011). Agricultural abandonment and intensification are just examples of the drivers and pressures affecting rural areas. In fact, either the expanding or the abandonment of oak agro-forestry at the expense of other important land covers like oak forest and agricultural areas does not result in increasing the total species richness.
An overall understanding of what is happening in ‘‘Montado’’ system showed the gradual decline of specialist species, which mainly comprises grassland and woodland species in Iberian Peninsula, at the expense of increasing generalist species. This may result in functional homogenization and deterioration of ecosystem structure and functioning (Clavel et al., 2011) The fact that grassland species in Mediterranean region are highly adapted to this unique ecosystem that has no its equivalent in other parts of the world will make them more vulnerable to decline and extinction (Tellería, 2001), unless suitable conservationist actions are in implementation. There is a strong need for developing indicator that could be transversally applied to all the diverse land use types in ‘‘Montado’’ landscape (Catarino et al., 2016). As grassland species in the context of Iberian Peninsula showed high association with the typical ‘‘Montado’’ landscape, they should be considered as one of the most suitable and straight forward ecological indicators for long term monitoring of environmental changes occurring in the Iberian Peninsula. Although the spatial projections recreates realistically the known passerine responses to LU/LC changes occurring in Montado regions, some limitations arise when considering validation as a fundamental process to assess the relative accuracy of the model response facing independent real data (Rykiel, 1996). This procedure was not possible in this stage of the study due to the impracticality of a credible validation for simulations that require long-term real datasets concerning future scenarios, which can only be done after several years of collecting relevant site-specific information under well-known local environmental conditions (Glenz et al., 2001;Chaloupka, 2002). However, despite these limitations, the methodology proposed seems to represent a promising starting point, allowing the development of more robust models with introduction of other indicators, interactions and interferences with precise applicable conditions to support effective management decision-making process.
4.3. Implications for land planning and biodiversity conservation strategies in oak agro-forestry systems
Land use management is often focused on few species and local processes, but in highly dynamic agricultural landscapes, only biodiversity conservation may guarantee ecological resilience (Tscharntke et al., 2005). To minimize harmful conse-quences of change and optimize ecosystem services, planning and management depend on the identification of relevant drivers, their corresponding scales and effects on key structures, functions and services, as well as the integration of information in multi-scale, dynamic, process-based tools for decision making (Hibbard et al., 2010).
Overall, the spatially explicit StDM framework, applied in this study, seems to represent a useful contribution to predict key changes in the foraging traits selected, namely by quantifying its main distribution area under different management scenarios. Moreover, the proposed framework allows not only the direct interpretation of the local dynamic trends at the ecological traits level, but also the visualization of their emergent spatial distribution at a community level and regional scale. The obtained simulation results seem to demonstrate the feasibility of the approach in capturing the dynamics of potential ecological indicators by predicting the behavioral pattern for key components selected under complex and variable environmental scenarios. Therefore, since habitats are characterized by a high degree of heterogeneity in space and time, influenced by many interacting factors and feedback mechanisms, this multi-scale approach is particularly helpful to capture these influences toward the definition of the ‘‘Montado’’ ecological status.
5. Conclusion
The management paradigm for a human shape oak agro-forestry dominated ‘‘Montado’’ system does not seem to improve the ecological status of ‘‘Montado’’ landscape. In highly diversified oak agro-forestry landscape like ‘‘Montado’’, the mere focus on conserving single and dominant land uses/covers does not necessarily leads to conservation of the entire
Acrocephalidae Hippolaispolyglotta Melodious Warbler I
Aegithalidae Aegithaloscaudatus Long-tailed Tit W
Alaudidae Calandrellabrachydactyla Short-toed Lark G
Galeridacristata Crested Lark G
Lullulaarborea Woodlark G
Certhiidae Certhiabrachydactyla Short-toed Treecreeper W
Cisticolidae Cisticolajuncidis Fan-tailed Warbler G
Corvidae Corvuscorone Carrion Crow G
Cyanopicacyanus Azure-Winged Magpie I
Garrulusglandarius Jay W
Emberizidae Miliariacalandra Corn Bunting G
Fringillidae Cardueliscarduelis Goldfinch I
Carduelischloris Greenfinch I
Fringillacoelebs Chaffinch I
Serinusserinus Serin G
Laniidae Laniusexcubitor/meridionalis Great Grey Shrike G
Lanius senator Woodchat Shrike G
Motacillidae Anthuspratensis Meadow Pipit G
Muscicapidae Erithacusrubecula Robin W
Lusciniamegarhynchos Nightingale W
Phoenicurusochruros Black Redstart G
Phoenicurusphoenicurus Redstart W
Saxicolatorquata Stonechat G
Oriolidae Oriolusoriolus Golden Oriole W
Paridae Paruscaeruleus Eurasian Bluetit W
Paruscristatus eurasianCrestedtit W
Parus major Great Tit W
Passeridae Passer domesticus House Sparrow G
Passer montanus Tree Sparrow I
Petroniapetronia Rock Sparrow G
Phylloscopidae Phylloscopusbonelli/orientalis Bonelli’s Warbler W
Phylloscopusbrehmii Chiffchaff W
Sittidae Sittaeuropaea Eurasian Nuthatch W
Sturnidae Sturnus unicolor Spotless Starling I
Sylviidae Sylvia atricapila Blackcap W
Sylvia melanocephala Sardinian Warbler I
Troglodytidae Troglodytes troglodytes Wren W
Turdidae Turdusmerula Blackbird I
Turdusphilomelos Song Thrush I
Table B.1
The different CLC land use/land cover categories, the respective CLC codes and general description.
CLC Code General Category Description
121 Artificial surfaces Industrial or commercial units 142 Artificial surfaces Sport and leisure facilities
211 Agricultural areas Non-irrigated arable land
212 Agricultural areas Permanently irrigated land
213 Agricultural areas Rice fields
243 Agricultural areas Land principally occupied by agriculture, with significant areas of natural vegetation
244 Agricultural areas Agro-forestry
311 Forest and semi natural areas Broad-leaved forest 312 Forest and semi natural areas Coniferous forest 313 Forest and semi natural areas Mixed forest 321 Forest and semi natural areas Natural grasslands 322 Forest and semi natural areas Moors and heathland 324 Forest and semi natural areas Transitional woodland-shrub
512 Water bodies Water bodies
landscape. ‘‘Montado’’ system is a combination of different land uses that emanates from purely agricultural areas to mature forest. Conserving a single land cover type, oak agro-forestry, may not improve the bird species richness in a system like ‘‘Montado’’, where bird diversity seem to depend on a human shaped mosaic of diverse LU/LC. Rather, bird diversity could be improved through maintaining ‘‘Montado’’ multi-functionality by promoting the coexistence of multiple land uses in the same management paradigm. This can be achieved through understanding the patchwork relationships and recognizing the specific contribution from the combination of diverse land uses, such as those related with agriculture, forest and shrub
Table C.1
The matrices at the level of patch, class and landscape generated using Fragstats 4.2.1⃝R
software.
Landscape
Total area (TA) Largest patch index (LPI) Mean patch area (AREA_MN) Mean radius of gyration (GYRATE_MN) Mean shape index (SHAPE_MN)
Mean fractional dimension index (FRAC_MN) Mean perimeter-area ratio (PARA_MN) Mean related cicumscribing circle (CIRCLE_MN) Mean contiguity index (CONTIG_MN) Patch richness (PR)
Patch richness density (PRD) Shannon’s diversity index (SHDI) Simpson’s diversity index (SIDI) Modified simson’s diversity index (MSIDI) Shannon eveness index (SHEI)
Simpson’s eveness index (SIEI)
Modified simpson’s eveness index (MSIEI)
Class
Total area (TA)
Percentage of landscapes (PLAND) Number of patches (NP) Patch density (PD) Largest patch index (LPI) Largest shape index (LSI) Mean patch area (AREA_MN) Mean radius of gyration (GYRATE_MN) Mean shape index (SHAPE_MN)
Mean fractional dimension index (FRAC_MN) Mean perimeter-area ratio (PARA_MN) Mean related cicumscribing circle (CIRCLE_MN) Mean contiguity index (CONTIG_MN) Clumpiness (CLUMPY)
Interspertion juxtapositon index (IJI) Patch cohesion index (COHESION) Landscape division index (DIVISION) Effective mesh size (MESH) Splitting index (SPLIT) Aggregation index (AI) Normalized LSI (NLSI)
Patch
Patch area (AREA) Patch perimeter (PERIM) Radius of Gyration (GYRATE) Perimeter-area ratio (PARA) Shape index (SHAPE) Fractal dimension index (FRAC) Related circumscribing circle (CIRCLE) Contiguity index (CONTIG)
lands. A clear definition of what ‘‘Montado’’ is still necessary to understand its complexity and for managing the balance between the diverse land uses in order to maintain the multi-functionality of the system. Therefore a new conservation paradigm considering the land use/land cover diversity and its contribution for conserving the biodiversity of ‘‘Montado’’ landscape is of at most importance to improve the ecological status of this threatened landscape.
Acknowledgments
The authors are indebted to all colleagues that carried out the bird surveys in 2001–02 as part of the BioAssess project (EVK2-CT-1999-00041). We are also thankful to the European Master in Applied Ecology (EMAE) and Education, Audiovisual and Culture Executive Agency (EACEA) for funding this research and covering all costs related with graduate study of the first author (Tilahun Mulatu). A special recognition is addressed to the welcome and facilities of CITAB (Centre for the Research and Technology of Agro-Environment and Biological Sciences, University of Trás-os-Montes e Alto Douro), supported by national funds by FCT - Portuguese Foundation for Science and Technology, under the project UID/AGR/04033. Further gratitude is forwarded to Kelly Levitker for proof reading the English of our manuscript.
Appendix B
SeeTable B.1.
Appendix C
SeeTable C.1.
Appendix D-G. Supplementary data
Supplementary material related to this article can be found online athttp://dx.doi.org/10.1016/j.gecco.2016.09.001.
References
Acácio, V.,2009. The Dynamics of Cork Oak Systems in Portugal: The Role of Ecological and Land Use Factors(Ph.D. dissertation).Wageningen University. Acácio, V., Holmgren, M.,2014. Pathways for resilience in Mediterranean cork oak land use systems. Ann. Forest Sci. 71 (1), 5–13.
Alonso, J.A., Muñoz Pulido, R., Bautista, L.M., Alonso, J.C.,1991. Nest-site selection and nesting success in the Azure-winged Magpie in Central Spain. Bird Study 38 (1), 45–51.
Andreasen, J.K., O’Neill, R.V., Noss, R., Slosser, N.C.,2001. Considerations for the development of a terrestrial index of ecological integrity. Ecol. Indicat. 1 (1), 21–35.
Antczak, M., Hromada, M., Grzybek, J., Tryjanowski, P.,2004. Breeding biology of the great gray shrike Lanius excubitor in W Poland. Acta Ornithologica 39 (1), 9–14.
Bastos, R., Pinhanços, A., Santos, M., Fernandes, R., Vicente, J., Morinha, F., Honrado, J., Travassos, P., Barros, P., Cabral, J.A.,2016. Evaluating the regional cumulative impact of wind farms on birds: How can spatially explicit dynamic modelling improve impact assessments and monitoring?. J. Appl. Ecol. 53 (5), 1330–1340.
Bastos, R., Santos, M., Ramos, J.A., Vicente, J., Guerra, C., Alonso, J., et al.,2012. Testing a novel spatially-explicit dynamic modelling approach in the scope of the laurel forest management for the endangered Azores bullfinch (Pyrrhula murina) conservation. Biol. Cons. 147 (1), 243–254.
Beaufoy, G., 2013. Progress in identification of HNV farming systems and peculiarities of Mediterranean systems. In: Proceedings of the ICAAM International Conference 2013. Available at: http://www.icaam.uevora.pt/Noticias-e-Informacoes/Agenda/ICAAM-International-Conference-2013-Acknowledging-the-MONTADOS-and-DEHESAS-as-High-Nature-Value-Farming-Systems.
Bibby, C.J., Burguess, N.D., Hill, D.A.,1992. Bird Census Techniques. Academic Press, London and New York.
Bossard, M., Feranec, J., Otahel, J., 2000. CORINE land cover technical guide — Addendum 2000. Available at:http://www.pedz.unimannheim.de/daten/ edzbn/eua/00/tech40add.pdf.
Burnham, K.P., Anderson, D.R.,2002. Information and likelihood theory: a basis for model selection and inference. In: Model Selection and Multimodel Inference: A Practical Information-theoretic Approach. Springer, New York.
Cabecinha, E., Lourenço, M., Moura, J.P., Pardal, M.Â., Cabral, J.A.,2009. A multi-scale approach to modelling spatial and dynamic ecological patterns for reservoir’s water quality management. Ecol. Model. 220 (19), 2559–2569.
Cabral, J.A., Rocha, A., Santos, M., Crespí, A.L.,2007. A stochastic dynamic methodology (SDM) to facilitate handling simple passerine indicators in the scope of the agri-environmental measures problematics. Ecol. Indicat. 7 (1), 34–47.
Carignan, V., Villard, M.A.,2002. Selecting indicator species to monitor ecological integrity: a review. Environ. Monit. Assess. 78 (1), 45–61.
Carvalho, D., Horta, P., Raposeira, H., Santos, M., Luís, A., Cabral, J.A.,2013. How do hydrological and climatic conditions influence the diversity and behavioural trends of water birds in small Mediterranean reservoirs? A community-level modelling approach. Ecol. Model. 257, 80–87.
Catarino, L., Godinho, C., Pereira, P., Luís, A., Rabaça, J.E.,2016. Can birds play a role as High Nature Value indicators of montado system? Agroforestry Syst. 90 (1), 45–56.
Chaloupka, M.,2002. Stochastic simulation modelling of southern Great Barrier Reef green turtle population dynamics. Ecol. Model. 148 (1), 79–109. Chaves, C., Maciel, E., Guimaraes, P., Ribeiro, J.C.,2000. Instrumentos estatísticos de apoio a economia: conceitos básicos. McGraw-Hill, Lisboa.
Clavel, J., Julliard, R., Devictor, V.,2011. Worldwide decline of specialist species: toward a global functional homogenization? Front. Ecol. Environ. 9 (4), 222–228.
Cramp, S., Simmons, K.E.L., Perrins, C.M. (Eds.),1977–1994. The Birds of the Western Palearctic, vols. I–IX, Oxford University Press, Oxford. Dale, V.H., Beyeler, S.C.,2001. Challenges in the development and use of ecological indicators. Ecol. Indicat. 1 (1), 3–10.
DGT, 2016. Carta de ocupação do solo 1990 para Portugal. Available at:http://www.dgterritorio.pt/cartografia_e_geodesia/cartografia/cartografia_tematica/ carta_de_ocupacao_do_solo__cos_/cos__1990/.
Donald, P.F., Pisano, G., Rayment, M.D., Pain, D.J.,2002. The Common Agricultural Policy, EU enlargement and the conservation of Europe’s farmland birds. Agricult. Ecosys. Environ. 89 (3), 167–182.
European Environmental Agency (EEA), 2009. Corine Land Cover (2000). Available at: http://www.eea.europa.eu/data-and-maps/data/corine-land-cover-2000-clc2000-100-m-version-9-2007.
Favaron, M., Massa, R., Zullini, A.,1998. Egg size and reproductive strategies of western palearctic birds. Italian J. Zool. 65 (2), 177–181.
Fidalgo, B., Salas, R., Gaspar, J., Morais, P., 2007. Monitoring land cover change in a forested landscape in Central Portugal. The role of structural indices. México: IVCongreso Internacional de Ordenamiento Territorial (13-16 de noviembre).
Gil-Tena, A., Saura, S., Brotons, L.,2007. Effects of forest composition and structure on bird species richness in a Mediterranean context: implications for forest ecosystem management. Forest Ecol. Manag. 242 (2), 470–476.
Glenz, C., Massolo, A., Kuonen, D., Schlaepfer, R.,2001. A wolf habitat suitability prediction study in Valais (Switzerland). Landsc. Urban Plan. 55 (1), 55–65. Godinho, C., Rabaça, J.E.,2011. Birds like it Corky: the influence of habitat features and management of ‘montados’ in breeding bird communities.
Agroforestry Syst. 82 (2), 183–195.
Heikkinen, R.K., Luoto, M., Virkkala, R., Rainio, K.,2004. Effects of habitat cover, landscape structure and spatial variables on the abundance of birds in an agricultural–forest mosaic. J. Appl. Ecol. 41 (5), 824–835.
Hibbard, K., Janetos, A., van Vuuren, D.P., Pongratz, J., Rose, S.K., Betts, R., et al.,2010. Research priorities in land use and land-cover change for the Earth system and integrated assessment modelling. Int. J. Climatol. 30 (13), 2118–2128.
Hinsley, S.A., Bellamy, P.E.,2000. The influence of hedge structure, management and landscape context on the value of hedgerows to birds: a review. J. Environ. Manag. 60 (1), 33–49.
Hughes, S.J., Cabecinha, E., Andrade dos Santos, J.C., Mendes Andrade, C.M., Mendes Lopes, D.M., da Fonseca Trindade, H.M., et al.,2012. A predictive modelling tool for assessing climate, land use and hydrological change on reservoir physicochemical and biological properties. Area 44 (4), 432–442. ICNF, 2016. Cartografia nacional de áreas ardidas (formato ‘‘shapefile’’): 1990–1999; 2000–2009; 2010; 2011; 2012; e 2013. Instituto da Conservação da
Natureza e Florestas, Lisboa. Available at:http://www.icnf.pt/portal/florestas/dfci/incendios-florestais/info-geo.
Isenmann, P., Fradet, G.,1998. Nest site, laying period, and breeding success of the Woodchat Shrike (Lanius senator) in Mediterranean France. J. für Ornithologie 139 (1), 49–54.
Jaiswal, R.K., Mukherjee, S., Raju, K.D., Saxena, R.,2002. Forest fire risk zone mapping from satellite imagery and GIS. Int. J. Appl. Earth Observ. Geoinformat. 4 (1), 1–10.
Jones, N., De Graaff, J., Rodrigo, I., Duarte, F.,2011. Historical review of land use changes in Portugal (before and after EU integration in 1986) and their implications for land degradation and conservation, with a focus on Centro and Alentejo regions. Appl. Geogr. 31 (3), 1036–1048.
Jopp, F., Beckling, B., Reuter, H. (Eds.),2010. Modelling Complex Ecological Dynamics, Springer-Verlag, Berlin.
Jørgensen, S.E., De Bernardi, R.,1997. The application of a model with dynamic structure to simulate the effect of mass fish mortality on zooplankton structure in Lago di Annone. Hydrobiologia 356 (1–3), 87–96.
Kardall, L., Steen, E., Fabiao, A.,1986. Eucalyptus in Portugal. Ambio 15 (1), 6–13.
Kati, V., Devillers, P., Dufrêne, M., Legakis, A., Vokou, D., Lebrun, P.,2004. Testing the value of six taxonomic groups as biodiversity indicators at a local scale. Conserv. Biol. 18 (3), 667–675.
Lautenbach, S., Kugel, C., Lausch, A., Seppelt, R.,2011. Analysis of historic changes in regional ecosystem service provisioning using land use data. Ecol. Indicat. 11 (2), 676–687.
Lindenmayer, D.B.,1999. Future directions for biodiversity conservation in managed forests: indicator species, impact studies and monitoring programs. Forest Ecol. Management 115 (2), 277–287.
McGarigal, K., Marks, B.J., 1994. Spatial pattern analysis program for quantifying landscape structure. Gen. Tech. Rep. PNW.-GTR-351. US Department of Agriculture, Forest Service, Pacific Northwest Research Station.
Milwright, R.D.P.,1998. Breeding biology of the Golden Oriole Oriolus oriolus in the fenland basin of eastern Britain. Bird Study 45 (3), 320–330. Moreby, S.J., Stoate, C.,2001. Relative abundance of invertebrate taxa in the nestling diet of three farmland passerine species, Dunnock Prunella modularis,
Whitethroat Sylvia communis and Yellowhammer Emberzia citrinella in Leicestershire, England. Agricult. Ecosys. Environ. 86 (2), 125–134. Neter, J., Kutner, M., Nachtshei, C., Wasserma, W.,1996. Applied Linear Regression Models. McGraw-Hill, Boston.
Niemi, G.J., McDonald, M.E.,2004. Application of ecological indicators. Annu. Rev. Ecol. Evol. Syst. 89–111. Ormerod, S.J., Watkinson, A.R.,2000. Editors’ introduction: birds and agriculture. J. Appl. Ecol. 37 (5), 699–705.
Park, C.R., Hino, T., Itô, H.,2008. Prey distribution, foliage structure, and foraging behavior of insectivorous birds in two oak species (Quercus serrata and Q.
variabilis). Ecol. Res. 23 (6), 1015–1023.
Pereira, P., Godinho, C., Roque, I., Marques, A., Branco, M., Rabaça, J.E.,2014. Time to rethink the management intensity in a Mediterranean oak woodland: the response of insectivorous birds and leaf-chewing defoliators as key groups in the forest ecosystem. Ann. Forest Sci. 71 (1), 25–32.
Pinto-Correia, T., Godinho, S.,2013. Changing agriculture—changing landscape: what is going on in the high valued Montado landscapes of Southern Portugal. Agriculture in Mediterranean Europe between old and new paradigms. Res. Rural Sociol. Dev. 19, 75–90.
Pinto-Correia, T., Mascarenhas, J.,1999. Contribution to the extensification/intensification debate: new trends in the Portuguese montado. Landsc. Urban Plan. 46 (1), 125–131.
Preiss, E., Martin, J.L., Debussche, M.,1997. Rural depopulation and recent landscape changes in a Mediterranean region: consequences to the breeding avifauna. Landscape Ecol. 12 (1), 51–61.
Ralph, C.J., Geupel, G.R., Pyle, P., Martin, T.E., DeSante, D.F., 1993. Field methods for monitoring landbirds. US Department of Agriculture Forest Service General Technical Report PSW-144, Fresno, California, USA.
Rykiel, E.J.,1996. Testing ecological models: the meaning of validation. Ecol. Model. 90 (3), 229–244.
Saab, V.,1999. Importance of spatial scale to habitat use by breeding birds in riparian forests: a hierarchical analysis. Ecol. Appl. 9 (1), 135–151. Santos, M., Bastos, R., Cabral, J.A.,2013. Converting conventional ecological datasets in dynamic and dynamic spatially explicit simulations: Current advances
and future applications of the Stochastic Dynamic Methodology (StDM). Ecol. Model. 258, 91–100.
Santos, M., Bastos, R., Travassos, P., Bessa, R., Repas, M., Cabral, J.A.,2010. Predicting the trends of vertebrate species richness as a response to wind farms installation in mountain ecosystems of northwest Portugal. Ecol. Indicat. 10 (2), 192–205.
Santos, M., Cabral, J.A.,2004. Development of a stochastic dynamic model for ecological indicators’ prediction in changed Mediterranean agroecosystems of north-eastern Portugal. Ecol. Indicat. 3 (4), 285–303.
Schulze, C.H., Waltert, M., Kessler, P.J., Pitopang, R., Veddeler, D., Mühlenberg, M., et al.,2004. Biodiversity indicator groups of tropical land-use systems: comparing plants, birds, and insects. Ecol. Appl. 14 (5), 1321–1333.
Sherman, M.,2011. Spatial Statistics and Spatio-Temporal Data: Covariance Functions and Directional Properties. John Wiley and Sons, Lda, West Sussex.
Silva, J.S., Moreira, F., Vaz, P., Catry, F., Godinho-Ferreira, P.,2009. Assessing the relative fire proneness of different forest types in Portugal. Plant Biosyst. 143 (3), 597–608.
Silva, J.S., Vaz, P., Moreira, F., Catry, F., Rego, F.C.,2011. Wildfires as a major driver of landscape dynamics in three fire-prone areas of Portugal. Landsc. Urban Plan. 101 (4), 349–358.
Silva, P.G.P.M.D.,2012. Environmental Features at the Landscape Scale Shaping Soil Fauna Communities in Fragmented Forests (Ph.D. dissertation). University of Coimbra.
Silva-Santos, P., Pardal, M.Â., Lopes, R.J., Múrias, T., Cabral, J.A.,2006. A Stochastic Dynamic Methodology (SDM) to the modelling of trophic interactions, with a focus on estuarine eutrophication scenarios. Ecol. Indicat. 6 (2), 394–408.
Silva-Santos, P., Valentim, H., Luís, A., Queirós, L., Travassos, P., Cabral, J.A.,2010. A Stochastic Dynamic Methodology (StDM) to simulate the effects of fire on vegetation and bird communities in Pinus pinaster stands. Ecol. Indicat. 10 (2), 206–211.
Sirami, C., Brotons, L., Burfield, I., Fonderflick, J., Martin, J.L.,2008. Is land abandonment having an impact on biodiversity? A meta-analytical approach to bird distribution changes in the north-western Mediterranean. Biol. Cons. 141 (2), 450–459.
Sorensen, A.E.,1981. Interactions between birds and fruit in a temperate woodland. Oecologia 50 (2), 242–249.
Suárez-Seoane, S., Osborne, P.E., Baudry, J.,2002. Responses of birds of different biogeographic origins and habitat requirements to agricultural land abandonment in northern Spain. Biol. Cons. 105 (3), 333–344.
Surmacki, A.,2004. Habitat use by Reed Bunting Emberiza schoeniclus in an intensively used farmland in Western Poland. Ornis Fennica 81 (3), 137–143. Surovà, D., Surový, P., de Almeida Ribeiro, N., Pinto-Correia, T.,2001. Integrating differentiated landscape preferences in a decision support model for the