2020 September Volume 10 Number 1
http://doi.org/10.9770/jssi.2020.10.1(5)
FOOD CHOICES AS INFLUENCED BY ENVIRONMENTAL CONCERNS:
STUDY INVOLVING PARTICIPANTS FROM 16 COUNTRIES1
Raquel Guiné1, Manuela Ferreira2, Paula Correia3, Marcela Leal4, Vanessa Ferreira5, Ivana Rumbak6, Ayman EL-Kenawy7, Maria Papageorgiou8, Viktória Szűcs9, Elena Vittadini10, Dace Klava11, Elena Bartkiene12,
Lucia Muñoz13, Małgorzata Korzeniowska14, Monica Tarcea15, Ilija Djekić16, Maša Bizjak17, Kathy Isoldi18 1,2,3Polytechnic Institute of Viseu, Viseu, Portugal
4Maimonides University, Argentina 5UFVJM University, Minas Gerais, Brazil
6University of Zagreb, Croatia 7University of Sadat City, Egypt
8Alexander Technological Educational Institute, Thessaloniki, Greece 9Hungarian Chamber of Agriculture, Budapest, Hungary
10University of Parma, Italy
11Latvian University of Agriculture, Jelgava, Latvia 12Lithuanian University of Health Sciences, Kaunas, Lithuania
13Wageningen University & Research, The Netherlands
14Wrocław University of Environmental and Life Sciences, Wrocław, Poland 15Univiversity of Medicine & Pharmacy Tirgu-Mures, Romania
16University of Belgrade, Serbia 17University of Primorska, Slovenia 18University of Long Island, New York, USA
E-mails:1raquelguine@esav.ipv.pt; 2mmcferreira@gmail.com; 3paulacorreia@esav.ipv.pt; 4leal.nutricion@gmail.com; 5vanessa.nutr@gmail.com; 6icecic@pbf.hr; 7elkenawyay@yahoo.com; 8mariapapage@food.teithe.gr; 9szucs.viktoria@nak.hu; 10elena.vittadini@unicam.it; 11dace.klava@llu.lv; 12elena.bartkiene@lsmuni.lt;
13lucia.frezmunoz@wur.nl;14 malgorzata.korzeniowska@upwr.edu.pl; 15monica.tarcea@umftgm.ro; 16idjekic@agrif.bg.ac.rs; 17Masa.Cernelic@fvz.upr.si; 18kathy.isoldi@liu.edu
Received 19 September 2019; accepted 10 July 2020; published 30 September 2020
Abstract. The activities related to food production, processing, handling, transportation, storage and disposal of food products have an
important impact on sustainability. Hence, people’s food choices also contribute for the definition of the extension of this impact and therefore this work aimed at studying some motivations that influence people’s eating habits. This was an observational, cross-sectional study, undertaken on a non-probabilistic sample of 11960 participants form 16 countries (Argentina, Brazil, Croatia, Egypt, Greece, Hungary, Italy, Latvia, Lithuania, Netherlands, Poland, Portugal, Serbia, Slovenia, Romania, United States of America). The survey was undertaken by means of a questionnaire of self-response, applied only to adult citizens. The results obtained indicated that a great number of participants admit to shape their food choices according to some environmental concerns, like, for example, they prefer foods from the season or those that comply with sustainable processing and packaging. Regarding the food surplus, this seems a priority to avoid at home, but not so much when it comes to restaurants. Factor analysis indicated two types of concerns: Purely Environmental Concerns (PEC) and Sustainability allied to Quality Concerns (SQC), and cluster analysis showed that 54% of the participants tend to make their food choices considering both types of concerns, which is very expressive and positive towards sustainability of the food chain.
1 This work is part of the multinational project EATMOT from CI&DETS Research Centre (IPV - Viseu, Portugal) with reference PROJ/
Keywords: food choice; sustainable packaging; sustainable agriculture; food waste
Reference to this paper should be made as follows: Guiné, R., Ferreira, M., Correia, P., Leal, M., Ferreira, V., Rumbak, I., EL-Kenawy,
A., Papageorgiou, M., Szűcs, V., Vittadini, E., Klava, D., Bartkiene, E., Muñoz, L., Korzeniowska, M., Tarcea, M., Djekić, I., Bizjak, M., Isoldi, K. 2020. Food choices as influenced by environmental concerns: study involving participants from 16 countries. Journal of
Security and Sustainability Issues, 9(4), 61-71. http://doi.org/10.9770/jssi.2020.10.1(5)
JEL Classifications: Q56
Additional disciplines: ecology and environment; food choice; eating behaviours
1. Introduction
Eating is a basic requirement for human survival and in a scenario of increasing world population, the produc-tion of foods is an imminent challenge (Armanda, Guinée, & Tukker, 2019). The food system accounts for a considerable use of natural resources and greatly contributes to the environmental degradation, together with other human activities. It is estimated that about 20 to 30% of the total greenhouse gas (GHG) emissions, is derived from activities in the food sector, and this also uses around 70% of all fresh water spent. Furthermore, the food system greatly impacts the environment for being a major source of water pollution (Steinfeld et al., 2006). According to Eder & Deldago (2006), the food chain is responsible for about 80% of the world’s defor-estation, with all the harmful consequences this brings in terms of loss in the number and diversity of plant and animal species.
Within the food chain related activities, the production of food (from vegetable or animal origin) is considered as the one with the highest environmental impact (Weber & Matthews, 2008). However, the global sustain-ability of food products is way beyond just production, because it encompasses also transformation (industrial processing in most cases), transportation, storage, display in supermarkets (particularly when low temperature is used), preparation and disposal, not only of the food itself, but also of the packaging materials. Hence, the entire food supply chain should be considered (Fresán, Errendal, Craig, & Sabaté, 2019).
Understanding the impact of activities within the food system, from production to consumption and redistribu-tion, is pivotal to shape decision makers to support some types of activities (those more compromised with sus-tainability goals) in favour of other more problematic actions that have to be rethought. However, Mackenzie and Davies (2019) highlight the difficulties in establishing ways to identify and assess sustainability impacts in the food system, i.e., for foods and related operations.
Because people are becoming more aware of this impact that the entire food system has on the environment, from the primary production and fisheries up to the final disposal of surplus and packaging materials, it is im-portant to study consumers’ behaviours and identify the factors that may be responsible for their food choices, influencing them to adopt measures aimed at preserving the environment and increasing conscientiousness towards sustainability. In 2018, 60% of American consumers admitted that they attribute importance to the sustainable production of the food they buy or consume, being this on an increasing trend over the last years. Also in the same study it was found that over 40% of the participants confirmed that sustainability is the most important issue influencing them in their food and beverage selection (IFICF, 2018). On another study were investigated the American consumers’ preferences for sustainable food products (Chen, Gao, & McFadden, 2020), and the results indicated that locally produced fresh produce are highly preferred, unlike organic prod-ucts, which were not so much valued.
2. Research objective and methodology
The objective of this work was to understand the motivations that drive people’s food choices when it comes to some sustainability issues.
This was an observational study undertaken by means of a questionnaire survey on 16 different countries. The questionnaire was prepared in the ambit of the EATMOT project (Ferrão, Guine, Correia, Ferreira, & Lima, 2019) and contained, among many other investigated subjects, specific questions about some environmental aspects that could influence people’s food choices, namely:
l Q1. I choose the foods I eat, because it fits the season;
l Q2. It is important to me that the food I eat is prepared/packed in an environmental friendly way; l Q3. When I cook I have in mind the quantities to avoid food waste;
l Q4. It is important to me that the food I eat comes from my own country;
l Q5. I prefer to eat food that has been produced in a way that animals’ rights have been respected; l Q6. I avoid going to restaurants that do not have a recovery policy of food surplus;
l Q7. I prefer to buy foods that comply with policies of minimal usage of packaging.
Each of these questions was asked to measure the level of accordance of the participants on a 5-point scale (1 – totally disagree, 2 – disagree, 3 – no opinion, 4 – agree and 5 – totally agree). The questionnaire was approved by the Ethical Committee (Reference nº 04/2017) before application. This descriptive cross-sectional study was undertaken on a non-probabilistic convenience sample with 11,960 participants from 16 countries: Argentina, Brazil, Croatia, Egypt, Greece, Hungary, Italy, Latvia, Lithuania, Netherlands, Poland, Portugal, Romania, Serbia, Slovenia and United States of America. The survey was conducted between September 2017 and June 2018 by direct interview, after informed consent and only to adult citizens (aged 18 or over). All ethical issues were strictly followed and the confidentiality of the individual answers was also guaranteed to comply with ethical principles. In this way here are only presented aggregated results from which no inference can be made about individual responses.
The software used for the statistical analysis was SPSS Version 25 from IBM, Inc. Basic descriptive statistics was used complemented with Factor Analysis (FA) and Cluster Analysis (CA). First was applied exploratory factor analysis by the method of Principal Component Analysis (PCA), in order to determine if there was a grouping structure between the questions. Then, the factors identified were submitted to cluster analysis. For undertaking FA and CA, the variables were recoded into binary variables, following the correspondences: 1 (totally disagree) or 2(disagree) were recoded into 0 – not determinant while 4 (agree) or 5 (totally agree) were recoded into 1 – determinant. The participants who did not manifest an opinion, i.e., with missing answers or responding 3 (no opinion), were not considered in the analysis.
The first step consisted in analysing the data to test whether they were appropriate FA by PCA. The correlation matrix between the variables was analysed to identify possible correlations. The Kaiser-Meyer-Olkin (KMO) measure of adequacy of the sample was calculated and the Bartlett’s test was performed to evaluate correla-tions between variables (Broen et al., 2015). Once verified the data adequacy, FA was applied with extraction by PCA method and Varimax rotation with Kaiser Normalization. The number of components was determined based on the scree plot. The communalities were calculated to show the percentage of variance explained by the factors extracted (Broen et al., 2015). Only factor loadings with absolute value of 0.4 or over were considered (Rohm & Swaminathan, 2004; Stevens, 2009). The internal consistency of each factor was evaluated by the Cronbach’s alpha (α) (Broen et al., 2015; Tanaka, Akechi, Okuyama, Nishiwaki, & Uchitomi, 2000).
The CA started with the definition of the adequate number of clusters, being this evaluated by means of hier-archical methods considering as variables the two factors obtained by FA. The methods tested were: median clustering, centroid and Ward. The coefficients obtained in the agglomeration schedule for the three methods all showed that four clusters should be formed. The following step consisted in comparing by means of contin-gency tables the solutions obtained, so as to evaluate stability. The solutions obtained with centroid and median methods showed a 95% similarity, which is very high. The similarity between Ward and median solutions was 65% while the similarity between Ward and centroid was 68%. These results are indicative of potential stability,
and therefore the number of clusters was fixed in four to proceed with the analysis using the partitive method of k-means, which is particularly recommended and frequently used in CA (Dolnicar, 2002). The k-means method was therefore applied to the three initial solutions.
3. Results and discussion
Sample Characterization
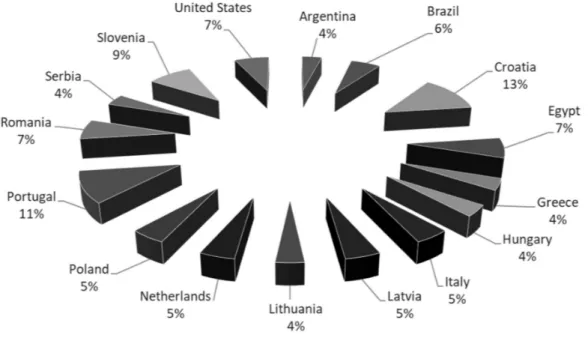
From the 11960 participants, 71% were women and 29% were men, being the representability of the countries as shown in Figure 1, so that Croatia and Portugal contributed with more participants, 13% and 11% respective-ly, being the lowest participations corresponding to 4% for Argentina, Greece, Hungary, Lithuania and Serbia.
Figure 1. Distribution of participants by country
Regarding age, 50 % of the participants were young adults (from 18 to 30 years), 34% were middle aged adults (31 – 50 years), 13% were senior adults (51-65 years) and 3% were elderly (over 65 years). The highest level of education completed was primary school only for 2% of the participants, while 36% had completed second-ary school and 62% had finished a university degree. Most participants lived in urban (67%) or suburban areas (17%) and only 16% lived in rural environments. Regarding the marital status, 46% were single, 47% were married, 5% were divorced and 2% were widowed.
Food choices relating to environmental and sustainability determinants
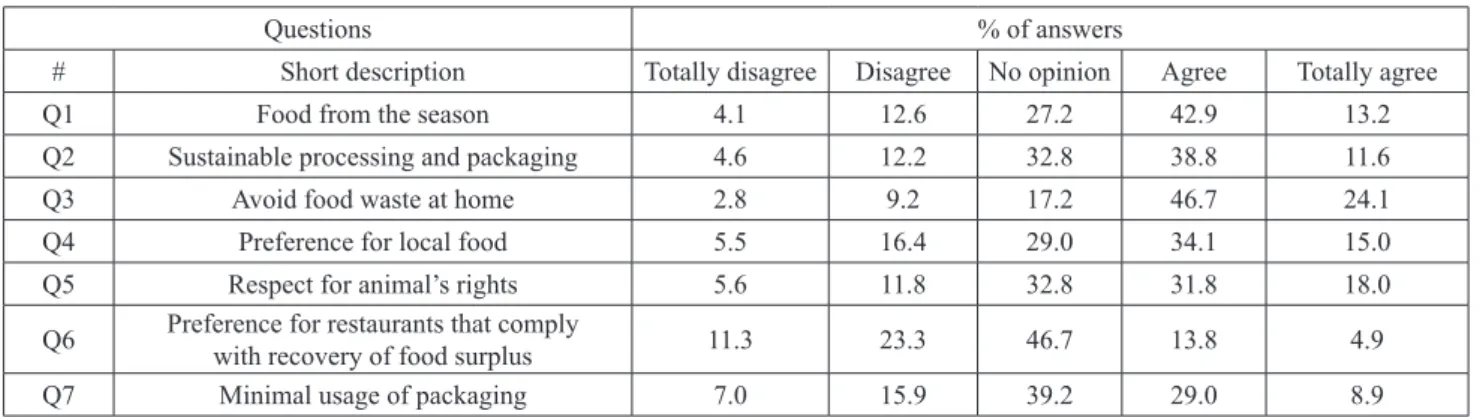
Table 1 shows the frequencies of response obtained regarding the aspects investigated in this study that relate to sustainable food choices and behaviours. From the participants in the survey, the great majority prefer to con-sume food from the season (Q1: 42.9% agree and 13.2% totally agree). The storage of food products, and most particularly when they have to be stored under low temperatures (refrigerated or frozen), is very demanding in terms of energy requirements, and it is known that today most of the energy consumed on a world basis is still from fossil sources (Bilgili, Bilirgen, Ozbek, Ekinci, & Demirdelen, 2018; IEA, 2019).
Table 1. Frequency of response for the seven questions about sustainable food choices
Questions % of answers
# Short description Totally disagree Disagree No opinion Agree Totally agree
Q1 Food from the season 4.1 12.6 27.2 42.9 13.2
Q2 Sustainable processing and packaging 4.6 12.2 32.8 38.8 11.6
Q3 Avoid food waste at home 2.8 9.2 17.2 46.7 24.1
Q4 Preference for local food 5.5 16.4 29.0 34.1 15.0
Q5 Respect for animal’s rights 5.6 11.8 32.8 31.8 18.0
Q6 Preference for restaurants that comply with recovery of food surplus 11.3 23.3 46.7 13.8 4.9
Q7 Minimal usage of packaging 7.0 15.9 39.2 29.0 8.9
Regarding the preference for foods that comply with sustainable processing and packaging (Q2), also most of the participants agreed (38.8%) or totally agreed (11.6%), demonstrating that these factors influence people’s choice when buying food products. Nevertheless, regarding the processing, it is sometimes very difficult to perceive at the moment of purchase the type of technology used to obtain the product. On the contrary, the package is much easier to evaluate and that can in fact have an influence in the buying decisions. It has been reported that from the consumer’s point of view, the most relevant motives that drive consumers to purchase packaged foods are convenience, saving time and facility of preparation (IFICF, 2017). Surprisingly, the results for question Q7, are not so much in accordance with those from Q2 at first sight, since a lower percentage of the participants condition their food choices to the minimal usage of packaging, as compared to the care for sustainable processing and packaging. Nevertheless, this is in accordance with modern trends to replace tradi-tional packaging materials with a high impact on the environment, such as synthetic plastics of single usage, by alternative biodegradable materials produced from organic sources (Dilkes-Hoffman et al., 2018; Engel, Ambrosi, & Tessaro, 2019; Kamdem, Shen, Nabinejad, & Shu, 2019).
The responses obtained for question Q3, about avoiding food waste when preparing or consuming foods at home, showed that a very expressive majority adopt measures to control the quantities prepared so as minimize food waste (46.7% agree and 24.1% totally agree). On the contrary, when the food waste is generated in restau-rants, people are not so much alert for this problem, and just a small percentage of people opt for restaurants that have policies of recovery of food surplus (less than 20%). To discard edible food products that are in a good state for consumption increases unnecessarily the environmental load. In fact, there is a growing tendency to recover food surplus to be used for charitable and social redistribution, with a huge impact not only in terms of the environment but also for its social importance (Midgley, 2019; Nair, Rashidi, & Dixit, 2017; Papargyropou-lou, Lozano, K. Steinberger, Wright, & Ujang, 2014).
The preference for local food (Q4) is also important for 34.1% of the participants, being very important for 15.0%. This indicates that people are concerned with the transportation and its effects, namely in terms of GHG emissions, but also maybe with the fact that local foods have a social dimension, contributing for the development of local communities. The establishment of local production systems that provide food products for local consumption can eventually contribute to alleviate the present unsustainable resource consumption, by alternatively making efficient use of locally available renewable resources. The involvement of producers and consumers in more sustainable local and regional food networks has increased over the last decades with an actual sense of belonging to a greater community good. It is believed that these local food networks bring additional benefits towards more sustainable agri-food systems (Dedeurwaerdere et al., 2017; Garrett, 2016; Hang, Martinez-Hernandez, Leach, & Yang, 2016; Petrescu-Mag, Petrescu, & Reti, 2019).
Finally, the questionnaire also included an item to evaluate whether people condition their food choices accord-ing to the respect for the animal’s rights (Q5). In fact, this is an issue that has been brought to light in the past years very frequently, even in the global social media, and therefore most people try to consume foods that were obtained following measures to respect the animals’ rights (31.8% agree and 18.0% totally agree).
Factor analysis
The correlation matrix showed that there were some correlations between the variables, with 14 out of 21 val-ues higher than 0.4, being the highest value obtained for the correlation between Q2 and Q7 (0.650). Hence, these values reflect some important correlations between the variables, making it possible to use FA. Further-more, the Bartlett’s test was significant (p < 0.001), leading to the rejection of the null hypothesis that the correlation matrix was equal to the identity matrix. The value of KMO was good (0.883) according to the clas-sification of Kaiser and Rice (Kaiser & Rice, 1974), confirming the suitability for application of PCA and FA techniques. The anti-image matrix showed that there wasn’t any MSA (Measure of Sampling Adequacy) lower than 0.5, meaning that all the variables were proper for inclusion in the analysis (Values of MSA: Q1 – 0.908, Q2 – 0.877, Q3 – 0.927, Q4 – 0.883, Q5 – 0.899, Q6 – 0.874, Q7 – 0.845).
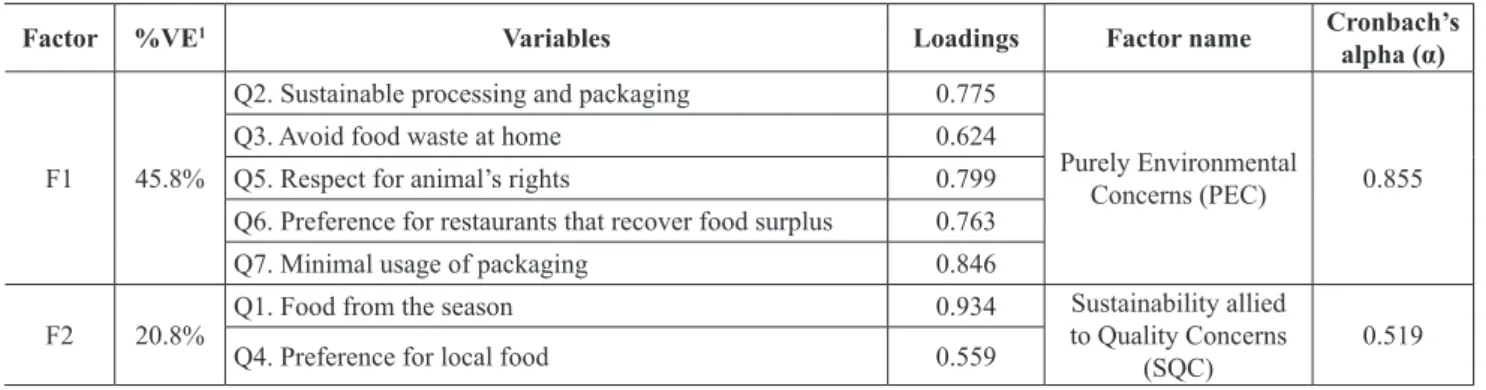
The solution obtained by FA with PCA and Varimax rotation retained two components, as confirmed by the scree plot (graph not shown). The percentages of total variance explained (VE) by the factors were: F1 – 45.8% and F2 – 20.8%, accounting for a total variance explained of 66.6% (Table 2). Question Q1 had the largest frac-tion of VE by the obtained solufrac-tion, being 88.6%, followed by quesfrac-tion Q7 (74.3% VE). Quesfrac-tion Q4 had the lowest communality (0.483), thus indicating that only about 48% of its variance was explained by the solution. Only three iterations were necessary to achieve convergence. As indicated in Table 2, que group composed of questions in factor F1 seems to relate to environmental friendly attitudes while those in factor F2 appear to be related to sustainable concerns perhaps allied with quality of the food products. Factor 1 had relatively high loadings, with the lowest being 0.624 for variable Q3, meaning that the answers obtained for the attitudes to-wards avoiding food waste at home were those that contributed less for the definition of this factor as compared to the questions with higher loadings (all other cases with loadings over 0.7). The results in Table 2 also show that the loading of question Q1 to factor F2 is very high, being the variable most strongly associated to this fac-tor. Because all variables were included in the solution with loadings higher than 0.4, this solution is acceptable with all the seven variables included (Stevens, 2009).
Table 2. Results of the factor analysis and loading factors
Factor %VE1 Variables Loadings Factor name Cronbach’s
alpha (α)
F1 45.8%
Q2. Sustainable processing and packaging 0.775
Purely Environmental
Concerns (PEC) 0.855
Q3. Avoid food waste at home 0.624
Q5. Respect for animal’s rights 0.799
Q6. Preference for restaurants that recover food surplus 0.763
Q7. Minimal usage of packaging 0.846
F2 20.8% Q1. Food from the season 0.934 to Quality Concerns Sustainability allied
(SQC) 0.519
Q4. Preference for local food 0.559
1VE = Variance explained.
To validate the solution, Cronbach’s alpha (α) were determined, corresponding to the internal consistency within each factor (Broen et al., 2015). The value of Cronbach’s alpha for factor F1 (PEC) was 0.855, which is considered good (Davis, 1964; Hair, Black, Babin, & Anderson, 2009; Maroco & Garcia-Marques, 2006). Also, trying to remove of any of the five variables did not increase alpha, and for that reason F1 has a good internal consistency. Regarding factor F2 (SQC), the value of alpha was 0.519, which according to some authors could be acceptable (Davis, 1964; Hair et al., 2009; Maroco & Garcia-Marques, 2006), although a value of 0.7 or over would be desirable (Hair et al., 2009; Maroco & Garcia-Marques, 2006).
Cluster analysis
Table 3 shows the results obtained for the application of k-means to the initial solutions obtained with Ward, centroid and median methods. As it can be observed all the tested initial solutions converged to the same fi-nal solution, which is indicative of stability. Also, because the values of ANOVA p-value are significant (p < 0.0005)and the values of test statistic (F) are high, they indicate similarity between the cases within the groups and differentiation between groups. Furthermore, both factors contributed equally to the definition of the clus-ters, since the values of F are within the same order of magnitude for both factors. For these reasons, this was considered as the final solution and therefore the clusters are defined according to the results in Table 3.
Table 3. Results of the cluster analysis by the K-means method Ward
initial solution initial solutionCentroid initial solutionMedian
ANOVA: F , p-value PEC 3412 , p < 0.0005 3418 , p < 0.0005 3418 , p < 0.0005 SQC 5920 , p < 0.0005 5907 , p < 0.0005 5907 , p < 0.0005 Clusters: (Centres) , % of cases 1 (0.62;0.43) , 55% (0.61;0.43) , 54% (0.61;0.43) , 54% 2 (0.99;-1.72) , 10% (0.99;-1.72) , 10% (0.98;-1.72) , 10% 3 (-1.33;0.78) , 21% (-1.34;0.78) , 21% (-1.34;0.78) , 21% 4 (-1.01;-1.59) , 15% (-1.01;-1.59) , 15% (-1.01;-1.59) , 15%
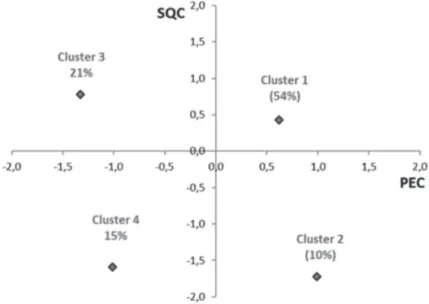
Figure 2 presents the results of the final solution. Cluster number 1 accounts for 54% of the cases and showed positive values for both factors, meaning that these individuals base their food choices on the environmental concerns (PEC) as well as the aspects related to quality associated with sustainability (SQC). On the opposite side appears cluster number 4, grouping the individuals that do not attribute importance to neither of the factors, i.e., do not have any type of ecological or environmental concerns when choosing their food. Nevertheless, it is important to notice that the percentage of people in this group is much lower, 15%, when compared with those in cluster 1 (with almost 4 times more). Clusters 2 and 3 correspond to individuals with partial influence of the studied factors on their food choices, with those in cluster 2 attributing importance to PEC as determinants of their food choices, while those in cluster 3 attribute importance to SCQ.
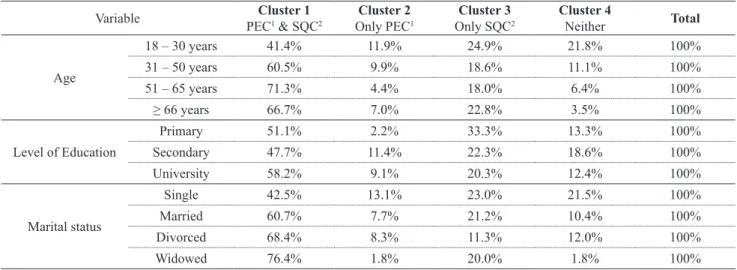
After defining the clusters, it is important to characterize the individuals in each of the groups. The results in Table 4 show that for all age classes, the majority of the members are in cluster 1, i.e., those which demonstrate both types of concerns (Purely Environmental Concerns plus Sustainability allied to Quality Concerns). Look-ing at cluster 4, which includes those participants that do not care about neither of the factors, it is observed that with increasing age the frequency of people in this cluster decreases, and this means that people tend to become more concerned about the impact of their food choices on a global basis. Regarding the level of educa-tion, the results are very similar for the three school levels considered, with cluster 1 having the highest number of participants, followed by cluster 3 (only the Sustainability allied to Quality Concerns). As for marital status, less single people are classified in cluster 1 as compared with the other marital statuses, and particularly the widowed.
Table 4. Association between cluster membership and variables age, level of education and marital status
Variable PECCluster 11 & SQC2 Only PECCluster 21 Only SQCCluster 32 Cluster 4Neither Total
Age 18 – 30 years 41.4% 11.9% 24.9% 21.8% 100% 31 – 50 years 60.5% 9.9% 18.6% 11.1% 100% 51 – 65 years 71.3% 4.4% 18.0% 6.4% 100% ≥ 66 years 66.7% 7.0% 22.8% 3.5% 100% Level of Education Primary 51.1% 2.2% 33.3% 13.3% 100% Secondary 47.7% 11.4% 22.3% 18.6% 100% University 58.2% 9.1% 20.3% 12.4% 100% Marital status Single 42.5% 13.1% 23.0% 21.5% 100% Married 60.7% 7.7% 21.2% 10.4% 100% Divorced 68.4% 8.3% 11.3% 12.0% 100% Widowed 76.4% 1.8% 20.0% 1.8% 100%
1PEC = Purely Environmental Concerns; SQC = Sustainability allied to Quality Concerns.
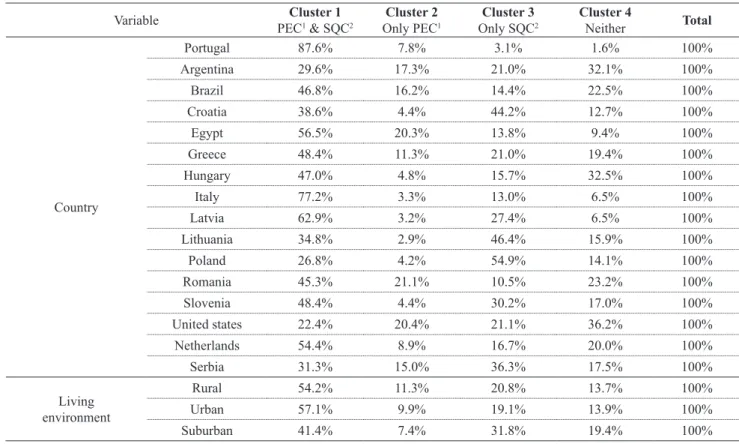
Table 5 presents the cluster membership for the categorization according to country and living environment. In the case of country, very remarkable differences are noticeable in some cases. For example, while for most countries the participants are mainly in cluster 1, showing both types of concerns, the Argentinian and the American participants are mostly in cluster 4 (32.1% and 36.2%, respectively), i.e., they do not care for nei-ther of the types of concerns addressed. Also, nei-there are some countries in which the participants are mostly in cluster 3, revealing only Sustainability allied to Quality Concerns (Croatia – 44.2%, Lithuania – 46.4%, Poland – 54.9% and Serbia – 36.3%). Regarding the living environment, similar trends were observed for the three classes: rural, urban or suburban, with the highest percentage being in all cases for cluster 1.
Table 5. Association between cluster membership and variables country and living environment
Variable PECCluster 11 & SQC2 Only PECCluster 21 Only SQCCluster 32 Cluster 4Neither Total
Country Portugal 87.6% 7.8% 3.1% 1.6% 100% Argentina 29.6% 17.3% 21.0% 32.1% 100% Brazil 46.8% 16.2% 14.4% 22.5% 100% Croatia 38.6% 4.4% 44.2% 12.7% 100% Egypt 56.5% 20.3% 13.8% 9.4% 100% Greece 48.4% 11.3% 21.0% 19.4% 100% Hungary 47.0% 4.8% 15.7% 32.5% 100% Italy 77.2% 3.3% 13.0% 6.5% 100% Latvia 62.9% 3.2% 27.4% 6.5% 100% Lithuania 34.8% 2.9% 46.4% 15.9% 100% Poland 26.8% 4.2% 54.9% 14.1% 100% Romania 45.3% 21.1% 10.5% 23.2% 100% Slovenia 48.4% 4.4% 30.2% 17.0% 100% United states 22.4% 20.4% 21.1% 36.2% 100% Netherlands 54.4% 8.9% 16.7% 20.0% 100% Serbia 31.3% 15.0% 36.3% 17.5% 100% Living environment Rural 54.2% 11.3% 20.8% 13.7% 100% Urban 57.1% 9.9% 19.1% 13.9% 100% Suburban 41.4% 7.4% 31.8% 19.4% 100%
1PEC = Purely Environmental Concerns; SQC = Sustainability allied to Quality Concerns.
Conclusions
This work allowed concluding that, in general, people try to shape their food choices according to some envi-ronmental and sustainability aspects, and particularly in what concerns the preference for local foods and those from the season, that have been produced, transported and handled in a sustainable way and that use sustainable packaging. The respect for animal’s rights is also an issue with importance for an expressive majority of people. Regarding the food surplus, while people try to avoid it at home, when it comes to restaurants they do not think that is a factor strong enough to influence their choice.
Factor analysis allowed identifying two factors associated with the sustainable food choices: the Purely Envi-ronmental Concerns and the Sustainability allied to Quality Concerns (SQC), that together explain about two thirds of total variance. Cluster analysis allowed classifying the participants into four clusters: those with both types of concerns, those with only one of the types of concerns and finally those with neither of the types of concerns. Cluster membership indicated that for all classes of age, school level, marital status or living environ-ment, most of the participants belonged to cluster 1. However, when it comes to the countries, remarked differ-ences were encountered, although in most of the countries cluster 1 was also the most representative.
References
Armanda, D. T., Guinée, J. B., & Tukker, A. (2019). The second green revolution: Innovative urban agriculture’s contribution to food security and sustainability – A review. Global Food Security, 22, 13–24. https://doi.org/10.1016/j.gfs.2019.08.002
Bilgili, M., Bilirgen, H., Ozbek, A., Ekinci, F., & Demirdelen, T. (2018). The role of hydropower installations for sustainable energy development in Turkey and the world. Renewable Energy, 126, 755–764. https://doi.org/10.1016/j.renene.2018.03.089
Broen, M. P. G., Moonen, A. J. H., Kuijf, M. L., Dujardin, K., Marsh, L., Richard, I. H., … Leentjens, A. F. G. (2015). Factor analy-sis of the Hamilton Depression Rating Scale in Parkinson’s disease. Parkinsonism & Related Disorders, 21(2), 142–146. https://doi. org/10.1016/j.parkreldis.2014.11.016
Chen, X., Gao, Z., & McFadden, B. R. (2020). Reveal Preference Reversal in Consumer Preference for Sustainable Food Products.
Food Quality and Preference, 79, 103754. https://doi.org/10.1016/j.foodqual.2019.103754
Davis, F. B. (1964). Educational Measurements Their Interpretation. Retrieved from http://www.abebooks.com/book-search/title/edu-cational-measurements-their-interpretation/
Dedeurwaerdere, T., De Schutter, O., Hudon, M., Mathijs, E., Annaert, B., Avermaete, T., … Vivero, J.-L. (2017). The Governance Features of Social Enterprise and Social Network Activities of Collective Food Buying Groups. Ecological Economics, 140, 123–135. https://doi.org/10.1016/j.ecolecon.2017.04.018
Dilkes-Hoffman, L. S., Lane, J. L., Grant, T., Pratt, S., Lant, P. A., & Laycock, B. (2018). Environmental impact of biodegradable food packaging when considering food waste. Journal of Cleaner Production, 180, 325–334. https://doi.org/10.1016/j.jclepro.2018.01.169 Dolnicar, S. (2002). A review of data-driven market segmentation in tourism. Faculty of Commerce - Papers, 12, 1–22. https://doi. org/10.1300/J073v12n01_01
Eder, P., & Deldago, L. (2006). Environmental impact of products (EIPRO) analysis of the life cycle environmental impacts related to
the final consumption of the EU-25. Institute for Prospective Technological Studies.
Engel, J. B., Ambrosi, A., & Tessaro, I. C. (2019). Development of biodegradable starch-based foams incorporated with grape stalks for food packaging. Carbohydrate Polymers, 225(115234), 1–10. https://doi.org/10.1016/j.carbpol.2019.115234
Ferrão, A. C., Guine, R. P. F., Correia, P. M. R., Ferreira, M., & Lima, J. D. and J. (2019). Development of A Questionnaire To Assess People’s Food Choices Determinants. Current Nutrition & Food Science, 15(3), 281–295.
Fresán, U., Errendal, S., Craig, W. J., & Sabaté, J. (2019). Does the size matter? A comparative analysis of the environmental impact of several packaged foods. Science of The Total Environment, 687, 369–379. https://doi.org/10.1016/j.scitotenv.2019.06.109
Garrett, J. J. (2016). Future Visions: A Sustainable and Healthy Local Food Production System. Rangelands, 38(1), 42–46. https://doi. org/10.1016/j.rala.2015.12.001
Hair, J. F. H., Black, W. C., Babin, B. J., & Anderson, R. E. (2009). Multivariate Data Analysis (7 edition). s.l.: Prentice Hall.
Hang, M. Y. L. P., Martinez-Hernandez, E., Leach, M., & Yang, A. (2016). Designing integrated local production systems: A study on the food-energy-water nexus. Journal of Cleaner Production, 135, 1065–1084. https://doi.org/10.1016/j.jclepro.2016.06.194
IEA. (2019). Total primary energy supply (TPES) by source, World 1990-2017 [Statistics]. Retrieved from International Energy Agency website: https://www.iea.org/statistics/
IFICF. (2017). 2017 Food and Health Survey: “A Healthy Perspective: Understanding American Food Values” [Food Insight]. Interna-tional Food Information Council Foundation.
IFICF. (2018). 2018 Food and Health Survey [Food Insight]. International Food Information Council Foundation.
Kaiser, H. F., & Rice, J. (1974). Little Jiffy, Mark Iv. Educational and Psychological Measurement, 34(1), 111–117. https://doi. org/10.1177/001316447403400115
Kamdem, D. P., Shen, Z., Nabinejad, O., & Shu, Z. (2019). Development of biodegradable composite chitosan-based films incorpo-rated with xylan and carvacrol for food packaging application. Food Packaging and Shelf Life, 21, 100344. https://doi.org/10.1016/j. fpsl.2019.100344
Mackenzie, S. G., & Davies, A. R. (2019). SHARE IT: Co-designing a sustainability impact assessment framework for urban food shar-ing initiatives. Environmental Impact Assessment Review, 79, 106300. https://doi.org/10.1016/j.eiar.2019.106300
Maroco, J., & Garcia-Marques, T. (2006). Qual a fiabilidade do alfa de Cronbach? Questões antigas e soluções modernas? Retrieved from http://repositorio.ispa.pt/handle/10400.12/133
Midgley, J. L. (2019). Anticipatory practice and the making of surplus food. Geoforum, 99, 181–189. https://doi.org/10.1016/j.geofo-rum.2018.09.013
Nair, D. J., Rashidi, T. H., & Dixit, V. V. (2017). Estimating surplus food supply for food rescue and delivery operations.
Petrescu-Mag, R. M., Petrescu, D. C., & Reti, K.-O. (2019). My land is my food: Exploring social function of large land deals using food security–land deals relation in five Eastern European countries. Land Use Policy, 82, 729–741. https://doi.org/10.1016/j.landuse-pol.2019.01.003
Rohm, A. J., & Swaminathan, V. (2004). A typology of online shoppers based on shopping motivations. Journal of Business Research,
57(7), 748–757. https://doi.org/10.1016/S0148-2963(02)00351-X
Steinfeld, H., Gerber, P., Wassenaar, T., Castel, V., Rosales, M., & Haan, C. (2006). Livestock’s long Shadow. Rome, Italy: Food and Agriculture Organization of the United Nations.
Stevens, J. P. (2009). Applied Multivariate Statistics for the Social Sciences, Fifth Edition (5 edition). New York: Routledge.
Tanaka, K., Akechi, T., Okuyama, T., Nishiwaki, Y., & Uchitomi, Y. (2000). Development and validation of the Cancer Dyspnoea Scale: A multidimensional, brief, self-rating scale. British Journal of Cancer, 82(4), 800–805. https://doi.org/10.1054/bjoc.1999.1002 Weber, C. L., & Matthews, H. S. (2008). Food-Miles and the Relative Climate Impacts of Food Choices in the United States.
Environ-mental Science & Technology, 42(10), 3508–3513. https://doi.org/10.1021/es702969f
Acknowledgements
This work is part of the multinational project EATMOT from CI&DETS Research Centre (IPV - Viseu, Portugal) with reference PROJ/ CI&DETS/CGD/0012, co-financed by Caixa Geral de Depósitos.
Name Country Orcid ID
Raquel Guiné Portugal 0000-0003-0595-6805
Paula Correia Portugal 0000-0002-2023-4475
Manuela Ferreira Portugal 0000-0002-8452-2222
Marcela Leal Argentina 0000-0002-7052-1077
Vanessa Ferreira Brazil 0000-0003-0417-8490
Ivana Rumbak Croatia 0000-0002-9853-3299
Ayman EL-Kenawy Egypt 0000-0002-0818-2393
Maria Papageorgiou Greece 0000-0001-7009-846X
Viktória Szűcs Hungary 0000-0002-3594-0786
Elena Vittadini Italy 0000-0001-9181-0815
Dace Klava Latvia 0000-0002-9490-7396
Elena Bartkiene Lithuania 0000-0003-3706-1280
Lucia Frez Muñoz Netherlands 0000-0002-9725-5944
Małgorzata Korzeniowska Poland 0000-0002-0300-0407
Monica Tarcea Romania 0000-0001-7299-118X
Ilija Djekić Serbia 0000-0002-8132-8299
Maša Bizjak Slovenia 0000-0002-0537-0196
Kathy Isoldi USA 0000-0003-3465-4152
This work is licensed under the Creative Commons Attribution International License (CC BY). http://creativecommons.org/licenses/by/4.0/