SAMPLE SIZE FOR THE ESTIMATION OF SOME SORGHUM TRAITS PAULO SÉRGIO LIMA E SILVA1, ZENAIDE BARBOSA2, RANOEL JOSÉ DE SOUSA GONÇALVES1,
PAULO IGOR BARBOSA E SILVA1, GLAUBER HENRIQUE DE SOUSA NUNES1 1Departamento de Fitotecnia, Escola Superior de Agricultura de Mossoró. BR-110, km 47. Caixa Postal 137.
CEP 59625-900 Mossoró, RN. E-mail: [email protected] (corresponding author)
2Faculdade Vale do Jaguaribe. Rua Cel. Alexandrino, 563, Centro, 62800-000 Aracati-CE
Revista Brasileira de Milho e Sorgo, v.4, n.2, p.149-160, 2005
ABSTRACT - Sorghum research, just like any research involving other crops, requires a knowledge of experimental techniques that will provide the maximum precision with a minimum of resources. The objective of the present work was to evaluate the implications of sampling size over the results obtained with the application of tests F and Tukey in the analysis of sorghum traits variance. Another objective was to identify ideal sample sizes for those traits, by using two methods: use of the experimental coefficient of variation value (CV) alone; use of formula involving the variance of an estimated plot mean based on a sampling units. Eight sorghum cultivars were evaluated in a random block design with four replicates. All plants in the plot (45), in addition to eight sample sizes (varying from 5 to 40 units, at 5-unit intervals) were utilized to evaluate plant height (PH), dry matter in the vegetative above-ground part of the plant (without the panicle) (DMP), length (PL), and panicle dry matter (PDM). It was observed that the F and Tukey tests, based on samples, could result in different conclusions from those obtained when all plants in the plot are utilized to evaluate DMP and PDM. About 25 units represent samples for the estimation of the four characteristics, when the CV value is used. The adoption of the sample size formula proved that to estimate PH, DMP, PL, and PDM, the ideal sample sizes would be 14 plants, 11 plants, 14 panicles, and 24 panicles, respectively.
Key words: Sorghum bicolor (L.) Moench, dry matter, panicle, plant height TAMANHO AMOSTRAL PARA ESTIMAÇÃO DE ALGUNS
CARACTERES DO SORGO
RESUMO – Pesquisas com sorgo e com as demais culturas requerem o conhecimento de técnicas experimentais que propiciem o máximo de precisão com o mínimo de recur-sos. O objetivo do trabalho foi avaliar as implicações do tamanho amostral sobre os resultados obtidos com a aplicação dos testes F e de Tukey na análise de variância de características do sorgo. Objetivou-se também identificar tamanhos amostrais ideais para essas características, através de dois métodos: uso exclusivo do valor do coeficiente de variação experimental (CV); uso de fórmulas envolvendo o valor da variância da média de uma parcela, calculada com base em a unidades amostrais. Oito cultivares de sorgo foram avaliadas no delineamento de blocos ao acaso, com quatro repetições. Todas as plantas da parcela (45), além de oito tamanhos amostrais (de 5 a 40 unidades, com inter-valos de cinco unidades) foram utilizados para avaliar a altura da planta (AP), matéria seca da parte aérea vegetativa (sem a panícula) da planta (MP), o comprimento (CP) e a matéria seca da panícula (MPa). Verificou-se que os testes F e de Tukey, baseados em
amostras, podem resultar em conclusões diferentes das obtidas quando todas as plantas da parcela são utilizadas para avaliação de MP e MPa. Cerca de 25 unidades represen-tam amostras para estimar as quatro características, quando se usa o valor do CV como critério. A adoção da fórmula do tamanho amostral, em função da variância da média, indicou que, para estimação da AP, MP, CP e Mpa, os tamanhos amostrais ideais seriam 14 plantas, 11 plantas, 14 panículas e 24 panículas, respectivamente.
Palavras-chave: Sorghum bicolor (L.) Moench, matéria seca, panícula, altura da planta populations) can only be obtained based on a fraction of the population. This population fraction is called sample and the smallest sample units in which measurements are made are called sampling units (Steel et al., 1997). The sampling of data has many advantages, including lower cost, higher speed and greater precision in the evaluation of population traits.
When sampling, the researcher must consider two important problems: the method that will be adopted and the number of units that will make up the sample. Many sampling procedures exist; however, they can be classified into two types: probabilistic and non-probabilistic (Cochran, 1977). The sampling is referred to as probabilistic or random when the probability that the plants in the plot belong to the sample is known and different from zero. Otherwise, the sampling is non-probabilistic. Probabilistic sampling procedures enable non-biased estimates for the plot parameters to be obtained and provide the foundation for studies about discrepancies between parameters and statistics (LeClerg et al., 1966).
When, in a random block experiment with “r” replicates, “a” sampling units are extracted per plot, and then the variance estimate for a treatment mean (sy2) is s2/ra, where s2/r estimates
the true variance of an individual plot, plus the true variance of the mean for an individual plot or σa2/r (LeClerg et al., 1966). In these expressions,
s2 is the mean square of the residue and s2 is the
The increased interest of farmers in Northeastern Brazil in growing sorghum (Sorghum bicolor L. Moench) could be due to an increased utilization of maize for human and monogastric animal consumption (Silva et al., 1999). In this scenario, the grower would consider the possibility of replacing maize with sorghum, as feed for other types of animals, since both crops possess similar nutritional value and cultivation characteristics. However, it is more likely that the increased interest in sorghum is due to its known tolerance to water deficits (Stone et al., 1996), which frequently occur in the Northeast. No differences exist between the dry matter yields observed for maize (Zea mays L.) and sorghum, when grown in the absence of water deficits. However, sorghum has been demonstrated to be superior to maize under three water stress conditions (Singh & Singh, 1995).
Sorghum research, just like any research involving other crops, requires knowledge of experimental techniques that will provide the maximum precision with a minimum of resources. The sampling techniques adopted are relevant since they can influence experimental precision and the resources used in research projects. When sampling plots, each experimen-tal unit is considered as a population (Gomez & Gomez, 1984).
A population consists of all possible values for a variable. Information about infinite populations (and sometimes about finite
true variance for an individual sampling unit taken from a plot. I.e., s2/ra estimates σ2/r + σ
a2/ra
or 1/r (σ2 + σ
a2/a). In this formula, it becomes evident
that the variance of a treatment mean is influenced by the number of replicates (r) and by the number of sampling units taken at each plot (a).
Due to the importance of the sampling techniques in agricultural experimentation, they have been studied in many crops, including wheat (Singla & Parshad, 2001), maize (Magary et al., 1996; Silva et al., 1997), rice (Ellis et al., 1991), soybean (Hunt et al., 1987), and cotton (Sabino et al., 1975), among other crops. In sorghum, only a single research work has been found in the consulted literature dealing with this subject (Wade and Ladewig, 1988). In most studies, it has been verified that by increasing sample size, the experimental precision can be increased, and that there is an optimal sample size. However, in a few cases this optimal size is not clearly defined (Rosa et al., 2002).
Among the sorghum traits that normally require sampling, since their evaluation is quite labor-intensive, are plant height, mass of the panicle and of the vegetative above-ground part of the plant (above-ground part without the panicle), and panicle length. Plant height evaluation is usually done by positively associating it with plant vigor and lodging. The masses of the panicle and of the vegetative above-ground part of the plant are evaluated based on their relationships with grain yield and forage yield.
The objective of this work was to evaluate the implications of sampling size over the results obtained with the application of tests F and Tukey in the analysis of variance of sorghum traits. Another objective was to identify ideal sample sizes for those traits, by using two methods: use of the experimental coefficient of variation value
(CV) alone; use of formulas involving either the CV or the variance value.
Material and Methods
The experiment was conducted in the municipality of Mossoró-RN (latitude 5º 11’ S, longitude 37º 20’ W, elevation 18 m).
The experiment was planted on a Red-Yellow Argisol (Red-Red-Yellow Podzolic) and was sprinkler-irrigated, with a two-day irrigation shift. The soil was tilled by means of two harrowings, and fertilization at sowing consisted of 30 kg N (ammonium sulfate), 40 kg P2O5 (single superphosphate) and 30 kg K2O (potassium chloride). Seeding was performed on 08.22.01, and four to six seeds per pit were used, at a spacing of 0.6 m between rows and 0.10 m between pits. A replanting operation was performed eight days after planting; thinning was conducted 29 days after planting, leaving a single plant/pit. Weeds were controlled by hoeing, 26 and 46 days after planting. A sidedressing application was carried out 46 days after planting, with 30 kg N/ha (ammonium sulfate).
Eight cultivars (AG-200SE, XPM 5287, DK 865, DK 860, Saara, Ambar, AG-1018, and DK 57), received from Sementes Agroceres, were evaluated on a randomized complete block design with four replicates. Each plot consisted of three 5.5 m long rows. The usable area was considered as the area occupied by the central row, with the elimination of ten pits at each end. At 90 days after planting, all usable plants were evaluated for plant height, panicle length, and fresh matter in the panicle and in the rest of the plant (“vegetative part”). Plant height was obtained by measuring the distance from soil level to the tip of the panicle. Panicle length was obtained by measuring the distance from the tip of the panicle to the last internode on the stalk. Fresh
matter yields were evaluated by weighing the plants cut even at ground level. Of those plants, about 30 were taken at random and ground in a forage chopper, and a sample of about 500 g was placed in a forced air circulation oven, adjusted to a temperature of 60 to 70 o C, until constant
weight. A similar procedure was carried out for 30 panicles. The dry matter yields of the panicle and of the vegetative part of the plants were estimated based on the dry matter weight of the samples.
Two methods were used for ideal sample size estimation: a) use of the experimental coefficient of variation value (CV) alone as a criterion, as adopted by some authors (Wolkowski et al., 1988); b) use of formulas involving either the variance value (Thompson, 1992).
Use of the CV value alone
Eight sample sizes were evaluated (from 5 to 40 sampling units, at five sampling-unit intervals), in addition to a sample size corresponding to all plants in the plot. For each experimental unit, drawings were conducted independently with a random number table. For example, when drawing for panicles, in the case of sample size 5, only five panicles were drawn from among the panicles produced in each plot.
In the case of sample size 10, ten panicles were drawn per plot, and so on.
For the traits under study, one analysis of variance was performed for each sample size, utilizing the means (of the values for 5, . . . , 45 plants or panicles) (Steel et al., 1997).
Use of formula
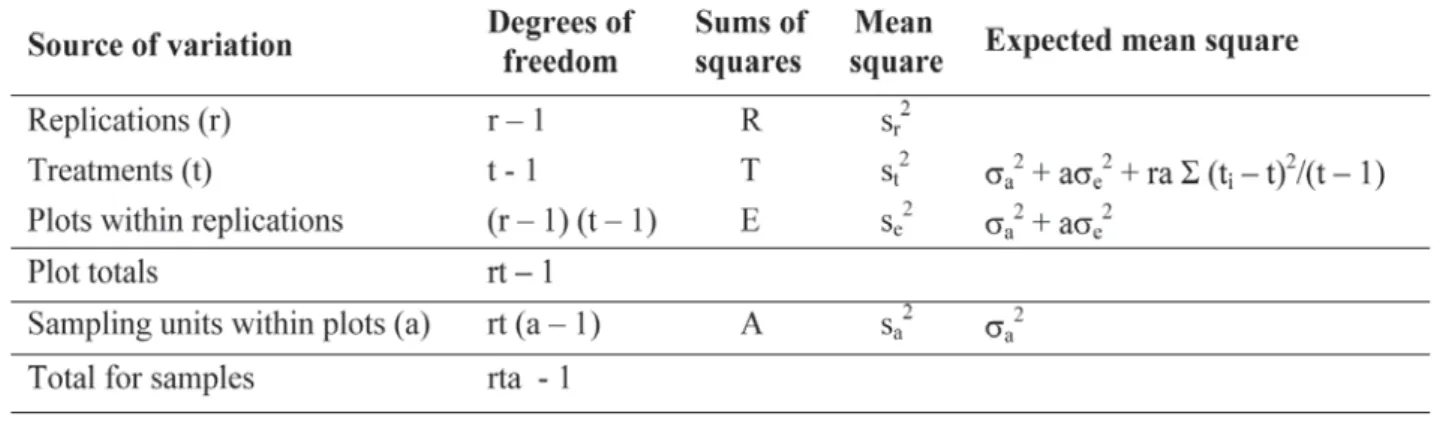
Consider a randomized block experiment with t treatments and r blocks. Let each plot be made of A sampling units of which a random sample of k units are taken for recording of observations. Let yij1 be the value of the 1-th sampling unit of the (1,j)-th plot. Then yij1 = µ + ri + tj + pij + sij1, where, µ, ri and tj are as usual the general mean, i-th block and j-th treatments effects, respectively, pij is the component of error specific to all sampling units in (i,j)-th plot, and sij1 the error component specific to the 1-th sampling unit in (i,j)-th plot and varies from sampling unit to sampling unit within the plot. We further assume that the two components pij and sij1 are independently distributed with zero expectations and variances given by se2 and s
a2.
With the above model, the variance of an estimated plot mean based on a sampling unit is given by sy2 = 1/r (σ
e2 + σa2/a). Where σe2 and σa2
are obtained from Table 1.
The sampling intensity by the use of mula derives from the variance of the mean for-mula (sy2), where n is isolated (Thompson,
1992). With simple random sampling, the sample mean is an unbiased estimator of the population mean µ with variance var = (N – n) s2/(Nn). Setting z (N – n)/N . σ2/n = d and
solving for n gives the necessary sample size: n = 1/(1/no + 1/N), where no = z2 σ2/d2. In the
present work, the required sampling intensity (n), for the specified sampling error (d) and confidence probability (z), could be calculated as a function of variance (sx2). In the present case,
N = population size = total number of plants evaluated in the plot = 45, in the present case,
z(0.05) = 1.96 and d = LE. , with LE as the
sampling error limit admitted = 5%. The variance values for plant height, dry matter in the vegetative above-ground part of the plant, length and panicle dry matter were 7.02, 32.33, 0.51 and 10.4, respectively.
Results and Discussion Use of the CV value alone
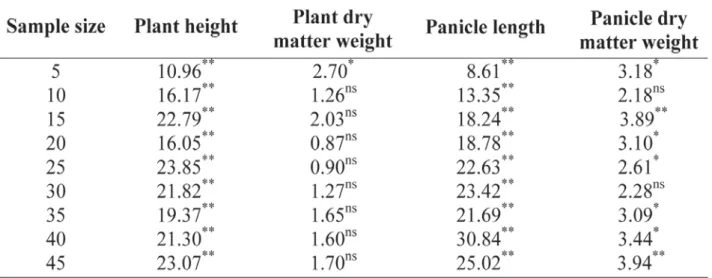
Application of the F test in the analysis of variance of data obtained with the eight sample sizes was significant only for plant height and panicle length (Table 2). In other words, the F test indicated an effect of cultivars within samplings, at 1 % probability; the same happened when all plants or panicles in the plot (“population”) were evaluated. For the other traits, this concordance did not occur (Table 2). With regard to dry matter weight in the vegetative above-ground part of the plant, the F test indicated a significant effect with a 5-plant sample, but non-significant effects were obtained with the other sample sizes or when all plants in the plot were evaluated. With respect to panicle dry matter weight, the effects were either non-significant or significant for some sample sizes, at 5 % or at 1% probability, depending on the sample size considered.
TABLE 2. Calculated values for F test application in the analysis of variance of data referring to height, plant dry matter weight, and panicle dry matter length and weight, obtained with sample sizes, in eight sorghum cultivars.
Discrepancies similar to those observed with the F test occurred with the application of Tukey test to verify differences between cultivars, with respect to sample sizes (Table 3). In relation to panicle dry matter weight, discordances also occurred for some sample sizes between the results of the application of tests F and Tukey (Tables 2 and 3). For example, with a sample size of 15 plants, the F test indicated a significant effect at 1 % probability, but Tukey test only indicated significance at 5 % probability. With a sample size of 40 plants, the F test indicated a significant effect, but the Tukey test did not. Discrepancies between the two tests might occur and would be due to the acceptance of different hypotheses in the theoretical deductions made for both tests (Pimentel Gomes, 1990).
Discordances between the results of the application of tests F or Tukey, when different sample sizes (Silva et al., 1998) or sampling methods (Sabino et al., 1975) are considered, were observed by other authors. The discordances might result in different conclusions from those that would be obtained if all plants in the plot
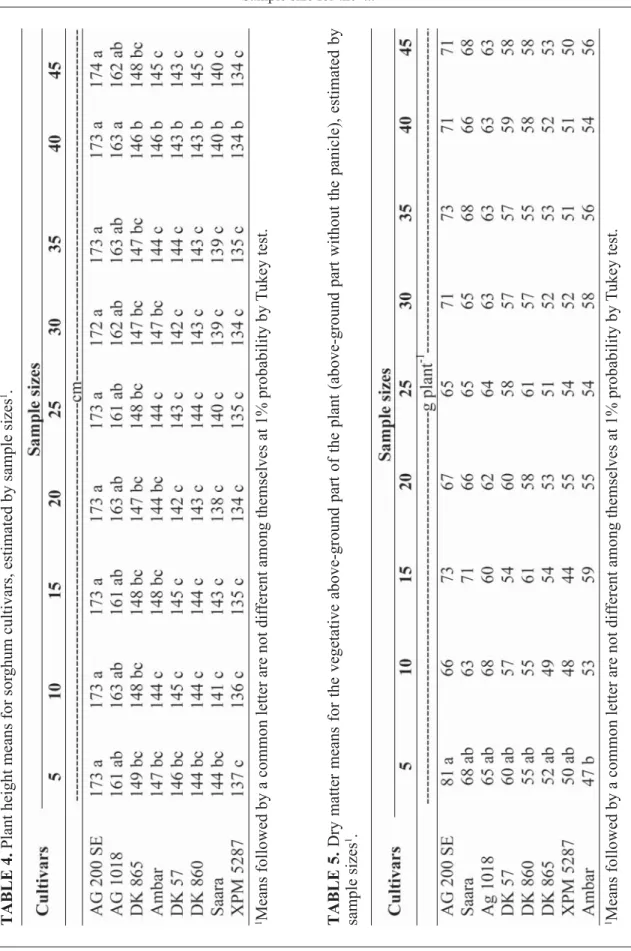
were considered (Tables 4 through 7). Cultivars AG 200 and AG 1018 showed the greatest plant heights when 40 plants were utilized in the evaluation. For the other sample sizes, only cul-tivar AG 200 was superior (Table 4). Obviously, these two cultivars were not different between themselves, at all sample sizes studied. Significant differences between cultivars with regard to dry matter weight in the above-ground part of the plant were observed only when 5 sampling units were adopted (Table 5). In this case, the only difference occurred between cultivars AG 200 and Ambar. The largest panicles were yielded by cultivars AG 1018, DK 57, and Saara, when 5 panicles were evaluated (Table 6). When 25 panicles were adopted, cultivar DK 865 showed the longest panicle length. When 30 or 35 panicles were evaluated, cultivars AG 1018 and DK 865 were superior. With reference to the other sample sizes, cultivars AG 1018, DK 57, Saara, and DK 865 were notable for showing the greatest panicles. It must be noted that the cultivars with the bigger panicles, when larger samples were used (for example, from 25 to 45 TABLE 3. Calculated values for Tukey test application in the analysis of variance of data referring to height, plant dry matter weight, and panicle dry matter length and weight, obtained with sample sizes, in eight sorghum cultivars.
TABLE 4.
Plant height means for sor
ghum cultivars, estimated by sample sizes
1 .
1 Means followed by a common letter are not dif
ferent among themselves at 1% probability by
T
ukey test.
TABLE 5.
Dry matter means for the vegetative above-ground part of the plant (above-ground part without the panicle), estimated by
sample sizes
1 .
1 Means followed by a common letter are not dif
ferent among themselves at 1% probability by
T
panicles), were also among those with the bigger panicles, when smaller sample sizes were adopted (from 5 to 20 panicles). However, a better discrimination of cultivars was obtained with larger sample sizes. Cultivar AG 200 showed the greatest panicle mass, when 5, 15 or 35 panicles were weighed (Table 7). There were no differences between cultivars when 10, 20, 30, or 40 panicles were evaluated. When 25 panicles were weighed, cultivar DK 860 showed the heaviest panicles. Cultivars AG 200 and DK 865 showed the highest mean panicle weight when all panicles in the plot were evaluated.
As long as random methods are utilized in obtaining the samples, such as in the present work, the discrepancies between population and sample parameters should be explained by chance. In probabilistic samplings, chance is the only factor responsible for eventual discrepancies between population and sample, and this is taken into consideration in inductive statistics analysis methods (Costa Neto, 1977). In other words, a random sample could be non-representative, but it is more likely to be representative than non-random samples (LeClerg et al., 1966).
It is probable that the discrepancies we referred to in this work are associated, at least in part, with the nature of the traits being evaluated. In traits considerably influenced by the environment, or more subject to measurement errors, those discrepancies perhaps occur more frequently. In the present work, the discrepancies occurred only with regard to the dry matter weights of the plant and the panicle. Plant dry matter evaluation requires cutting, weighing, grinding, homogenizing, and sampling the fresh material, and then placing it in an oven in order to subsequently weigh the dry sample. All these processes are sources of error. In addition, the samples left to dry must be relatively small,
TABLE 6.
Panicle length means, estimated with sample sizes, of sor
ghum cultivars
1
1Means followed by a common letter are not dif
ferent among themselves at 1% probability by
T
because a great number of samples are usually involved and the drying capacity of the ovens is limited. In the panicle dry matter evaluation the problem could be grain loss.
It can be observed that for plant height, aboveground dry mass, panicle length and panicle dry mass the coefficient of variation (CV) value tended to decrease as sample size increased (Table 8). In spite of this tendency, cases occurred in which the CV values for certain sample sizes were smaller than the corresponding values obtained for larger samples. For example, with regard to plant height, the CV value obtained for twenty plants, was larger than that obtained with the fifteen plants. With respect to the above ground dry mass, similar behavior was observed with sample sizes twenty five and twenty. It is possible that the greater CV values observed with larger samples simply occur by chance or due to sampling errors. However, in general, there was a tendency for reduction in CV values as sample size increased, and this tendency was more marked at smaller sizes. Other researchers (Kittock et al., 1986; Rosseti et al., 1986; Silva et al., 1998) have obtained similar results.
Considering exclusively the values for the coefficient of variation (CV) as a selection criterion to determine the most adequate sample size, it can be observed that 25 sampling units seem to represent ideal sample sizes to estimate the four traits evaluated (Table 7). In the case of plant height and panicle length, greater sample sizes do not provide increased precision, as indicated by the CV values. In addition, the above-mentioned sample sizes give CV values of similar magnitude as those obtained with the evaluation of all usable sampling units in the plot (“population”). In the case of both plant and panicle dry matter, the adoption of a 25-plant sample would result in loss of precision
TABLE 7.
Panicle dry matter means for sor
ghum cultivars, estimated with sample sizes
1 .
1 Means followed by a common letter are not dif
ferent among themselves at 1% probability by
T
TABLE 8. Coefficient of variation values for sorghum cultivar traits, estimated based on the analysis of variance of data obtained from sample sizes.
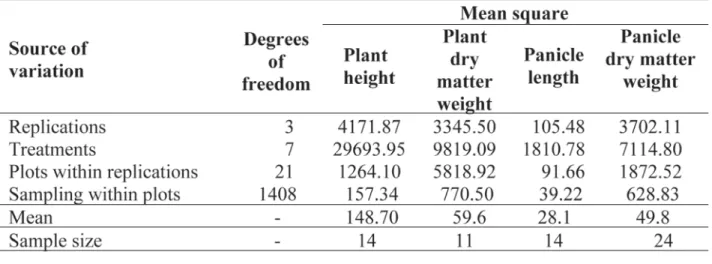
TABLE 9. Analysis of variance and sample size for the estimation of sorghum cultivar characteristics. (approximately 1 percentage point in the CV
value), relative to the evaluation of 40 plants or of all (45) plants in the plot. This precision loss would certainly be worthwhile in face of the increased labor and costs that would result from the inclusion of another 15 to 20 plants in the sample.
Use of formula
It was verified that to estimate plant height, dry matter in the above-ground part of the
plant, panicle length, and panicle dry matter, the ideal sample sizes would be 14 plants, 11 plants, 14 panicles, and 24 panicles, respectively (Table 9). Therefore, the adoption of formulas to predict sample sizes for sorghum characteristics could provide values different from those in which the sample sizes are obtained exclusively as a function of CV (Table 8).
Sampling frequently requires common sense and practicality. In addition, it must also
change according to the objectives of the work. When the main interest is to detect significant differences in a given trait, all plants in the plot must be taken into consideration and an attempt must be made to reduce the experimental error to the maximum extent possible, by controlling the experimental material’s variability as well as disuniformity in the experimental conditions. No papers were found in the consulted literature dealing with the sampling of traits studied in this research. In maize, several sampling studies have been carried out. For plant height evaluation, the adoption of 5 (Silva et al., 1997) to 8 plants (Sil-va et al., 1998) has been suggested. For plant dry matter estimation, it has been suggested (Wolkowski et al., 1988) that 10 to 15 sampling units should be used, while for length ear evaluation the suggested sampling size is at least 11 ears (Silva et al., 1998).
It must be mentioned that the environment conditions and cultivars influence the ideal sample size, as demonstrated in soybean (Storck et al., 1980; Estefanel et al., 1984) and maize (Wolkowski et al., 1988). This would explain why different ideal sample sizes are obtained by different authors, for the same trait.
Conclusions
It was concluded that the F and Tukey tests, based on samples, could result in different conclusions from those obtained when all plants in the plot are utilized to evaluate dry matter in the above-ground part of the plant (DMP) and panicle dry matter (PDM). About 25 units represent samples for the estimation of the four characteristics, when the CV value is used. The adoption of the sample size formula proved that to estimate plant height, DMP, panicle length, and PDM, the ideal sample sizes would be 14 plants, 11 plants, 14 panicles, and 24 panicles, respectively.
Literature Cited
COCHRAN, W.G. Sampling techniques. 3. ed. New York: J. Wiley, 1977. 428 p.
COSTA NETO, P. L. de O. Estatística. São Pau-lo: Edgard Blücher, 1977. 263 p.
ELLIS, J. E.; COUNCE, P. A.; COX, A. D. Sample number effect on precision of measurements of rice canopy photosynthesis and leaf area. Crop Science, Madison, v. 31, p.1077-1080, 1991. ESTEFANEL, V.; SACCOL, A. V.; SCHNEIDER, F. M.; BURIOL, G. A. B.; HELDWEIN, A. B.; MANFRON, P. A. Tamanho da amostra para esti-mar características da soja. Revista do Centro de Ciências Rurais, Santa Maria, v. 14, p. 221-229, 1984.
GOMEZ, K. A.; GOMEZ, A. A. Statistical procedures for agricultural research. New York: J. Wiley, 1984. 680 p.
HUNT, P. G.; BURNHAM, K. P.; MATHENY, T. A. Precision and bias of various soybean dry matter sampling techniques. Agronomy Journal, Madison, v. 79, p. 425-428, 1987.
KITTOCK, D. L.; CAIN, C. J.; SELLEY, R. A.; TAYLOR, B. B. Samples need for estimation of plant height of pima cotton. Agronomy Journal, Madison, v. 78, p. 546-547, 1986.
LeCLERG, E. L.; LEONARD, W. H. E.; CLARK, A. G. Field plot technique. Minneapolis: Burgess, 1966. 373 p.
MAGARI, R.; KANG, M. S.; ZHANG, Y. Sample size for evaluation field ear moisture loss rate in maize. Maydica, Bergamo, v. 45, p. 19-24, 1996. PIMENTEL-GOMES, F. Curso de estatística experimental. 13.ed. Nobel: Piracicaba, 1990. 467 p.
ROSA, S. D. V. F. da; PINHO, E. V. R. von; VIEIRA, M. das G. G. C. Efeito do tamanho da amostra sobre alguns parâmetros físicos de espiga de milho e da qualidade fisiológica das sementes. Ciência e Agrotecnologia, Lavras, v. 26, p. 57-65, 2002.
ROSSETTI, A. G.; PEREIRA, A. V.; PIMENTEL-GOMES, F. A amostragem na ex-perimentação em viveiro de seringueira. Pesquisa Agropecuária Brasileira, Brasília, DF, v. 21, p. 837-841, 1989.
SABINO, N. P.; LAZZARINI, J. F.; GRIDÍ-PAPP, I. L.; FUZATTO, M. G.; GROSSI, J. M. M.. Estu-dos de amostragem de capulhos em canteiros ex-perimentais de algodão. Bragantia, Campinas, v. 34, p. 163-169, 1975.
SILVA, P. S. L. e; BEZERRA, A. R.; OLIVEIRA, F. H. T. de; SILVA, K. M. B. e. Efeitos da amostragem não-aleatória e do tamanho da amos-tra na estimação de dois caracteres do milho. Re-vista Ceres, Viçosa, v. 44, p. 72-82, 1997. SILVA, J.; SILVA, P. S. L. e; NUNES, R. de P. Amostragem e tamanho da amostra na estimação de caracteres da espiga do milho. Pesquisa Agropecuária Brasileira, Brasília, DF, v. 33, p. 1983-1988, 1998.
SILVA, F. F. da; GONÇALVES, L. C.; RODRIGUES, J. A. S.; CORRÊA, C. E. S.; RODRIGUEZ, N. M.; BRITO, A. F.; MOURÃO, G. B. Qualidade de silagens de híbridos de sorgo de portes baixo, médio e alto com diferentes pro-porções de colmo + folhas/panícula. 1. Avaliação do processo fermentativo. Revista Brasileira de Zootecnia, Viçosa, v. 28, p. 14-20, 1999.
SINGH, B. R.; SINGH, D. P. Agronomic and physiological responses of sorghum, maize and
pearl millet to irrigation. Field Crop Research, Amsterdam, v. 42, p. 57-67, 1995.
SINGLA N.; PARSHAD, V. R. Comparison of sampling methods and sample sizes for the assessment of pre-harvest rodent damage in wheat (Triticum aestivum) fields. Indian Journal of Agricultural Sciences, New Delhi, v. 71, p. 106-108, 2001.
STORCK, L.; PISSAIA, A.; COLASANTE, L. O.; COSTA, J. A. Influência de cultivares, estádios e níveis de desfolhamento sobre o tamanho da amos-tra para avaliação de características agronômicas em soja (Glycine max (L.) Merril). Revista do Centro de Ciências Rurais, Santa Maria, v.10, p. 199-209, 1980.
STONE, L. R.; SCHLEGEL, R. E.; GWIN, R. E.; KHAN, A .H. Response of corn, grain sorghum, and sunflower to irrigation in the High Plains of Kansas. Agriculture Water Management, Amsterdam, v. 30, p. 251-259, 1996.
STEEL, R. G. D.; TORRIE, J. H.; DICKEY, D. A. Principles and procedures of statistics: a biometrical approach. New York: McGraw-Hill, 1997. 666 p.
THOMPSON, S. K. Sampling. New York: J. Wiley, 1992. 343 p.
WOLKOWSKI, R. P.; REISDORF, T. A.; BUNDY, L. G. Field plot technique comparison for estimating corn grain and dry matter yield. Agronomy Journal, Madison, v. 80, p. 278-280, 1988. WADE, L. J.; LADEWIG, J. H. Influence of quadrat sampling intensity on precision of grain sorghum yield data. Australian Journal of Ex-perimental Agriculture, Victoria, v. 28, p. 211-214, 1988.