Miguel Carvalho Ravasco Milhano Correia
Licenciado em BioquímicaModulation of the carotid body activity
to treat obesity
Dissertação para obtenção do Grau de Mestre em Bioquímica para a Saúde
Orientadora: Prof.ª Doutora Sílvia Conde, Professora Auxiliar, CEDOC – NOVA Medical School, Faculdade de
Ciências Médicas, UNL
Setembro 2017
M o d u l a t i o n o f t h e c a r o t i d b o d y a c t i v i t y t o t r e a t o b e 2017
Miguel Carvalho Ravasco Milhano Correia
Licenciado em BioquímicaModulation of the carotid body activity
to treat obesity
Dissertação para obtenção do Grau de Mestre em Bioquímica para a Saúde
Orientadora: Prof.ª Doutora Sílvia Conde, Professora Auxiliar, CEDOC – NOVA Medical School, Faculdade de
Ciências Médicas, UNL
Júri:
Presidente: Prof. Doutor António Sebastião Rodrigues Arguente: Prof. Doutor António Pedro Barros Gomes
Docente da Comissão Pedagógica: Prof.ª Doutora Maria Teresa Nunes Mangas Catarino
Orientadora: Prof.ª Doutora Sílvia Conde
Faculdade de Ciências Médicas, Universidade Nova de Lisboa
“Modulation of the carotid body activity to treat obesity “Copyright © Miguel Carvalho Ravasco Milhano Correia, Faculdade de Ciências e Tecnologia, Universidade Nova de Lisboa
A Faculdade de Ciências e Tecnologia e a Universidade Nova de Lisboa têm o direito, perpétuo e sem limites geográficos, de arquivar e publicar esta dissertação através de exemplares impressos reproduzidos em papel ou de forma digital, ou por qualquer outro meio conhecido ou que venha a ser inventado, e de a divulgar através de repositórios científicos e de admitir a sua cópia e distribuição com objectivos educacionais ou de investigação, não comerciais, desde que seja dado crédito ao autor e editor.
There are several people I must thank for their continued support throughout the time it took to complete this most important step in my life:
First, I would like to give a huge thanks to my supervisor Professor Sílvia Conde, for accepting me in this project and letting me work alongside her group in the laboratory; for the teachings offered to me, to help me grow up not only as a scientific worker, but as a person as well and for her enormous patience
To Bernardete and Joana, my seniors in the lab, who always had the patience and the willingness to answer my, sometimes dumb, questions and doubts. Thank you for showing me the ways around a full-fledged laboratory.
To my fellow future masters, Cláudia and Marlene, for their unending support and patience, for their words of encouragement; mostly for allowing me to work alongside them while we strove towards our individual goals this year; it was a big pleasure of mine to work with you, even if it could be sometimes “frustrating” to all of us. We all had those days. I guess it’s a part of the job!
To my girlfriend, Joana Ferreira, my pillar of faith, my light in times of darkness, you always believed in me and that I could finish when times got hard and the adversities didn’t seem to end. You were always there for me when I needed you. Thank you for your patience and love, I grew a lot as a person in this long year, and I owe it all to you. The work I present here would not be here if it weren’t for you. Thank you for everything!
To my friends for listening to my rants and complaints and who were always ready to bring a smile to my face and a laugh out of me when things were grim. You guys are the best.
And last, but not least, to my family, who raised me into who I am today. I know this year we saw a lot less of each other, but I still missed you every single day. To my brother and sister, I thank their shenanigans and crazy times we shared. To my mother and father, thank you for making me more aware of my potential and what I can achieve, for believing in me and teaching me the “hard lessons of life”. Thank you all for your love.
Nowadays the prevalence of obesity is rapidly increasing to levels higher than several decades ago. Associated to obesity are cardiovascular diseases, type II diabetes mellitus and cancer. Recently, it has been proposed that the carotid body (CB), a classic mediator of hypoxic responses, plays a role in energy and glucose homeostasis regulation and that its activity could be modulated to treat metabolic pathologies such as obesity and type II diabetes.
In this thesis, we have used a genetic animal model of obesity and diabetes, by the lack of functional leptin receptors, the Zucker diabetic fatty (ZDF) rats, to investigate the role of the CB in the development of obesity and to evaluate the impact of carotid sinus nerve (CSN) denervation on obesity and on metabolic dysfunction. Male ZDF rats with fasting glycemia over 120 mg/dl at 10 weeks old and lean controls were submitted to CSN resection or sham procedure (early stage group). Another group of animals was left until the 18th week and submitted to CSN resection or sham procedure (late stage group). Weight gain, insulin sensitivity and glucose tolerance have been evaluated. Assessment of basal ventilation, as well as hypoxic and hypercapnic ventilatory responses, blood pressure, heart rate, and paO2 was performed. After the sacrifice, the major fat depots’ mass and liver lipid content was assessed.
In early and late stage animals, we found that CSN resection did not modify weight gain, glucose tolerance, fat mass deposition and insulin secretion. However, produced a small decrease in fasting glycemia, totally reversed insulin resistance and decreased lipid deposition in the liver.
We can conclude that modulation of the CB in this genetic model appears to play an important role in counteracting insulin resistance, however it does not seem to be a good method for the treatment of obesity per se.
Keywords: Obesity, insulin resistance, Zucker diabetic fatty rats, leptin, Carotid body,
Atualmente, a prevalência da obesidade está a aumentar rapidamente comparando a várias décadas atrás. Associadas à obesidade estão as doenças cardiovasculares, diabetes de tipo II e cancro. Recentemente, foi proposto que o corpo carotídeo (CB), um clássico mediador de respostas hipóxicas, participa na regulação homeostática energética e da glucose e a sua atividade pode ser modulada para tratar patologias metabólicas como a obesidade e a diabetes de tipo II.
Nesta tese, utilizámos um modelo genético animal da obesidade e diabetes, que não apresenta recetores de leptina funcionais, ratos Zucker diabetic fatty (ZDF), para investigar o papel dos CB no desenvolvimento da obesidade e avaliar o impacto da desnervação do nervo do seio carotídeo (CSN) na obesidade e disfunção metabólica. ZDF machos com glicemias em jejum de 120 mg/dl e controlos lean foram submetidos ao corte do CSN ou a um procedimento sham às 10 semanas (grupo estágio inicial). Outro grupo de animais foi apenas submetido ao corte do CSN ou ao sham às 18 semanas de idade (grupo estágio tardio). O ganho de peso, sensibilidade à insulina e tolerância à glucose foram avaliadas. A avaliação da ventilação basal, respostas ventilatórias à hipoxia e à hipercapnia, pressão arterial, frequência cardíaca e paO2 também foi realizada. Depois do sacrifício, os maiores depósitos de gordura e o conteúdo lipídico do fígado também foram avaliados.
Nos animais dos estágios inicial e tardio, descobrimos que o corte do CSN não modificou o ganho de peso, tolerância à glucose, deposição de massa gorda e secreção de insulina. Porém, reduziu ligeiramente a glicemia em jejum, reverteu totalmente a resistência à insulina e diminuiu a deposição lipídica no fígado.
Podemos concluir que a modulação do CB neste modelo genético apenas parece contrariar a resistência à insulina, todavia não parece ser o melhor método para tratar a obesidade.
Palavras-chave: Obesidade, resistência à insulina, ratos Zucker diabetic fatty, leptina,
1. Introduction ... 1
1.1. Obesity as an epidemic disease: linking the disease with insulin resistance ... 1
1.2. Glucose and lipids metabolism ... 3
1.3. Insulin production: indicator of insulin resistance ... 5
1.4. The adipose tissue as an endocrine and storage organ ... 7
1.4.1. White adipose tissue ... 8
1.4.2. Brown adipose tissue and UCP1 ... 9
1.4.3. Beige adipocytes ... 10
1.5. Leptin and its receptor, Ob-R ... 11
1.6. The sympathetic nervous system and the carotid body ... 13
2. Aims ... 17
3. Methods ... 19
3.1. Animal care and diets ... 19
3.2. Experimental design ... 19
3.3. Surgical and animal sacrifice procedures ... 20
3.4. Evaluation of the insulin sensitivity ... 21
3.5. Evaluation of the glucose tolerance ... 21
3.6. Recording of basal ventilation and ventilatory responses to hypoxia and hypercapnia through whole-body plethysmography ... 22
3.7. ELISA kits for the quantification of insulin and C-peptide in blood serum samples. ... 22
3.8. Quantification of the lipid content in the liver ... 23
3.9. Data Analysis ... 23
4. Results ... 25
4.1. Caloric and liquid intake is not affected by the CSN resection nor the surgery .. ... 25
4.3. Effect of Fa/Fa phenotype and CSN resection on insulin sensitivity and
glucose tolerance ... 31
4.3.1. Insulin sensitivity on the Fa/Fa animals is improved by the CSN resection 31 4.3.2. Effect of CSN resection on glucose tolerance ... 33
4.4. Effect of Fa/Fa phenotype and CSN resection on basal ventilation and in the responses to hypoxia and hypercapnia ... 35
4.5. Effect of Fa/Fa phenotype and CSN resection on blood pressure ... 41
4.6. Effect of Fa/Fa phenotype and CSN resection on insulin secretion. ... 42
4.7. Effect of Fa/Fa phenotype and CSN resection on fat mass deposition ... 46
4.8. Effect of Fa/Fa phenotype and CSN resection on liver lipid deposition ... 47
5. Discussion ... 49
6. Conclusions ... 59
7. Future Work ... 61
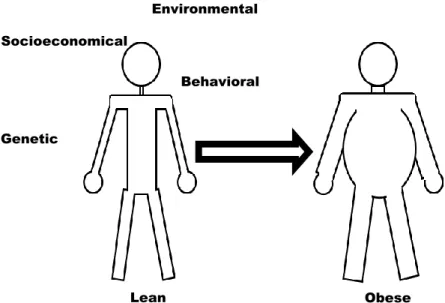
Figure 1 – Factors that (not only the now outdated, “lack of willpower” thinking) contribute to an increase in weight leading to obesity, development of cardiovascular
problems, insulin resistance and diabetes. ... 1
Figure 2 - Insulin pathway. ... 4
Figure 3 – Sulfonylurea-dependent insulin release. ... 6
Figure 4 – Relative β-cell function over the progression of the disease. ... 7
Figure 5 – Adipose tissue and its variety of phenotypes. ... 8
Figure 6 – The Zucker Diabetic Fatty Rat. ... 13
Figure 7 - Possible link between the carotid body, the SNS, metabolic diseases and the adipose tissue. ... 16
Figure 8 - Workflow for this project. ... 20
Figure 9 – Early stage animal growth curves. ... 27
Figure 10 – Late stage animals’ growth curves. ... 28
Figure 11 – Fasting glycemia evolution over time of the early stage animals. ... 30
Figure 12 – Fasting glycemia evolution over time of the late stage animals. ... 31
Figure 13 – Effect of Fa/Fa phenotype and CSN resection on insulin sensitivity in early stage animals. ... 32
Figure 14 – Effect of Fa/Fa phenotype and CSN resection on insulin sensitivity in late stage animals. ... 33
Figure 15 - Effect of Fa/Fa phenotype and CSN resection on glucose tolerance in the early stage animals... 34
Figure 16 - Effect of Fa/Fa phenotype and CSN resection on glucose tolerance in the late stage animals. ... 35
Figure 17 - Effect of Fa/Fa phenotype and CSN resection on basal minute value (VE). 37 Figure 18 – Effect of Fa/Fa phenotype and CSN resection on hypoxic and hypercapnic ventilatiory responses in the early stage animals. ... 39
Figure 19 – Effect of Fa/Fa phenotype and CSN resection on hypoxic and hypercapnic ventilatiory responses in the late stage animals. ... 40
Figure 20 – Effect of Fa/Fa phenotype and CSN resection on systolic, diastolic and mean blood pressure, heart rate and paO2 in early stage group. ... 42
Figure 21 – Effect of Fa/Fa phenotype and CSN resection on fasting insulin plasma levels ... 44
levels. ... 46 Figure 23 – Effect of Fa/Fa phenotype and CSN resection on total fat mass (%) in early (a) and late stage (b) animals. ... 47 Figure 24 – Effect of Fa/fa phenotype and CSN resection on liver lipid deposition ... 48
Table 1 - Early stage caloric and liquid intake, before and after surgery. ... 26
Table 2 – Late stage caloric and liquid intake. before and after surgery. ... 26
Table 3 – Growth rates for the early stage animals. ... 27
ADP – Adenosine diphosphate Apo – Apolipoprotein
ATP – Adenosine triphosphate AUC – Area under the curve BAT – Brown adipose tissue BMI – Body mass index BP – Blood pressure
cAMP – cyclic-adenosine monophosphate CB – Carotid body
CSN – Carotid sinus nerve DBP – Diastolic blood pressure FFA – Free fatty acid
FGF – Fibroblast growth factor GLUT – Glucose transport protein HDL – High-density lipoprotein HR – Heart rate
IL – Interleukin IR – Insulin receptor
IRS – Insulin receptor substrate ITT – Insulin tolerance test
KITT – Constant rate for glucose disappearance MBP – Mean blood pressure
NEFA - Non-esterified fatty acids NPY – Neuropeptide Y
Ob-R – Leptin receptor
OGTT – Oral glucose tolerance test PDE -Phosphodiesterase
PGC – Peroxisome proliferator-activated receptor gamma coactivator PI3K – Phosphatidylinositol 3-kinase
PIP3 – Phosphatidylinositol 3,4,5-triphosphate
PRDI-BF – Positive regulatory domain I-binding factor
PRDM - PRDI-BF and RIZ homology domain containing protein PPAR – peroxisome proliferator-activated receptor
RIZ – Retinoblastoma interacting zinc finger SBP – Systolic blood pressure
SH2 – Src homology 2
SNS – Sympathetic nervous system TAG – Triacylglycerol
TNF – Tumor necrosis factor UCP – Uncoupling protein VE – Minute ventilation
VLDL – Very low-density lipoprotein VT – Tidal volume
WAT – White adipose tissue ZDF – Zucker diabetic fatty
1. Introduction
1.1. Obesity as an epidemic disease: linking the disease with insulin resistance
Nowadays, all around the world, the prevalence of overweight people is much greater when compared to several decades ago. According to the World Health Organization, since 1980 the number of obese people has more than doubled, making this disease a public health problem which is spread indiscriminately across all ages, affecting more than 500 million adults (Cefalu et al., 2015; Zafrir, 2013). The situation turns darker when, coupled to a higher body mass index (BMI) come several other pathologies that give birth to the metabolic syndrome, which has its central cause in abdominal obesity, and includes cardiovascular comorbidities, insulin resistance and type II diabetes, hypertension, obstructive sleep apnea disorder and even several kinds of cancer (Conde et al., 2014; Goossens, 2008; Klop, Elte & Cabezas, 2013; McDonald
et al., 2011).
The Portuguese situation is not less serious, as for decades now there has been a scenario much like the one that is seen in the rest of the world. In 2014, the results of the enquiries made by Instituto Nacional de Estatística showed that more than half of
Socioeconomical
Behavioral
Genetic
Environmental
Lean Obese
Figure 1 – Factors that (not only the now outdated, “lack of willpower” thinking) contribute to an increase in weight leading to obesity, development of cardiovascular problems, insulin resistance and diabetes.
the population aged 18 years old or older was overweight or obese (Instituto Nacional de Estatística, 2016; Santos, Kislaya & Gaio, 2016).
Obesity originates from different factors, not only environmental but also genetic, behavioral and socio-economical that culminate in a metabolic disorder which consists in the disturbance of the balance between energy uptake, energy expenditure and its storage (Figure 1) (Friedman & Halaas, 1998; Hausman et al., 2001; Trayhurn, 2017). This balance becomes positive energetically and is followed closely by the increase in the size of the fat cells, adipocytes (Goossens, 2008; Trayhurn & Beattie, 2001; Zafrir, 2013). The excessive deposition of fats in the adipose tissue, responsible for the storage of energy in the form of fat molecules, is the main feature of this dysfunction. Consequently, associated with a hypertrophy of the adipose tissue, it begins an excessive accumulation of non-esterified fatty acids (NEFAs) and triacylglycerols (TAG) in other tissues like the liver, skeletal muscle and pancreas as well as in the blood, causing a pathology known as dyslipidemia. This, in turn, leads to a reduction in the sensitivity for insulin, due to the excess of energy in circulation, generating insulin resistance, characterized by the cells’ inability to respond properly to this hormone (Boucher, Kleinridders & Kahn, 2014; Goossens, 2008). Studies using magnetic resonance spectroscopy with 13C and 31P have also discovered that, in diabetic patients, glycogenesis, the formation of glycogen, is impaired, resulting in a 50% reduction in the speed of glycogenesis comparing with control healthy patients (Bays et al., 2013). Also, it has been found that insulin-activated glucose transport is affected in diabetic patients, further confirming a state of insulin resistance, mostly attributed to a lower expression and translocation of glucose transport protein (GLUT) 4.
In type II diabetes, the liver starts releasing glucose in an uncontrolled manner and this coupled with a lower rate for glycogenesis triggered by the peripheral insulin resistance, which in turn leads to the increase of insulin production by the β-cells in the pancreas originates hyperinsulinemia. In a later stage of the disease, this vicious cycle is closed when the pancreas is no longer able to cope with the increasing need of the organism for insulin, beginning its shutdown, and initiates a state of hypoinsulinemia with the subsequent increase in the glycemia values (hyperglycemia), worsening the disease. Obesity is a disease essentially metabolic in its nature and is hard to find isolated, since preceding it (or coming after it) is in most cases insulin resistance.
1.2. Glucose and lipids metabolism
Insulin action is essential for the normal glucose clearance. Mainly, this small protein (having only two polypeptide chains of 51 amino acids) works by increasing glucose uptake by cells, increasing glycogenesis in the liver and by inhibiting glucagon’s secretion in the pancreas’ α-cells (Balducci et al., 2010). In insulin-sensitive tissues, such as the muscle, adipose tissue and liver, it initiates a kinase cascade by binding to insulin receptors (IR) at the cells’ surface. IRs are tetrameric proteins with two extracellular subunits (α-subunits) that bind to the ligand and two intracellular subunits with tyrosine kinase activity (β-subunits). Upon insulin’s binding, this receptor’s β-subunits suffer a conformation change, promoting the auto-phosphorylation of its β-subunits. Afterwards, the receptor recruits substrates (commonly referred to as insulin receptor substrates, IRS) which bind to the β-subunits through pleckstrin and phosphotyrosine binding domains. In turn, these proteins are phosphorylated on several tyrosine residues originating a site for the binding of intracellular proteins with Src-homology 2 (SH2) domains (Boucher, Kleinridders e Kahn, 2014). These substrates call upon the phosphatidylinositol 3-kinase (PI3K) and integrate the serine-threonine kinase Akt 2 pathway. PI3K has a SH2 domain and binds to the phosphotyrosine-rich environment in the IRS, after which it phosphorylates the phosphatidylinositol 4,5-bisphosphate, creating phosphatidylinositol 3,4,5-trisphosphate (PIP3), a hydrophobic secondary messenger. This messenger then recruits Akt2 to the plasma membrane, which activates various processes involved in metabolism, growth and cell survival, to name a few (Boucher, Kleinridders & Kahn, 2014; Nelson et al., 2008).
Akt2, once active, can induce glycogenesis by inactivating glycogen synthase kinase 3 and consequently activating glycogen synthase, which leads to an increase in glycogen in the liver. Also it can phosphorylate peroxisome proliferator-activated receptor gamma coactivator (PGC) 1-α, inhibiting gluconeogenesis, reducing the formation of glucose as well as the oxidation of fatty acids in the cells (Bays et al., 2013; Boucher, Kleinridders & Kahn, 2014).
Another role for activated Akt2 is the regulation of lipolysis and β-cell insulin production. This is possible through the phosphorylation of phosphodiesterase (PDE) 3B, which becomes activated and decreases the concentration of cyclic-adenosine monophosphate (cAMP) in the cells. Furthermore, Akt2 is responsible for the deactivation of AS160, a protein that interacts with the vesicle transport-related Rab
proteins. This allows the increase in GLUT4 transport to the cell surface, increasing glucose uptake (Bays et al., 2013; Boucher, Kleinridders & Kahn, 2014) (Figure 2).
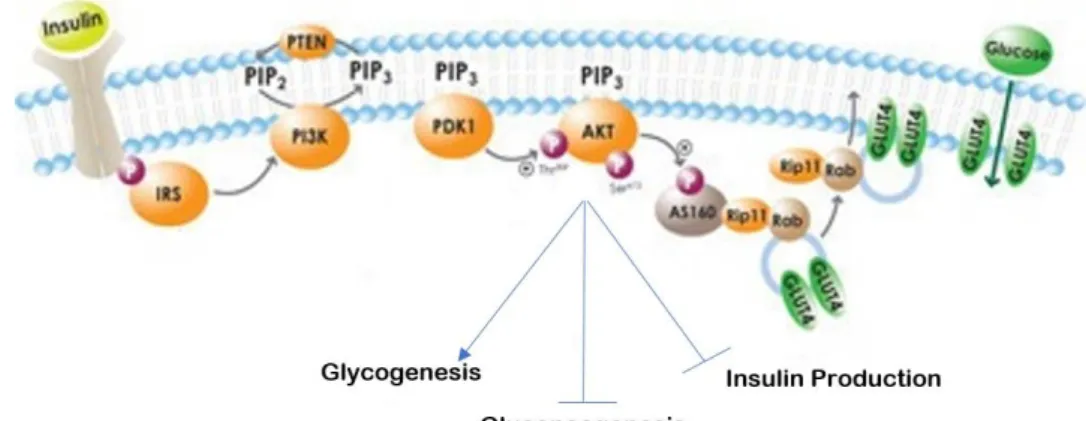
Figure 2 - Insulin pathway.
Upon its binding, insulin leads to the phosphorylation of its receptor and subsequently of the IRS. The latter will activate PI3K, which phosphorylate the phosphatidylinositol 4,5-bisphosphate into PIP3, a hydrophobic secondary messenger that travels through cell membrane and activates Akt. Akt can then have several outcomes, that ultimately lead to the control of glucose concentration in the blood (by turning it into glycogen, through glycogenesis, and by inhibiting gluconeogenesis) and generating a negative feedback loop, the production of insulin itself. Adapted from https://www.caymanchem.com/news/diabetes-and-insulin-signaling.
Lipids derived from fatty acids, triglycerides, follow a different route. When inside the organism, triglycerides are processed by lipases in the small intestine’s lumen and broken down into free-fatty acids (FFA), monoacylglycerol, diacylglycerol and glycerol which are transported by passive diffusion or by specific transporters into the intestine’s cells. Cholesterol is also transported into the intestine’s cells (Klop, Elte & Cabezas, 2013; Nelson et al., 2008). Triglycerides are then synthetized and cholesterol is changed into cholesterol-esters and then, along with the triglycerides and with the help of apolipoproteins (proteins that bind lipids, like apolipoprotein (Apo) B48) and phospholipids, they are all aggregated to originate chylomicrons, lipoproteic sphere particles. Depending on the composition of the chylomicrons these particles can be classified from very low density lipoproteins (VLDL) to high density lipoproteins (HDL), whether they are rich in lipids or rich in proteins, respectively. These particles are transported into the blood circulation, reaching the muscle or adipose tissues. If in the muscle, they will be recognized by lipoprotein lipases and hydrolyzed in β-oxidation
processes, to form energy, while in the adipose tissue they will be re-esterified into TAG, as large fat droplets, to store energy (Klop, Elte & Cabezas, 2013; Nelson et al., 2008). The type of adipose tissue will ultimately determine the lipids’ fate in the cell's metabolism.
1.3. Insulin production: indicator of insulin resistance
Insulin is one of the most important biomolecules for controlling the energy uptake in complex organisms like mammals. After a meal, insulin is produced by the β-cells in the pancreas’ Langerhans islets as a physiological response to the increase in blood glucose levels. This hormone then works towards the stabilization of glucose levels by the mechanisms described previously in section 1.2. Since the insulin pathway is so complex, there are several steps where a malfunction can occur, both during its production and during its action at the cell level. These signaling malfunctions can also be originated in genetic malformations, these being rarer, causing defects in any member of the insulin signaling pathway from the IR to Akt. These can take place at the IR itself, more commonly so in cases of diet-induced insulin resistance (Boucher, Kleinridders & Kahn, 2014; Kahn & Flier, 2000).
Insulin is produced in the endoplasmic reticulum of β-cells as pre-proinsulin, being composed by three chains, A, B and C, the latter being a small connecting peptide, also known as C-peptide. When insulin is synthesized, the B chain (forming the proinsulin, with only the A and C chains) and later the C chains are cleaved from the A chain, in the liver. Then the C-peptide and insulin are secreted as a response to glucose intake into the organism. C-peptide is not known to have any biological functions; however, it is very useful as an indicator for endogenous insulin levels. Insulin is secreted from β-cells in response to glucose and travels to the liver where it suffers a process called insulin clearance, where C-peptide is cleaved from the A chain forming the functional insulin hormone (Ido et al., 1997; Wilcox, 2005).
The release of insulin by the β-cells is controlled by several metabolic events that take place in the cytoplasm. The adenosine triphosphate (ATP)-sensitive K + channels normally allow the free flowing of potassium out of the cell. This process is mediated by the ATP/adenosine diphosphate (ADP) ratio inside the cell. When there is an increase in ATP caused by an increase in glucose uptake, these channels close, thus causing a depolarization of the cell’s membrane, opening the Ca2+ channels on the cell’s
surface. Ca2+ then acts as a secondary messenger responsible for the release of insulin held inside secretory granules found in the β-cells, thus leading to an increase in circulating insulin. In pathologies where insulin resistance is present there is also an impairment of glucose tolerance and the exocytotic mechanism of insulin, which is largely stimulated by the uptake of glucose, is greatly reduced. Therefore, a common treatment for increasing the secretion of insulin by the β-cells lies in the use of the sulfonylureas. The sulfonylureas can block the ATP-sensitive K+ channels by binding to sulfonylurea receptors at the cell’s surface, allowing for the increase in the insulin secretion without an increase in glucose uptake (Figure 3) (Alruwaili, 2016).
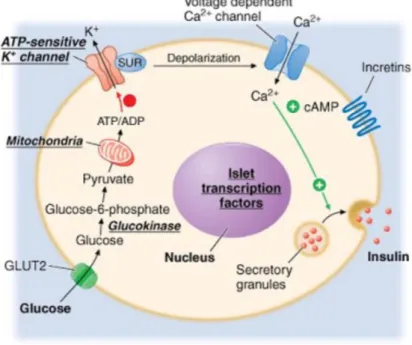
Figure 3 – Sulfonylurea-dependent insulin release.
Using sulfonylureas, insulin secretion by the pancreas’ β-cells can be achieved by overriding the otherwise necessary glucose uptake and subsequent increase in ATP production. This allows for an increase in insulin secretion, allowing the treatment of hyperglycemic pathologies like type II diabetes and obesity. (Alruwaili, 2016).
Insulin production and its concentration in the blood are correlated with the level of peripheral insulin resistance. The greater the level of insulin concentration found in a pathological state like type II diabetes and/or obesity, the higher the insulin resistance will be (Wilcox, 2005). In insulin resistance states, hyperinsulinemia is very common because the pancreas keeps secreting insulin in order to achieve a normal glucose uptake. Obesity, for example, is a very common trigger for insulin resistance as shown by Figure 4, where β-cell function is altered through the years because of the peripheral
insulin resistance and overall impaired glucose tolerance. The general increase in adipose tissue hypertrophy found in obesity is also responsible for the onset of diabetes, characterized by the increases in glycemia and circulating FFA, thus leading to uncontrolled hyperglycemia.
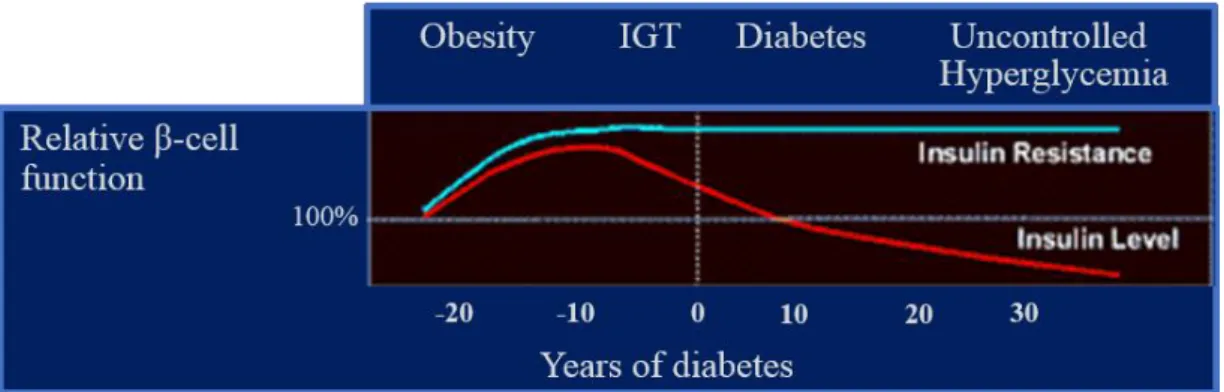
Figure 4 – Relative β-cell function over the progression of the disease.
From its beginning triggered by obesity, where the insulin resistance begins to take place in the periphery of the organism. This calls for an increase in β-cell activity due to an impaired glucose tolerance (IGT) followed by the development of type II diabetes. Later, the β-cell function begins to decline because of the reduced ability of the pancreas to deal with the uncontrolled hyperglycemia. Adapted from http://www.medscape.org/viewarticle/412860.
1.4. The adipose tissue as an endocrine and storage organ
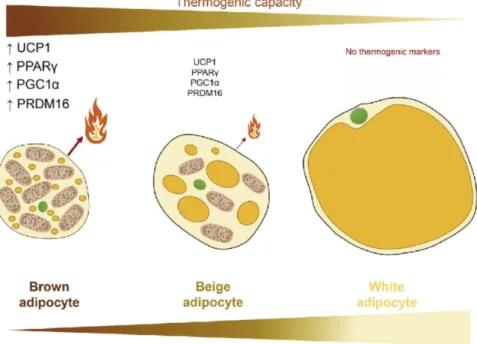
Adipose tissue is the main lipid storage depot in humans and 3 types have been described: white, brown and beige. The white adipose tissue (WAT) that classically acts as a storage depot for energy which could be mobilized in times of need, releasing FFA to be oxidized for energy in other tissues, like the heart or the skeletal muscle (Klop, Elte & Cabezas, 2013; Trayhurn & Beattie, 2001); the brown adipose tissue (BAT), that is tasked to produce energy in the form of heat, in a process called non-shivering thermogenesis; and the beige adipocytes, that are a type of adipose tissue that is capable of producing heat through non-shivering thermogenesis like BAT, however it is found as a result of the transformation of certain WAT adipocytes derived from myf5-expressing precursors that have been exposed to stimuli like cold or adenylate cyclase activators, thus changing their phenotype (Figure 5) (Sidossis & Kajimura, 2015).
Figure 5 – Adipose tissue and its variety of phenotypes.
On one end of the spectrum, WAT is incapable of producing heat and does not express any thermogenic markers, like uncoupling protein (UCP) 1. Furthermore, it shows the biggest lipid droplets, often found as one single molecule and is a classic storage for energy. On the other end, BAT is the most thermogenically capable adipose tissue, expressing in very high levels thermogenic markers like UCP1, PGC1α, positive regulatory domain I-binding factor (PRDI-BF)1 and retinoblastoma interacting zinc finger (RIZ) homology domain containing (PRDM)16 and peroxisome proliferator-activated receptor (PPAR)γ. It has the highest mitochondrial content and the least lipid droplets, which it uses for generating heat. Between the two are the beige adipocytes, capable of producing some heat through non-shivering thermogenesis, although in a lesser extent than BAT adipocytes, but still higher than WAT adipocytes. It has several multilocular lipid droplets and intermediate mitochondrial content. (Contreras et al., 2016).
1.4.1. White adipose tissue
WAT is made up by cells called adipocytes. These white adipocytes are big spherical cells (around 30-70 μm in diameter), filled almost entirely by one single fat droplet (TAG) which makes up for almost 65% of the cell’s total volume. The nucleus and the few mitochondria are pushed against the cell’s membrane, in the little space that is left (Nelson et al., 2008). WAT depots are generally around the gonads, kidneys and subcutaneous and visceral regions (Qian, Huang & Tang, 2015). Its adipocytes are very active metabolically and respond very quickly to hormone stimuli, working in tandem with the liver, skeletal muscle and heart, but also have a connection with the central nervous system, as discussed in section 1.6 (Nelson et al., 2008; Qian, Huang & Tang, 2015).
Adipocytes also have a central role in the production of adipokines, as a response to the presence of other hormones. These include: leptin, a hormone connected with the
regulation of appetite and with other physiological functions, including in breathing (Bassi et al., 2016) and whose production was first discovered in the adipose tissue (for a review see: (Friedman & Halaas, 1998)); adiponectin, also known as adipocyte complement-related protein of 30 kDa, a versatile hormone that plays roles in energy metabolism, but also has anti-inflammatory and even anti-carcinogenic properties (for a review see (Nigro et al., 2014)); and several mediators of inflammation as tumor necrosis factor (TNF)-α, interleukin (IL)-6, among other cytokines, and growth factors which act both systemically and locally, in tissues like the liver, muscles and brain and contribute to the maladaptive effects of obesity (for several reviews see: (Goossens, 2008; Qian, Huang & Tang, 2015; Trayhurn & Beattie, 2001)). It has also been demonstrated that adipose tissue has a close relationship with capillary networks. When the adipose tissue mass starts to expand, there is a need of oxygenation to the tissue and therefore there is a need to expand the capillary net. This is done in the presence of pro-angiogenic factors, which allow explants of subcutaneous tissue to form new blood vessels. Furthermore, a recent study by Min et al. from 2016 showed these vessels were able to differentiate into white adipocytes, first, in the presence of adipogenic factors, and then brown adipocytes, in the presence of browning factors (Min et al., 2016). All this comes to show the untapped potential behind adipose tissue and its versatility.
1.4.2. Brown adipose tissue and UCP1
BAT, unlike WAT, shows a high mitochondrial content and several fat droplets scattered through the cell. This tissue arises as having a huge potential due to its ability to generate energy, which is dissipated in the form of heat. This energy has its origin in the uncoupling of the cellular respiration, which happens in the adipocytes’ mitochondria’s membranes.
The phenomenon of non-shivering thermogenesis occurs in BAT under basal conditions as the result of the expression of the mitochondrial protein UCP1 in the inner membrane of the mitochondria. This transmembrane protein acts as a proton channel, which, upon activation, uncouples the proton gradient generated during cellular respiration, releasing the chemical energy of this process in the form of heat. In the presence of cold, BAT can be stimulated by the sympathetic nervous system (SNS) and its transmitter, norepinephrine, activating the β3-adrenergic receptors at the cell’s surface, activating lipolysis and mobilizing the fatty acids, which will be metabolized
during cellular respiration. The proton gradient, just like before, will be uncoupled and heat will be produced, through the presence of UCP1 (Almind et al., 2007; Betz & Enerbäck, 2015; Lowell & Spiegelman, 2000).
BAT was found in a lesser extent in humans in comparison with other mammals, like rats, for example, which have a larger depot of this tissue in the interscapular region. Also, in humans, it has been found that UCP1-expressing tissue was inversely correlated with age and the increase in body weight (Harms & Seale, 2013). Aside from its evident role in the response to low temperatures by the increase in thermogenesis, BAT also plays an important part in the counteracting of infections during fever states, in the transition into wakefulness from hibernating mammals and also postnatally, to ensure the newly born can survive more easily the sudden differences in temperature (Betz & Enerbäck, 2015; Cannon & Nedergaard, 2004; Morrison & Madden, 2011).
1.4.3. Beige adipocytes
Curiously, under the effect of certain physical (for example, low temperatures) or chemical (adenylate cyclase activators, like forskolin or isoproterenol) stimuli, some WAT adipocytes can change their phenotype, giving rise to the so-called beige or brite (brown in white) cells. This change can be detected through the induction of the expression of genes commonly found in BAT, like ucp1, but also tmem26 (cell surface marker for beige precursors) and the gene pgc1α (which stimulates mitochondrial biogenesis and the oxidative metabolism), for example (Betz & Enerbäck, 2015; Harms & Seale, 2013).
The factors involved in the formation of new beige adipocytes is not completely clear, although there are four theories that could explain its appearance in WAT depots. Either: they are derived from brown adipocyte precursors within WAT depots; or they appear as the result of the differentiation of an existing WAT adipocyte precursor; or they transdifferentiate from already mature WAT adipocyte into beige adipocytes; or they are derived from white adipocyte precursors expressing myf5, a smooth muscle cell marker (Stanford, Middelbeek & Goodyear, 2015).
It has been suggested that the induced formation of beige adipocytes from WAT could be used as a possible therapy to counter obesity. This could be achieved using drugs like rosiglitazone, a PPARγ agonist, that induce browning of the WAT adipocytes and lead to an improvement of the metabolic profile. Additionally, the induced
expression of hormones like irisin (an exercise-induced myokine that reverses diet-induced obesity and diabetes by stimulating BAT and beige’s thermogenic activity) and fibroblast growth factor (FGF) 21 (a recently found adipokine that indicates non-shivering thermogenesis in humans) have been shown to be beneficial by stimulating BAT and beige activity. Furthermore, exercise is also believed to be a good therapeutic alternative to the use of drugs to promote beiging, not only because it increases the expression of irisin, but also because of its commonly known effects as a browning factor (Lee et al., 2014; Nakhuda et al., 2016).
In mice and rats, the browning of WAT as a result of exercise has been confirmed by several authors (Lee et al., 2014; Stanford, Middelbeek & Goodyear, 2015), however, in humans there seems to be some controversy. A study by Nakhuda et al in 2016 in overweight and obese women submitted to a 16-week exercise program with modest calorie restriction showed an improvement in the metabolic profile and overall fitness, with fat mass loss, but did not show any increase in brown adipose tissue gene markers. In fact, in the subcutaneous region, it was observed a greater weight-loss that was associated with a lower expression of UCP1 and other brown molecular markers (Nakhuda et al., 2016). All together this indicates that a suitable animal model that correctly resembles the human physiology is critical to understand the mechanisms underlying browning and the associated weight-loss due to exercise.
1.5. Leptin and its receptor, Ob-R
Although there is clear evidence in which states the SNS plays the most important role in controlling energy balance, for many years there was a clear lack of explanation for how energy balance was controlled, monitored and kept (Baak, van, 2001). That was until the discovery of leptin by Friedman et al. in 1994 (Zhang et al., 1994). Leptin was first discovered by the positional cloning of its gene, the obese (ob) gene, on the mouse and the consequences of its mutations were soon identified to be in the genesis of the development of morbid obesity and type II diabetes (Friedman & Halaas, 1998; Zhang
et al., 1994). Later, the discovery of its receptor’s gene, the diabetic (db) gene, shed
even more light on the great importance of this hormone and its activity.
Leptin is expressed mainly in adipocytes and its expression correlates positively with the amount of adipose mass in the body. When leptin was discovered, it was first thought to be part of a negative-feedback loop to control the increase of adipose tissue
mass, relaying the information to the central nervous system, namely the hypothalamus (Friedman & Halaas, 1998). It works as ghrelin and neuropeptide Y (NPY)’s counterpart since it suppresses appetite and consequently energy intake, although this control of energy intake is a long-term effect and not an immediate effect of a meal. In spite of playing a clear role in energy balance and feeding behavior, leptin also has different functions on other physiological systems, like the immune system, for example, but also on the normal occurrence of puberty and even in bone formation (Friedman & Halaas, 1998; Takeda et al., 2002). Leptin acts by binding to its receptor, the leptin receptor (Ob-R) on target cells, a member of the cytokine family of receptors. This receptor can have different isoforms and the one which allows the correct action of leptin is the Ob-Rb isoform, normally present in the hypothalamus but also other cell types. The activity of leptin on these hypothalamic receptors was further confirmed by the finding that intracerebroventricular injections of leptin greatly reduced food intake (Friedman & Halaas, 1998). The central effect of leptin on food intake was confirmed since the same dose had to be increased many times peripherally to achieve similar results, suggesting the hormone’s ability to cross the blood brain barrier (Friedman & Halaas, 1998).
The lack of leptin (ob/ob genotype in mice; fa/fa in rats; both are autosomal recessive single point mutations) in the organism or its abnormal function (mutation on the receptor, db/db genotype), or the occurrence of the two simultaneously, can lead to different pathologies that range from severe obesity to a combination of diabetes and obesity (Coleman, 1978). Parabiotic experiments in mice have further demonstrated the importance of discerning the different phenotypes. The pairing of one mouse which is normal and another displaying a db/db phenotype, (with established obesity and diabetes caused by the lack of functional leptin receptors) will eventually lead to the normal mouse’s death through starvation, due to the hyperleptinemic nature of the plasma of the mutant strain. On the other hand, the ob/ob mouse, which does not express leptin, when paired with a normal mouse can show improvements in the diseased mouse’s insulin resistance and general obesity, thanks to the production of leptin by its peer (Coleman, 1978).
The Zucker Diabetic Fatty (ZDF) rat (Figure 6) was first found by Zucker and Zucker in 1961 when littermates started showing significant differences in shape and size, comparing to their normal counterparts, the symbol fa being chosen for the fat allele and Fa for the normal (Zucker & Zucker, 1961). The main feature of these rats is
the notable hyperphagia, more recently related with the mentioned lack of the action of leptin, which leads to obesity (Hempe et al., 2012). This strain was later established as a genetic model for the study of diabetes, obesity and hypertension a couple of decades ago (Finegood et al., 2001; Hempe et al., 2012; Kurtz, Morris & Pershadsingh, 1989). In these rats, the fa/fa genotype induces the lack of functional leptin receptors, much in the same way of the db/db mice. Therefore, these rats display morbid obesity and hyperphagia. This animal model quickly develops insulin resistance, around six weeks of age. Afterwards, the onset of diabetes follows the already known sequence of events, starting with insulin resistance: hyperglycemia closely followed by hyperinsulinemia; failure of the pancreas’ β-cells; hypoinsulinemia and finally the animal’s inevitable death. Due to all these characteristics, it makes sense the use of this animal model for studying therapies and treatments for obesity, this century’s epidemic. However, it should be mentioned that the phenotype presented by the ZDF rats is only seen rarely in obese humans, like most of the leptin-related deficiencies. These seem to appear with greater frequency (although this frequency is not very elevated) in consanguine populations (Clément et al., 1998).
Figure 6 – The Zucker Diabetic Fatty Rat.
On the picture: left, the lean phenotype (Fa/?); right, the obese phenotype (Fa/Fa).
1.6. The sympathetic nervous system and the carotid body
The SNS is closely related to the regulation of energy balance in the organism, but mainly regulates its output, being influenced by several environmental and genetic
factors. Because of this, it is easy to understand its importance in the regulation of adipose tissue metabolism, both white and brown.
The SNS acts on the adipose tissue through the activation of its two receptors: α-adrenergic (α1 and α2) and β-α-adrenergic (β1, β2 and β3). By acting on these receptors, the SNS will have different effects. Upon stimulation of α2-adrenergic receptors, lipolysis in the adipose tissue is inhibited, while when the β-adrenergic receptors are activated, lipolytic activity is increased (Baak, van, 2001).
Due to this SNS control of adipose tissue metabolism, it is expected dysfunction of adipose metabolism when SNS is altered. In fact, in obesity, where SNS activity is increased there is a substantial decrease in lipolysis, leading to the already mentioned hypertrophy of the adipocytes (Rayner, 2001). Also described is the link between SNS overactivation and insulin resistance in the peripheral tissues, including the skeletal muscle and adipose tissue (Ribeiro et al., 2013). The uncontrolled activation of the SNS leads to an increase in lipolysis and to an increase in arterial blood pressure, leading to a reduction in glucose tolerance and resistance to insulin, as consequences from the increase in glucose and NEFAs in circulation (Conde et al., 2014, 2016; Ribeiro et al., 2013).
The carotid bodies (CBs) are peripheral chemoreceptors constituted mainly by two types of cells: the glomus cells, with chemoreceptor nature (type I) and the supporting glial-like cells (type II) (Kumar & Prabhakar, 2012). Type I cells are defined as being the chemoreceptor unit, and sense changes in the O2, CO2 and pH levels in the arterial blood. During hypoxia, hypercapnia or acidosis, the CBs are activated leading to an increase in the action potential frequency of their sensitive nerve, the carotid sinus nerve (CSN), which is integrated in the brainstem to produce a hyperventilation and to increase SNS activity. Aside from this, the CBs seem to directly activate the adrenal glands (Ribeiro et al., 2013).
It has been previously demonstrated by Ribeiro et al. that the CBs are involved in glucose homeostasis and with peripheral insulin sensitivity. In fact, it was shown that CB dysfunction, observed as CBs overactivity, is associated with the development of insulin resistance and glucose tolerance, since the denervation of the CSN prevented and reversed insulin resistance and hypertension as well as glucose intolerance (Ribeiro
et al., 2013).
BAT, as mentioned before, expresses β3-adrenergic receptors and is innervated both by sympathetic nerve fibers and sensory nerve fibers which makes this tissue, a target
and a mediator of SNS regulation (Almind et al., 2007; Bartness, Vaughan & Song, 2010; Betz & Enerbäck, 2015; Lowell & Spiegelman, 2000). The binding of β3-agonists to its receptors increases energy expenditure through lipolysis and fat oxidation. It is known that SNS is overactivated in obesity and metabolic diseases leading to increased levels of circulating catecholamines, like epinephrine or norepinephrine, which activate these receptors. Therefore, if there is an upset of the energy uptake/energy expenditure balance, like the one found in obesity, it would be expected the SNS interfered with BAT physiology, decreasing BAT activity. BAT can decrease in obesity its activity, through two pathways: one through the down regulation of β3-adrenergic receptors or eventually through the dissipation of the proton motive force rises through the uncoupling of proton pumping and ATP synthase’s activity, disturbing the normal synthesis of ATP and increasing the rate of non-shivering thermogenesis (Lowell & Spiegelman, 2000). In fact, it is known that in ob/ob mice, the SNS output to BAT is greatly reduced. The CB has been suggested to be one of the key triggers in SNS activity driving insulin-resistance, and it was shown that the CSN resection in metabolic syndrome animals normalizes the sympathetic activity (Ribeiro et al., 2013; Sacramento
et al., 2017). Therefore, if SNS controls BAT there would be an expected increase in
BAT mass and function, subsequently leading to fat mass loss and overall weight loss through heat production in CSN-resected animals.
All these findings support the hypothesis that the CBs have a central role in mediating energy expenditure through the SNS’s activity (Figure 7). As such, the link between the CB and the SNS must be investigated further to better understand its mechanism in glucose metabolism and insulin resistance. Additionally, the link between CB, SNS and BAT should be clarified especially in the context of obesity and metabolic disturbances.
Figure 7 - Possible link between the carotid body, the SNS, metabolic diseases and the adipose tissue.
2. Aims
Obesity has been established as the 21st century epidemic, being the most important cause of cardiovascular and metabolic disturbances and contributing to significant morbidity and mortality worldwide. Therefore, the investigation of the pathophysiological mechanisms behind the development of obesity and obesity-related diseases urge in order to find new therapeutic targets to treat this epidemic.
The general aim of this thesis was to investigate the role of the CB in the development of obesity and to evaluate the impact of CSN denervation on obesity and on metabolic dysfunction in a genetic obese animal model, the ZDF rat.
The specific aims of this thesis were:
1 – Evaluate the impact of CSN denervation on weight gain, fat mass, lipid deposition and lipid profile in an early and late stage of obesity and metabolic dysfunction;
2 – Evaluate the impact of CSN denervation on insulin sensitivity, glucose tolerance and insulin and C-peptide levels in an early and late stage of obesity and metabolic dysfunction;
3 – Evaluate the impact of CSN denervation on basal ventilation and on the ventilatory responses to hypoxia and hypercapnia in an early and late stage of obesity and metabolic dysfunction;
4 – Evaluate the impact of CSN denervation on cardiovascular/hemodynamic parameters in an early and late stage of obesity and metabolic dysfunction.
3. Methods
3.1. Animal care and diets
Experiments have been performed using 2 groups of male animals: the ZDF (Fa/Fa) rats, as a model of obesity and metabolic disease and Zucker Lean (Fa/?) rats as controls. Animals were ordered from Charles River Laboratories (Paris, France) with six weeks of age and have been maintained during 2 weeks in quarantine. Upon arrival animals were divided and kept in groups of two (ZDF rats) and three (Lean) rats per cage, and housed in an environmentally controlled space (21±ºC temperature; 55±10% humidity) with 12 h light/dark cycles. ZDF animals have been fed with Purina 5008 (Formulab Diet 5008 and Formulab Diet 5008C33, Purina) and consisted of a mix of 23.6% protein, 14.8% lipid, 50.3% carbohydrates, 3.3% fiber and the remaining minerals and vitamins. The Lean animals fed a control diet (7.4% lipid and 75% carbohydrates, of which 4% were sugars and 17% protein; SDS diet RM1). The total energy provided by the different groups of nutrients was for the ZDF animals 4.36 kcal/g of gross energy, of which 3.56 have physiological fuel value. The Zucker lean’s diet had 3.5 kcal/g of gross energy of which 2.84 have physiological value (the diets’ caloric values were determined from the diet sheets found for the diets on the websites of the respective producing companies).
3.2. Experimental design
To evaluate the role of the CB and the impact of CSN denervation in different stages of disease development, we have divided the groups in 2: an early stage group in which the animals had 10-11 weeks of age when they were submitted to chronic CSN denervation, and a late stage group in which the animals were submitted to a chronic CSN denervation at the 18th week of age. Sham procedures were done to control groups. During all the experimental period, body weight, food and water intake and metabolic parameters, as fasting glucose, insulin sensitivity and glucose tolerance have been monitored. Additionally, respiratory parameters, as respiratory frequency and tidal volume have been evaluated by whole-body plethysmography until the end of the experimental protocol (Figure 8).
After denervation, the animals have been evaluated for metabolic parameters each 1-2 weeks to evaluate the impact of CSN denervation. For the early stage group, the
animals have been monitored during 7 weeks post-resection and for the late stage group animals have been analyzed for 3 weeks post-resection.
Figure 8 - Workflow for this project.
CB image was adapted from Chang J., Andy et al., Nature, 2015.
3.3. Surgical and animal sacrifice procedures
The surgical procedure was done after anesthetizing the animals with a mixture of ketamine (30 mg/kg)/medetomidine (4 mg/kg). Carprofen (5 mg/kg) was administered as an anti-inflammatory immediately before the surgical procedure and for more 3 days following the procedure. After surgery, the animals were sutured and received atipamezole (2 mg/kg), to counter the anesthetic effect. Buprenorphine (10 μg/kg) was administered when animals were already totally awaked.
For the terminal experiment, animals have been anesthetized with sodium pentobarbital (60 mg/kg, i.p.) and the femoral artery was catheterized to measure the arterial blood pressure (systolic (SBP), diastolic (DBP) and mean (MBP) blood pressure and heart rate (HR), using a blood pressure transducer (-50, +300 mmHg) from EMKA Technologies (Paris, France). Also, paO2 was measured using a capnograph (from EMKA Technologies (Paris, France)). Afterwards, a cardiac puncture was performed to collect samples of plasma to EDTA-containing tubes and serum. Tissues as the liver, soleus and gastrocnemius, diaphragm, visceral, perinephric, epidydimal, subcutaneous
and brown adipose tissues (collected from the interscapular region), brain and hypothalamus samples were then rapidly collected and stored at -80 ºC, for further analysis by Western Blot and other techniques described further down below (Ribeiro et
al., 2013). Animal care followed the European Union Directive for Protection of
Vertebrates Used for Experimental and Other Scientific Ends (2010/63/EU). Protocols were approved by the ethics committee of the Faculty of Medical Sciences (Ribeiro et
al., 2013).
3.4. Evaluation of the insulin sensitivity
The insulin sensitivity was determined through an insulin tolerance test (ITT). For that, the animals were submitted to 16 h fasting with free access to water in the previous night. After the fasting period and immediately in the morning, the basal plasma glycemia levels were measured and a bolus of insulin (0.1 U/kg) was administrated in the tail vein (Monzillo & Hamdy, 2003; Sacramento et al., 2015). The plasma glycemia levels were then measured every minute during 15 minutes. The blood was collected by tail tipping and evaluated using a glucose meter (Precision Xtra Meter, Abbot Diabetes Care, Portugal) and test strips (Abbot Diabetes Care, Portugal). The constant rate for glucose disappearance (KITT) was used to evaluate the insulin sensitivity, and when the KITT is >3.5 means that the animals are insulin sensitive and when the KITT is <3.5 the animals are insensitive to insulin action. The constant is obtained from the equation:
Glucose half-time was measured from the slope of the curve during the linear phase of disappearance of glucose (Monzillo & Hamdy, 2003; Sacramento et al., 2015). These tests were performed to evaluate the animals’ insulin sensitivity before the surgical procedure and on the 1st, 2nd, 3rd, 5th and 7th week after surgery, in the early stage animals, and before, 1st, 2nd and 3rd weeks on the late stage animals.
3.5. Evaluation of the glucose tolerance
Glucose tolerance was evaluated through an oral glucose tolerance test (OGTT). This test was performed to determine the glucose tolerance and subsequently the speed of release of insulin and its action in the peripheral tissues, after an overnight fast. It
consists in the administration of a glucose solution (2 g/kg) by gavage to fasting animals and in the measurement of blood glucose levels by tail tipping before, 15, 30, 60, 120 and 180 minutes after the gavage (Kinzig, Honors & Hargrave, 2010). The glucose tolerance was evaluated as the area under the curve (AUC) of the glucose excursion curves.
At the end of the OGTT, blood serum samples were collected from a small cut made on the tail vein, for biomarker evaluation (Torres‐Villalobos et al., 2016). OGTTs have been done at the same time points as the ITTs.
3.6. Recording of basal ventilation and ventilatory responses to hypoxia and hypercapnia through whole-body plethysmography
Every two weeks, ventilation was measured in conscious freely moving rats by whole-body plethysmography for the determination of ventilation parameters (respiratory frequency, Rf, in breaths per minute; tidal volume (VT), in milliliters). From the product of these parameters, the minute ventilation of the animals was obtained (VE, in milliliters per minute per kilogram) (Hernandez et al., 2012). The system (EMKA Technologies, Paris, France) consisted of 5-litre methacrylate chambers continuously fluxed (2 l/min) with gases.
Each rat was placed in the plethysmography chamber and allowed to breathe room air for 30 min to allow adaptation to chamber environment and to acquire a standard resting behavior. After acclimatization period the protocol consisted in 10 minutes of normoxia (21% O2), followed by 10 minutes of hypoxia (10% O2), 10 minutes of normoxia, followed by 10 minutes of hypercapnia (5% CO2) and finally 10 minutes of normoxia. The gases used were balanced by N2. Rf and VT levels obtained when animals where moving where excluded. Each plethysmography chamber was calibrated by the injection of a volume of 20 ml of air with a syringe into each of the chambers (Conde et al., 2012). The software used for the visualization and analysis of the data was IOX 2.9.5.73 from EMKA Technologies, Paris, France.
3.7. ELISA kits for the quantification of insulin and C-peptide in blood serum samples.
Commercial ELISA kits were used for the determination of insulin (Mercodia Ultrasensitive Rat Insulin ELISA, Uppsala, Sweden) and peptide (Mercodia Rat
C-peptide ELISA, Uppsala, Sweden) in serum blood samples. The protocol used was that described on the pamphlet found inside the kit.
3.8. Quantification of the lipid content in the liver
A protocol modified from the protocol described by Elena Olea Fraile (Fraile, 2015) was used for the determination of the amount of lipids in the liver. This protocol consisted in the homogenization of a small amount of tissue using Folch’s reagent (chloroform: methanol, 2:1) (Folch, Lees & Stanley, 1957). For pulverizing the tissue, it was used a Bessman tissue pulverizer of medium size from Spectrum Laboratories, with liquid nitrogen. After the homogenization, the tissues were collected to glass tubes and were submitted to agitation during 2 hours, using an automatic tube shaker. After agitation, the solution was filtered with filter paper into another glass tube. In the new glass tube, another 2.5 ml of Folch’s reagent were added to the remaining tissue. The agitation and filtration, followed by new addition of the Folch reagent were repeated twice. After the third and final filtration, it was added a NaCl 0.73% solution, after which it was stirred vigorously and left to rest overnight. In the ensuing day, the two resulting phases were separated and the organic (upper) phase was collected in a Petri dish previously weighted. To the phase remaining in the tube it was added a solution of Folch’s reagent: NaCl 0.53% (80:20). This new mix was stirred again and left resting for another 2 hours. As earlier, the organic phase resulting from this last mix with the Folch’s reagent was separated from the aqueous phase and added to the Petri dishes. After the complete drying of the dishes, they were weighted again and the percentage of lipids in the tissue was determined, according to the initial weight used in the experiment (Fraile, 2015).
3.9. Data Analysis
Data was evaluated in a Graph Pad Prism Software version 6 (GraphPad Software Inc., San Diego, CA, USA) and shown as the mean values with their standard errors (Mean ± SEM). The significance of the differences between the mean values was calculated by one- and two-way ANOVA with Bonferroni multiple comparison tests. Differences were considered statistically significant at P<0,05 (Kobayashi e Pillai, 2013). The group considered as control in all tests and evaluations was the lean sham group.
4. Results
4.1. Caloric and liquid intake is not affected by the CSN resection nor the surgery
Animals were randomly allocated to CSN resection or sham surgery groups, in which the animals have been submitted to the same surgical procedure but the CSN was left intact. CSN bilateral resection or sham procedure did not modify significantly animal behavior nor caloric intake, measured as the average caloric intake per day during the 7 weeks after CSN denervation, on the early stage animals, and 3 weeks after the CSN denervation, on the late stage animals. Liquid intake was also measured as the average liquid intake per day, for the same periods.
Between the Fa/Fa and lean animals, a big difference is visible both in the caloric and liquid intakes, even before submitting the animals to the surgical procedure. This happened both in the early and late stage groups. The intakes measured for the two different animal groups were significantly different being 41% and 38% higher, for the caloric and liquid intake, respectively, in the early stage group (Table 1); and 71% and 111% higher, for the caloric and liquid intake, respectively, in the late stage group (Table 2).
Also between the Fa/Fa groups before the surgery of the early stage we found there was a significant difference of 34% in the liquid intake. This difference was dissipated after the surgery.
The liquid intake measured for the Fa/Fa animals in the early stage group did not change significantly after the surgery, when comparing to the lean animals, remaining at a 41% higher value. The caloric intake, on the other hand went down to a value 25% higher (Table 1).
The late stage group showed the biggest changes when comparing lean and Fa/Fa animals after the surgery, decreasing the differences to 54% and 75%, respectively for the caloric and liquid intakes (Table 2).
Between the sham and denervated animals, both in the early and late stage groups, no significant differences were found, when comparing the values for the caloric and liquid intakes. (Tables 1 and 2)
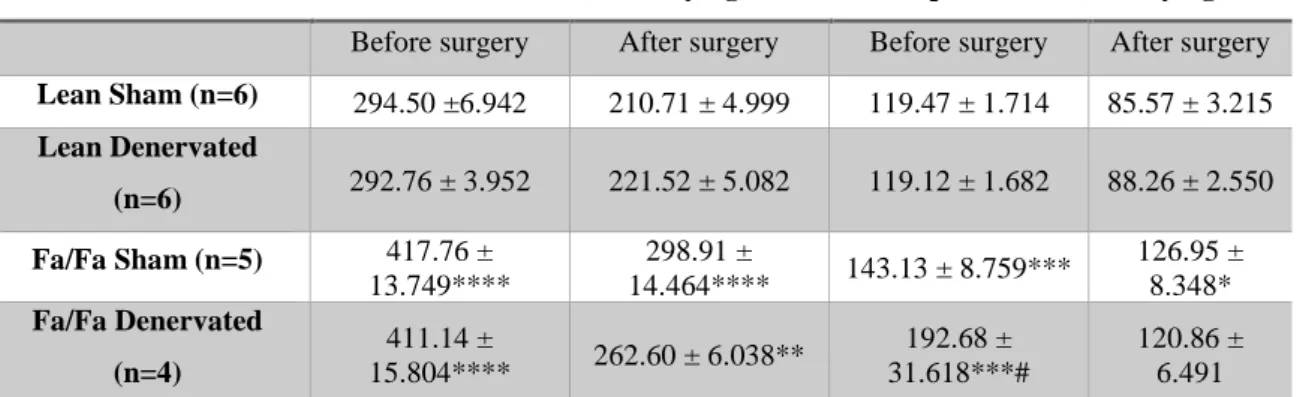
Table 1 - Early stage caloric and liquid intake, before and after surgery.
Caloric Intake (kcal/day/kg) Liquid Intake (ml/day/kg) Before surgery After surgery Before surgery After surgery Lean Sham (n=6) 294.50 ±6.942 210.71 ± 4.999 119.47 ± 1.714 85.57 ± 3.215 Lean Denervated (n=6) 292.76 ± 3.952 221.52 ± 5.082 119.12 ± 1.682 88.26 ± 2.550 Fa/Fa Sham (n=5) 417.76 ± 13.749**** 298.91 ± 14.464**** 143.13 ± 8.759*** 126.95 ± 8.348* Fa/Fa Denervated (n=4) 411.14 ± 15.804**** 262.60 ± 6.038** 192.68 ± 31.618***# 120.86 ± 6.491 Values are displayed as the means of all the animals’ caloric and liquid intake values with their SEM values. *P<0.05; **P<0.01; ***P<0.001; ****P<0.0001 vs lean sham; #P<0.05 vs Fa/Fa sham (Two-way ANOVA Bonferroni test).
Table 2– Late stage caloric and liquid intake. before and after surgery.
Caloric Intake (kcal/day/kg) Liquid Intake (ml/day/kg) Before surgery After surgery Before surgery After surgery
Lean Sham (n=1) 193.26 184.15 80.14 79.25
Lean Denervated (n=1) 193.26 178.26 80.14 107.30 Fa/Fa Sham (n=2) 329.71 ± 17.020 259.95 ± 38.269 154.72 ± 27.418 163.53 ± 63.433 Fa/Fa Denervated (n=3) 332.50 ± 10.215 293.65 ± 2.457 178.858 ± 28.863 163.45 ± 11.679 Values are displayed as the means of all the animals’ caloric and liquid intake with their SEM values.
4.1.1. Effect of Fa/Fa phenotype and of CSN resection on weight gain
As previously described in section 3.2, the early stage group has been submitted to denervation between weeks 10 and 11. The growth rates were determined from the weekly increase in weight, before and after the surgery, in g per week (Table 3).
Figure 9 shows a steady growth in both lean and Fa/Fa animals, although the Fa/Fa rats quickly outgrow their lean counterparts, which grow at a less visible rate, increasing the difference from 37% in the first week (Lean = 140.7 ± 4.55 g; Fa/Fa = 179.8 ± 6,31 g) to 49% in the last weeks, even after the denervation (Lean = 328.7 ± 6.63 g; Fa/Fa = 487.1 ± 9.06 g).
As of the day of the surgery, the lean denervated group’s average weight drops slightly and this difference carries out for the remainder of the experiment. This difference reaches 11.7% on the first week and 11.6% on the second week after surgery and is significantly different on the 1st, 2nd, 3rd and 5th weeks following surgery (Lean sham 1 week after surgery = 244.0 ± 9.31 g; Lean sham 2 weeks after surgery = 258.0 ±
10.42 g; Lean denervated 1 week after surgery = 215.3 ± 5.77 g; Lean denervated 2 weeks after surgery = 228.0 ± 6.15 g).
The Fa/Fa animals don’t show a very clear difference between the two groups, not reaching more than 5% on the 2nd week after the surgery (Fa/Fa sham = 364.4 ± 8.13 g; Fa/Fa denervated = 343.5 ± 9.60 g). The growth rate of all animals determined after the surgeries displays a considerable drop, comparing to those before the surgeries. This change, however, is not significant.
Figure 9 – Early stage animal growth curves.
Near the 10th week of diet. some of the animals were selected on both groups for the CSN resection, forming the denervated groups. This point is highlighted by the black arrow. ***P<0.001; ****P<0.0001 vs lean sham group (Two-way ANOVA Bonferroni test).
Table 3 – Growth rates for the early stage animals.
Before Surgery (g/week) After Surgery (g/week) Lean Sham (n=6) 24.20 ± 5.353 12.96 ±1.568 Lean Denervated (n=6) 22.83 ± 7.813 10.46 ± 4.705 Fa/Fa Sham (n=5) 38.60 ± 9.444 20.05 ± 4.838 Fa/Fa Denervated (n=4) 37.63 ± 7.49 18.44 ± 3.402
The growth rate was assessed by calculating the amount of weight gained by the different animals, per week. Data is shown as the mean and SEM.
The late stage group was maintained in the same conditions as the early stage group. but for a longer period. Between the 18th and 19th week of diet, the animals were