On-Line Determination of Biomass in a Microalga Bioreactor Using
a Novel Computerized Flow Injection Analysis System
Luı´s A. Meireles,
†Jose´ L. Azevedo,
‡Joa
˜ o P. Cunha,
‡and F. Xavier Malcata*
,†Escola Superior de Biotecnologia, Universidade Cato´lica Portuguesa, Rua Dr. Anto´nio Bernardino de Almeida, P-4200-072 Porto, Portugal, and Departamento de Electro´nica e Telecomunicac¸o˜es-IEETA,
Universidade de Aveiro, P-3810-193 Aveiro, Portugal
A flow injection analysis (FIA) device has been developed, which is able to assay successfully for biomass in a microalga bioreactor. The device is fully computerized and is operated via diluting small aliquots of the culture followed by measuring optical density (OD); this figure is then accurately correlated with biomass, in terms of both cell number and ash-free dry weight, during the entire culture time. Furthermore, the device is not expensive, is highly versatile, and is easy to operate owing to specifically developed, user-friendly software. The growth rate and biomass productivity of Pavlova lutheri, cultivated under batch and semicontinuous modes, were monitored as experimental testing model.
Introduction
Microalgae have been widely used to feed larval fish, crustaceans, and molluscs in mariculture hatcheries (1). Nowadays, they are also cultivated for production of such high value products as β-carotene, phycobiliproteins, exopolysaccharides, and ω3-polyunsaturated fatty acids (PUFA) (2) and are in the growing international demand market for healthy products obtained via natural paths. Pavlova lutheri is one such microalga, belonging to the Prymnesiophyceae class, which is able to produce large amounts of PUFA and constitutes a high quality feed for aquaculture (3).
Until recently, bulk cultivation of microalgae was mainly performed in open ponds or raceways, as well as controlled aseptic systems of reasonably large scale (4), which are easy to operate and do not require complex control or monitoring systems; the history of such studies can be traced back to the seminal text by Burlew in the 1950s (5). However, all such reactors present a major drawback: their biomass productivity is rather low. Hence, the past decade’s research was focused on devel-opment of new reactor designs and processing techniques in attempts to overcome that drawback. Several success-ful batch bioreactor configurations have consequently been developed, which are characterized by higher bio-mass productivities but also by higher operation costs; hence, strategies for cost reduction are urged, via taking advantage of automatic control and monitoring systems (6).
Biomass is a basic parameter in bioreactor operation that is often used as an indirect measure of product formation, substrate consumption, and process distur-bances (7). However, traditional direct determinations thereof by counting cell number under the microscope or determining cell dry weight are both tedious and time-consuming. Common systems aimed at biomass monitor-ing are based on sensors of dissolved oxygen or sensors
of biomass (8). Both present disadvantages for long-term operation, arising from the fact that their electrodes and sensors are quite sensitive and easily damaged; in addition, correlation between dissolved oxygen and bio-mass concentration involves complex calculations (8). Finally, biosensors cannot be sterilized, which hampers in situ applications (9).
The use of optical density (OD) as a turbidimetric measure of biomass is the most usual method of nonin-vasive biomass estimation. Systems able to continuously measure OD in the bioreactor medium are not difficult to build, but they present two major disadvantages: OD does not correlate linearly with biomass in the whole growth range, and increasing cell densities lead to fouling by dead microorganisms, which affects the detector response and hence does not allow a measure of viable biomass as intended. Therefore, OD is restricted to off-line assays, in which the detector cell can be duly cleaned, and dilutions can be performed whenever the target value is outside the linear zone. Systems that use OD to automatically calculate biomass, thus avoiding said shortcomings, would thus prove useful tools in biomass monitoring and control.
From the several systems available to date for biore-actor control, flow injection analysis (FIA) deserves special attention owing to its versatility, simplicity, low cost, and extremely good reproducibility (10, 11). FIA allows one to perform automatic dilutions; in addition, the carrier fluid stream cleans the detector cell perma-nently because of its high linear velocities. For these reasons, systems of this type have already been applied for monitoring yeast and bacterium biomass, using spectrophotometric and/or fluorimetric detectors, in fer-mentation processes (12). Furthermore, FIA systems are extremely versatile: once they are implemented to control one parameter, they can easily be adapted to control others. Finally, they can determine several pa-rameters at once, a feature that has been taken advan-tage of in bacterium and yeast cultures (13-15) but not yet in microalga cultures.
Here we describe and discuss a simple system for biomass monitoring, tested on a 2-L bioreactor, operated * To whom correspondence should be addressed.
†Universidade Cato´lica Portuguesa. ‡Universidade de Aveiro.
under batch and semicontinuous modes for cultivation of P. lutheri, based on FIA coupled with spectrophoto-metric detection. This system is entirely computer-controlled, and is operated by user-friendly MS Windows software that permits control of all system parameters and stores the results in MS-Excel format for a posteriori handling. It is highly versatile and reproducible; owing to its low cost, it can be a useful tool for both laboratory and industrial cultivation procedures involving microal-gae.
Material and Methods
Culture Conditions. The test microalga P. lutheri
was obtained from IPIMAR (Instituto Portugueˆs de Investigac¸a˜o MARı´tima, Portugal). The cultivation me-dium was artificial seawater (ASW, 16), and 1.5-L cultures were performed in a 2-L glass bioreactor (Braun, Germany) operated in batch and semicontinuous modes and controlled by a Biostat B unit (Braun). The renewal rate in semicontinuous cultures was ca. 30% per day. Temperature was maintained at 20 ( 0.5 °C, and pH was kept at 8.0 by addition of 1 M HCl or NaOH as appropri-ate. Cultures were stirred at 50 rpm, and air enriched with 0.3% (v/v) CO2 was continuously bubbled at the bottom, at a flow rate of 0.54 L‚Lculture-1‚min-1. Light was provided by eight cool, white light fluorescent lamps OSRAM 18W/21-840, for a total irradiation of ca. 100 µE‚m-2‚s-1.
System Design. The FIA device developed comprises
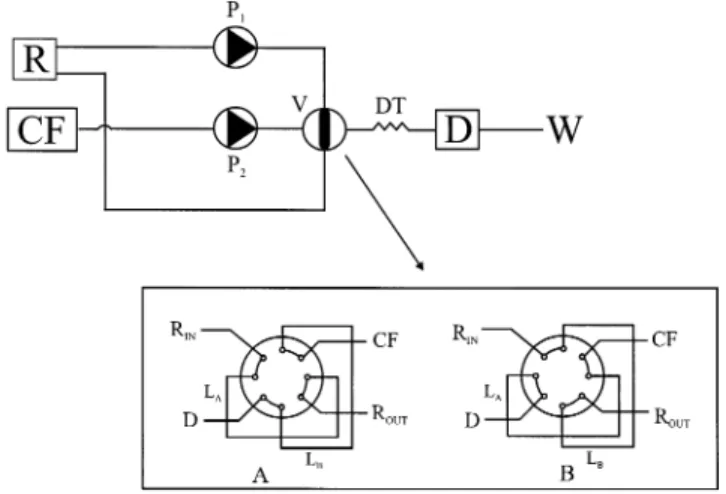
a C22 two-position/eight-channel valve (VICI, USA) with two sample loops, each providing a different dilution of the culture medium. The injection valve was computer-controlled via a two-position microelectric actuator in-terface (VICI), connected through an RS232 serial port. The culture was continuously recirculated from the reactor through the valve with a peristaltic pump Minipuls 3 (Gilson, France) at a flow rate of 3.6 mL‚min-1. The carrier fluid was driven by an MCP peristaltic pump (Ismatec, Germany), at a flow rate of 22.0 mL‚min-1; it consisted of sterilized deionized water, which flowed from the reservoir through the opposite loop of the culture and then to the detector. The aforementioned peristaltic pump, computer-controlled via an RS232 serial port, was operated only when necessary, thus avoiding waste of pretreated water. The detector was an UV-vis spectro-photometer model 1201 (Shimadzu, Japan), equipped with a flow cell 175.000 OS (Hellma, Germany). The switching of the detector was also computer-controlled via an RS232 serial port. The wavelength was set to 550 nm, because absorption of cellular pigments at this wavelength is at a minimum. Table 1 summarizes the key hardware components of the system, as well as the parameters controlled by each one. All tubing was Norprene 3.2 mm i.d. (Ismatec), except the loops and the connection between the injection valve and the detector (dilution tube) which were made of 1.5 mm i.d./3.2 mm o.d. Teflon tube (Omnifit, UK).
Figure 1 shows an overall diagram of the system. Whenever a sampling order is given, either by the computer or manually by an operator, the system checks if all hardware is responding appropriately, automatically
sets the detector wavelength and the pump speed to the correct values, and sets the valve to position A. Then, an initial cleaning step (for 10 s) is performed by pumping the carrier fluid through the tubing to the detector, which is then automatically set to zero. At that moment, the plug of culture medium filling loop A is injected in the carrier stream, by changing the valve to position B, and the detector response is recorded for 30 s. Meanwhile, the sample is circulated through loop B and the carrier through loop A. After this recording period, the valve returns to its original position (position A), and the plug of culture medium filling loop B is then injected in the carrier stream and driven to the detector. A second 30-s recording period then takes place. The system performs a final cleaning step for 10 s. The complete cycle described above was executed for each replicate.
In the overall process, the reactor volume remains unchanged: although there are two culture plugs injected in the carrier stream, the carrier plug filling the opposite loop of the culture is injected in the culture stream at the same time, so the culture wasted is replaced by sterilized deionized water.
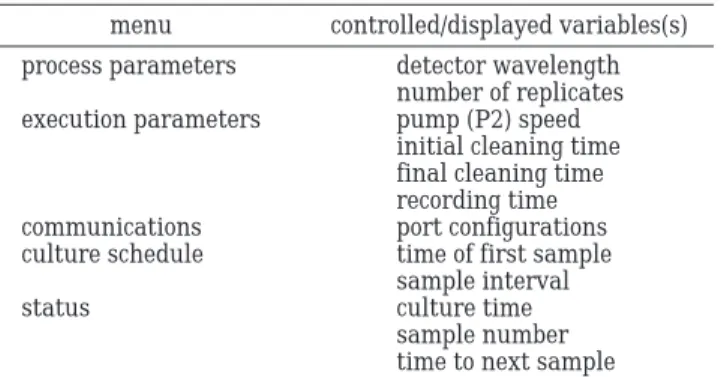
The software was developed in Visual Studio v6.0 and allows definition of all controllable hardware parameters (see Table 1), as well as sampling schedule and various menus; the parameters defined in such menus are presented in Table 2. Execution parameters, such as initial and final cleaning times, recording time, and number of replicates, are thus easily defined via the software. The status menu allows one to access the sampling schedule; when taking a sample, it also displays information about each step. The results from the record-ing periods are stored in Microsoft Excel format: one file stores all data recorded, and another file automatically processes data for later use in the calculations, including the maximum OD value of each period and the average of replicates (if there are any). If an error occurs, the software detects its source and accordingly displays a window message.
To calculate biomass concentration, the detector re-sponse was calibrated with both cell number and ash-free dry weight (AFDW). Loop and dilution tube length, as well as carrier flow rate, were optimized so as to provide the best combination of dilutions for this type of culture, covering the whole growth range within the
Table 1. Hardware Components of the System and Variables Controlled Thereby.
hardware component controlled variable(s) peristaltic pump (carrier fluid) pump speed; start/stop spectrophotometric detector wavelength; auto zero;
measuring time eight-channel injection valve position A or B
Figure 1. Schematic diagram of the system: A and B, valve
injection positions; CF, carrier reservoir; D, detector; DT, dilution tube; LA, loop A; LB, loop B; P1, peristaltic pump for
culture recirculation; P2, peristaltic pump for carrier circulation
(computer controlled); R, reactor; RIN, culture medium stream
from the reactor to the valve; ROUT, culture medium stream from
linear correlation zone. Loop A, with a length of 16 cm, accounts for a hold-up volume of 0.4 mL with a dilution factor of 1.88, whereas loop B, with a length of 66 cm, accounts for a hold-up volume of 1.7 mL with a dilution factor of 4.56. The dilution tube was 56 cm long.
The system was sterilized by filling the tubes with 95% (v/v) aqueous ethanol overnight and then washing with 2 L of sterilized deionized water. Connections with the reactor were made aseptically.
Analytical Assays. Cell number determinations were
performed using a Neubauer Improved EM Techcolor (Hirchmann, Germany) hemocytometer. AFDW was de-termined by filtering 10 mL of culture through precon-ditioned GF/C glass fiber filters (Whatman, UK), drying at 100 °C to constant weight, and finally heating to 550 °C for 1 h.
Statistical Analysis. To assess tentative differences
in growth rate and productivity between batch and semicontinuous cultures, and between controlled and uncontrolled semicontinuous cultures, four replicates were performed, and their results were statistically analyzed. For that purpose, a Fisher’s F-test was first used when searching for possible differences in the variances of both growth rate and productivity between cultures. All those variances proved to be statistically similar (P < 0.01); hence, a Student’s t-test assuming equal variances was performed, so as to pinpoint tenta-tive differences in the average of both growth rate and productivity between cultures.
Results and Discussion
The UV-vis spectra of the culture, depicted in Figure 2, demonstrate clearly that the spectrophotometric be-havior of P. lutheri remains unchanged throughout the whole growth range, with minimum absorption by cel-lular components between 550 and 600 nm. Hence, the measure taken at 550 nm is a typical turbidimetry datum, at which the cells disperse rather than absorb the incident light.
The typical response of the system for three samples, collected at three different growth stages (with three replicates each), is presented in Figure 3; the reproduc-ibility of the system is always very high, showing negligible differences between replicates. The software formats the data automatically so as to produce those graphics; they are aimed at facilitating analysis of the results (note that the peaks corresponding to loop A and to loop B would actually be intercalated).
Typical calibration curves for both cell number and AFDW are displayed in Figure 4. There are two calibra-tion curves for each parameter, corresponding to the two operating loops. It is apparent that these curves possess distinct linear zones, which clearly overlap each other; consequently, there is always a linear zone where the
detector signal can accurately and easily be correlated with biomass. The system can thus perform accurate determinations of biomass concentration, irrespective of the growth stage of the culture. All calibrations presented good correlation coefficients, with similar slopes that provide similar sensitivity and accuracy. The choice of the calibration for use in the calculations, i.e., from loop A or from loop B, was then based on the location of the
Table 2. Software Options of the System and Variables Controlled or Displayed Thereby.
menu controlled/displayed variables(s) process parameters detector wavelength
number of replicates execution parameters pump (P2) speed
initial cleaning time final cleaning time recording time communications port configurations culture schedule time of first sample
sample interval
status culture time
sample number time to next sample
Figure 2. Absorption spectra of the culture throughout a whole
batch, in terms of optical density (OD), at daily intervals.
Figure 3. Typical detector response of optical density (OD) for
samples taken at three different stages, with three replicates each: A, using loop A; B, using loop B.
Figure 4. Calibration curves of the two loops for cell number
(A) and AFDW (B) versus optical density (OD): O, loop A; 0, loop B.
value within each linear zone. Analysis of the results from several cultures led to the conclusion that loop A (lower dilution) should be preferred when the OD mea-sured with this loop is lower than 0.8, whereas loop B should be used when the OD of loop A is above that threshold. In fact, the linear zone obtained with loop A (i.e., lower dilution) is between 0.2 and 1.0; the consid-eration of values below 0.8 gives a 25% security range, hence ensuring that the result will not inadvertently lie out of the linear zone. On the other hand, when the OD with loop A is above 0.8, the OD with loop B is already within the linear zone of the calibration curve for this loop.
Any culture can in principle be used for calibration purposes, as long as a few off-line measurements are taken to back up the correlation. Therefore, at the end of each culture a set of new calibration curves can be produced for use in subsequent cultures.
In Figure 5 the results of on-line measurements of biomass, taken at 4-h intervals, are compared with those using standard (off-line) methods, throughout a whole batch. The results from batch and semicontinuous cul-tures are depicted in Figure 6. To determine whether the control system has any effect on the cultures themselves, replicated (n ) 4) semicontinuous stages were performed; the growth rate and productivity of each one were compared with as many controls (cultivated without the control system). The aforementioned growth parameters were also compared with batch culture counterparts; both sets of results are presented in Table 3.
No significant differences (P < 0.05) in growth rate and productivity were found between semicontinuous cultures without or with the control system, and between batch and semicontinuous cultures in terms of growth rate. The productivity was significantly higher (P < 0.05) in semicontinuous cultures, probably because batch cultures start up with smaller inocula and experience a lag phase. In the time frame of our experiments, no contaminat-ing spores (or vegetative cells, for that matter) remained viable; however, if in trouble, a mixture of ethanol and 30% (v/v) of 1 M hydrochloric acid will be more effective as sterilant and also feasible from a technical standpoint. Recall that the flow rate of the culture recirculation is quite low, ca. 3.6 mL‚min-1, which leads to a small linear velocity, ca. 3.4 cm‚s-1. Typical micrographs of samples taken from the reactor and after passing through the recirculation tube are depicted in Figure 7. There is no evidence of cell damage whatsoever. This realization, coupled with the results of the aforementioned statistical analyses, allows us to conclude that the control system does not affect the culture.
Being a marine microalga, P. lutheri will disrupt following prolonged contact with fresh (salt-free) water. However, the small aliquot that is diluted with fresh water will eventually be discarded (and not recycled to the bioreactor); hence the use of a carrier fluid possessing an osmotic pressure similar to that of the culture is not necessary. On the other hand, the amount of water that replaces the culture is negligible; it is in fact much below that evaporated under regular operation of the reactor. Finally, the use of an aqueous solution of NaCl as carrier fluid was tested for identical osmotic pressure (results
Figure 5. Comparison between results obtained with the novel
system (-, cell number; -‚‚‚- AFDW) and with standard off-line measurements (O, cell number; 0, AFDW).
Figure 6. Comparison between results obtained with the novel
system (-, cell number; -‚‚‚- AFDW) and with standard off-line measurements (0, cell number; O, AFDW; ∆, AFDW - control), during batch and semicontinuous cultures.
Table 3. Growth Rate (µ) and Productivity (Ψ) of Batch and Semicontinuous Culturesa
semicontinuous batch
system on control system on
µ (h-1) 0.0128 ( 0.0005 0.0123 ( 0.0025 0.0123 ( 0.0007 Ψ (mg‚L-1‚d-1) 227.5 ( 4.3 223.3 ( 28.8 147.3 ( 6.6
aExpressed as average ( standard deviation. The controls are semicontinuous cultures processed without on-line monitoring.
Figure 7. Typical micrographs of the culture in the reactor
not shown), but the results were essentially identical to those obtained using fresh water.
There will be possible differences between on- and off-line measurements when cultures reach the stationary and death phases. Those divergences, which are more apparent with regard to cell number, can be explained by cell disruption inside the reactor owing to culture conditions. However, note that the automatic assay is based on a turbidimetric measurement, so cell disruption will not interfere as all cellular pigments released will still contribute to that measurement. This fact also explains the higher divergence in terms of cell number, because the cells disrupted are not counted in the microscope, but the cellular pigments are accounted for in the AFDW off-line assay.
The rapid and accurate automatic determination pro-vided by this system may be of great usefulness at laboratory, pilot, and industrial scales. Contamination problems associated with conventional sampling proce-dures are essentially absent when using this control system; note that contamination is a major problem in microalga cultures. Each replicate used as little as 2.1 mL, which represents only 0.14% of the reactor volume employed; moreover, increasing the reactor volume frac-tion will not affect the sample volume, which means that the relative sample volume will be even more negligible in larger bioreactors.
Considering that our system is completely automatic, coupled with the intrinsically high versatility of FIA (9, 10), the feasibility of this application can be extrapolated to virtually any reactor and can also be optimized to measure more than one parameter at a time, e.g., chlorophyll a determination was already tested using similar detectors (17) and could easily be incorporated in the system described here. The use of a similar control system with aggregating cells would also be feasible; to avoid cell aggregation inside the tubing or promote disaggregation before entering the detector cell, the speed of the carrier fluid should be increased, and an additional cleaning step of the loops may also be (easily) introduced.
Conclusions
An apparatus capable of fast and accurate, automatic on-line biomass determinations in microalga bioreactors is of major importance. A FIA system using two loops (to provide different dilution factors) coupled with a spectrophotometric detector may fulfill that need. Cali-brations are easy to perform, and each culture can be used for calibration in subsequent cultures. Although the system was only tested with P. lutheri, there is no reason why it should not be applicable to cultures of virtually any microalga and other unicellular organisms, provided that cells are the only particulate matter. The simulta-neous determination of other parameters is also possible. The biomass determinations obtained with this system can be used to monitor the culture condition, and to make timely decisions encompassing such other relevant pa-rameters as light intensity and temperature.
Acknowledgment
Dr. Sı´lvia Fernandes is gratefully acknowledged for technical support encompassing the FIA experiments.
Financial support for L.A.M. (Ph.D. fellowship, ref. BD 15890/98, by PRAXIS XXI-Portugal) is also hereby ac-knowledged.
References and Notes
(1) Volkman, J. K.; Dunstan, G. A.; Jeffrey, S. W.; Kearney, P. S. Fatty acids from microalgae of the genus Pavlova.
Phy-tochemistry 1991, 30, 1885-1859.
(2) Yamaguchi, K. Recent advances in microalgae bioscience in Japan, with special reference to utilization of biomass and metabolites: a review. J. Appl. Phycol. 1997, 8, 487-502. (3) Spektorova, L. V.; Goronkova, O. I.; Nosova, L. P.;
Albi-tskaya, O. N.; Danilova, G. High-density culture of marine microalgae-promising items for mariculture III. Mass culture of Monochrysis lutheri Droop. Aquaculture 1986, 55, 231-240.
(4) Marine Bioprocess Engineering, Progress in Industrial
Mi-crobiology; Osinga, R., Tramper, J., Burguess, J. G., Wijffels,
R. H., Eds.; Elsevier Science: Amesterdam, 1999; Vol. 35 (5) Algal Culture: from Laboratory to Pilot Plant, Publication
600; Burlew, J. S., Ed.; Carnegie Institute: Washington, DC, 1953.
(6) Borowitzka, M. A. Microalgae for aquaculture: Opportuni-ties and constraints. J. Appl. Phycol. 1997, 9, 393-401. (7) Baxter, P. J.; Christian, G. D.; Ruzicka, J. Rapid
determi-nation of total biomass from yeast fermentation using se-quential injection. Analyst 1994, 199, 1807-1812.
(8) Guterman, H.; Ben-Yaakov, S.; Vonshak, A. Automatic on-line growth estimation method for outdoor algal biomass production. Biotechnol. Bioeng. 1989, 34, 143-152. (9) Schuhmann, W.; Wohlschla¨ger, H.; Huber, J.; Schmidt, H.
L.; Stadler, H. Development of an extremely flexible auto-matic analyzer with integrated biosensors for on-line control of fermentation process. Anal. Chim. Acta 1995, 315, 113-122.
(10) Valca´rcel, M.; Luque-de-Castro, M. D. Automatic Methods
of Analysis; Elsevier Science: Amsterdam, 1988; Chapter 6,
pp 158-192; Chapter 16, pp 524-529.
(11) Ruzicka J.; Hansen, E. H. Flow Injection Analysis; Wiley: New York, 1988.
(12) Benthin, S.; Nielsen, J.; Villadsen, J. Characterization and application of precise and robust flow-injection analysers for on-line measurement during fermentations. Anal. Chim. Acta
1990, 247, 45-50.
(13) Ogbomo, I.; Prinzing, U.; Schimdt, H. L. Prerequisites for the on-line control of microbial processes by flow injection analysis. J. Biotechnol. 1990, 14, 63-70.
(14) Schugerl, K.; Brandes, L.; Dullau, T.; Holzhauer-Rieger, K.; Hotop, S.; Hubner, U.; Wu, X.; Zhou, W. Fermentation monitoring and control by on-line injection and liquid chro-matography. Anal. Chim. Acta 1991, 249, 87-100.
(15) Peris-Tortajada, M.; Maquieira, A.; Lo´pez, E.; Ors, R. Computer-assisted automation of chemical analysis using flow injection. Application to a fermentation process. Analusis
1991, 19, 266-270.
(16) Borowitzka, M. A. Algal growth media and sources of algal cultures. In Micro-algal Biotechnology; Borowitzka, M. A., Borowitzkza, J. L., Eds.; Cambridge University Press: Cam-bridge, 1988; pp 456-465.
(17) Eriksen, N. T.; Geest, T.; Iversen, J. J. L. Phototrophic growth in the lumostat: a photobioreactor with on-line optimization of light intensity. J. Appl. Phycol. 1996, 8, 345-352.
Accepted for publication August 30, 2002. BP020283U