Vol.58, n.5: pp. 676-685, September-October 2015 http://dx.doi.org/10.1590/S1516-89132015050184
ISSN 1516-8913 Printed in Brazil
BRAZILIAN ARCHIVES OF BIOLOGY AND TECHNOLOGY
A N I N T E R N A T I O N A L J O U R N A L
Development of Fed-Batch Cultivation Strategy for Efficient
Oxytetracycline Production by
Streptomyces rimosus
at
Semi-Industrial Scale
Elsayed Ahmed Elsayed
1,2, Hoda Gamal Omar
3and Hesham Ali El-Enshasy
4,5*1
Bioproducts Research Chair; Zoology Department; Faculty of Science; King Saud University; Riyadh - Kingdom of Saudi Arabia.2Natural and Microbial Products Department; National Research Center; Dokki, Cairo - Egypt. 3Microbiology Department; Faculty of Pharmacy; Alexandria University; Alexandria - Egypt. 4Institute of
Bioproduct Development; Universiti Teknologi Malaysia; Skudai, Johor – Malaysia. 5Genetic Engineering and Biotechnology Research Institute; City for Scientific Research and Technology Applications; New Burg Al Arab, Alexandria - Egypt
ABSTRACT
Oxytetracycline (OTC) production by Streptomyces rimosus was studied in batch and fed-batch cultures in shake flask and bioreactor levels using semi-defined medium. First, the effect of glucose concentration on OTC production and growth kinetics was studied intensively. The optimal glucose concentration in the medium was 15 g/L. Higher glucose concentrations supported higher biomass production by less volumetric and specific antibiotic production. Based on these data, cultivations were carried out at semi-industrial scale 15 L bioreactor in batch culture. At bioreactor level, cell growth and OTC production were higher compared to the shake flask culture by about 18 and 38%, respectively. During the bioreactor cultivation, glucose was totally consumed after only 48 h. Thus, the fed-batch experiment was designed for mono-glucose feeding and complete medium feeding to increase the OTC production by overcoming carbon limitations. The results showed that the fed-batch culture using constant glucose feeding strategy with rate of 0.33 g/L/h produced 1072 mg/L. On the other hand, feeding with complete medium resulted in 45% higher biomass but less OTC production by about 26% compared to mono-glucose fed culture. A further improvement in this process was achieved in by keeping the dissolved oxygen (DO) value at 60% saturation by cascading the glucose feeding pump with the DO controller. The later feeding strategy resulted in higher antibiotic production, reaching 1414 mg/L after 108 h.
Key words: Oxytetracycline, Streptomyces rimosus, bioreactor, fed-batch cultivation, feed-back control
*Author for correspondence: [email protected]
INTRODUCTION
Since its discovery in the late 1940 s, oxytetracycline (5-hydroxytetracycline, CAS # 79572) is still one of the most widely used antibiotics with many applications in the medical and non-medical sectors. The growing market in the medical sector is based on the continuous use of the original antibiotic molecule in addition to
water-soluble antibiotic belongs to the aromatic polyketide group and is characterized by its four benzene rings, has a chemical structure of
C22H24N2O9, and molecular weight of 460.434
g/mol. Its production was reported using different
actinomycetes belonging to Streptomyces sp. such
as S. rimosus, S. capuensis, and S. plantensis,
cultivated either in solid-state or in submerged systems (Abu-Zeid et al. 1993; Ali et al. 1993; Zhang et al. 2013). In an attempt to increase the antibiotic yield, many studies were carried out to improve the cell productivity using irradiation induced mutagenesis (Lazim et al. 2010) or through the genetic modification to enhance the malonly Co-A production as OTC a precursor, and thus, the total antibiotic production (Tang et al. 2011). Other non-genetic engineering approaches were also applied to shorten the production time and increase the yield by the immobilized cells using different matrices (Farid et al. 1994a, 1994b) and production using the mixed cultures (Farid et al. 1995; Okorie et al. 2008). However, until now, the industrial production of OTC is mainly carried
out in submerged culture using S. rimosus free
cells.
The production of the antibiotic is highly affected by the medium composition and cultivation
conditions. Previous studies have clearly
demonstrated that glucose is usually the most preferred carbon source for OTC production (Singh et al. 2012). However, like many other secondary metabolites, OTC biosynthesis is affected by the carbon source concentration. When glucose is added to the culture medium at higher concentration, it shows a negative influence on antibiotic production due to carbon catabolite repression (CCR) as in many cases such in
anthrocycline production by S. peucetius
(Escalante et al. 1999), cephamycin C by S.
clavuligerus (Demain and Fang 1995), and
retamycin by S. olindensis (Inoue et al. 2007). In
addition, the overflow of glucose in the primary metabolic pathway in streptomycetes promotes organic acid production in the culture medium (Dekleva and Stroh 1987). Thus, many studies have focused on using the non-glucose carbon source to overcome the CCR, but the yield of antibiotic was less compared to glucose based medium and more difficult to control. Thus, fed-batch strategy was considered as alternative cultivation process by many researchers to increase antibiotic production by actinomycetes such as in case of rifamycins production by
Amycolatopsis mediterranei (El Enshasy et al.
2003), clavulanic acid by S. clavuligerus
(Saudagar and Singhal 2007), and daptomycin by
S. roseosporus (Ng et al. 2014). Papapanagiotou et al. (2005) and Hewitt et al. (2007) investigated the application of emulsification technologies to enhance rapeseed oil consumption during OTC under fed-batch conditions. However, they aimed mainly to compare between the effect of feeding normal rapeseed oil and rapeseed oil emulsion produced by phase inversion temperature on the utilization of rapeseed oil. They conducted their experiments in 5-L bioreactor with constant substrate feeding rate from the beginning of the cultivation. However, they did not reveal the feeding rates applied, and only showed that rapeseed oil emulsion enhanced OTC production by about 13-15%.
The aim of the present study was focused on the determination of the optimal glucose concentration for OTC production using a semi-defined medium. To the best of our knowledge, this is the first report to evaluate OTC production in semi-industrial scale bioreactor (15-L) using different feeding strategies.
MATERIAL AND METHODS
Microorganism and vegetative cultivation medium
The OTC producer strain, S. rimosus sub sp.
rimosus DSMZ 41439 (Deutsche Sammlung von
Mikroorganismen und Zellkulturen,
Braunschweig, Germany), was used in this study. The strain was activated in ISP2 broth (composed of g/L: malt Extract, 10.0; yeast Extract, 4.0; glucose, 4.0; pH 7.0), followed by growth on ISP2 agar medium for 10 days. The arisen spores were harvested using 50% glycerol solution and maintained in cryovials at -80°C as cell bank for further use. For the quantitative determination of
OTC, the standard strain Bacillus subtilis
NRRL-B543 was used. This strain was obtained from the Agriculture Research Service Culture Collection (ARS, Peoria, IL, USA).
Cultivation conditions in vegetative and OTC production media
on a rotary shaker (Innova 44, Eppendorf Inc., Enfield, USA) at 28°C and 200 rpm. After 72 h, the cells were used in either shake flask or bioreactor at a concentration of 5% (v/v). The OTC production medium used in this study was modified from Omar et al. (2014) and composed of (g/L): glucose, 20.0; yeast extract, 5.0;
(NH4)2SO4, 3.0; KH2PO4, 2.0; K2HPO4, 1.0;
MgSO4.7H2O, 0.5. The pH was adjusted to 7.0
before sterilization. Glucose was autoclaved separately and added to other medium components before inoculation. In the case of shake flask cultures, cultivations were carried out in 250 mL Erlenmeyer flask containing 50 mL mediumand incubated at 28°C and 200 rpm. Bioreactor
cultivations were conducted in a 15-L in situ
sterilizable stainless steel bioreactor (Biostat C, Sartorius BBI Systems, Melsungen, Germany) with an initial working volume of 8-L. Agitation was carried out using two 6-bladed Rushton
turbines of the following dimensions: dt(tank diameter)
= 215 mm; di(impeller diameter) = 86 mm; di/dt= 0.4.
Agitation was adjusted at 400 rpm and aeration was performed using the filtered sterile air at a rate of 1 v/v/min controlled by an integrated mass flow controller (Bronkhorst High-Tech B.V., Ruurio, The Netherlands). The pH and DO values in the
culture were determined on-line using in situ
sterilizable electrodes (Inglod, Mittler Toledo, Switzerland). The bioreactor control panel was attached to a supervisory computer system equipped with the standard software for bioprocess control and data logging (MFCS/Win 2.1, Sartorius BBI Systems, Melsungen, Germany). Oxygen and carbon dioxide concentration in the out-gas was determined continuously using
six-channelled O2/CO2 outgas analyzer (Sartorius BBI
System, Melsungen, Germany) and attached to the MFCS supervisory control system. In fed-batch culture, substrate(s) feeding was carried out using
the peristaltic pumps (Watson Marlow,
Wilmington, MA, USA) connected with the main bioreactor supervisory control system.
Sample preparation and determination of cell dry weight (CDW)
Samples in the form of three flasks (50 mL each) or 20 mL of broth in case of bioreactor cultures, were taken at different time intervals and collected in pre-weighed centrifuge tube of 50 mL total volume (Falcon, USA). Samples were centrifuged at 5°C/5000 rpm for 15 min. The supernatant was frozen immediately at -20°C for glucose and OTC
determination. The cell pellets were washed two times with distilled water, centrifuged and the washed cells were dried in a vacuum oven at 40°C for 24 h and used thereafter for cell dry weight determination.
Glucose and OTC determination
Glucose concentration in the fermentation broth
was measured using glucose analyzer
(Biochemical analyzer 2700, Yellow Springs Instruments, OH, USA). The concentration of OTC was quantitatively determined using agar plate diffusion method (Farid et al. 1994a,b; Elsayed et al. 2013). The diameter of inhibition zone was converted to OTC mg/L using a biological standard curve between the logarithm of different antibiotic concentrations and the mean
diameters of the inhibition zone of B. subtilis
NRRL-B543.
Statistical analysis
Data were analysed with the help of SPSS 9.0 and the results were given as mean SD of three separate experiments replicates. The mean
comparison between different evaluated
parameters was performed using ANOVA one-way analysis of variance. Statistical significance
was defined when p 0.05.
RESULTS AND DISCUSSION
Effect of different initial concentration of glucose on OTC production in shake flask
cultures
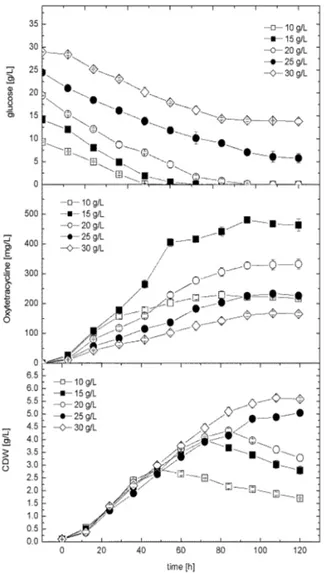
The effect of varying initial glucose concentrations (10-30 g/L) was studied at shake flask level. As shown in Figure 1, increasing glucose resulted in
significant increase (p 0.05) in cell growth and
concentration. For all the cultures below 20 g/L, glucose was totally consumed at the end of cultivation time, whereas almost 76 and 52% of the initial glucose concentrations were un-utilized in the cultures of 25 and 30 g/L, respectively. The pattern of glucose consumption rate was also dependent on the initial concentration applied.
Figure 1 - Effect of different glucose concentrations on
cell growth and OTC production using semi-defined industrial medium in shake flask level. The data represent mean values and standard deviation of three independent experiments.
Maximal consumption rate of 0.25 ± 0.01 g/L was obtained when the initial glucose in the medium between 15-20 g/L. It was also observed that, when glucose became limited in the culture, cell dry weight decreased immediately as function of cell lysis (cultures of initial glucose concentration between 10 and 20 g/L). On the other hand, the
maximal OTC production rate of 5 mg/mL/h was obtained in the 15 g/L glucose supplemented culture. For better understanding of the cell performance toward OTC production in all the
cultures, the yield coefficients Yp/x and Yp/s were
also calculated. It was observed that the maximal
values of Yp/x and Yp/s of 119.4 mg/g and 16.02,
respectively, were obtained in 15 g/L glucose supplemented culture. This indicated that the cells grown in this culture showed higher physiological performance and higher substrate conversion for antibiotic production. It was also worthy to note that, in all the cultures studied the pH dropped initially during the first 36 h and increased gradually thereafter during the active growth and antibiotic production phase. Based on these results, it could be concluded that 15 g/L was the optimal glucose concentration to achieve the maximal volumetric and specific OTC production during batch cultivation in shake flasks. Higher glucose concentrations led to a dramatic decrease in the volumetric and specific antibiotic production concomitant with an increase in cell dry weight.
Batch cultivation of S. rimosus in stirred tank
bioreactor
In this experiment, cell growth and OTC production kinetics were studied during batch
cultivation of S. rimosus in 15-L pilot scale stirred
tank bioreactor using the same medium
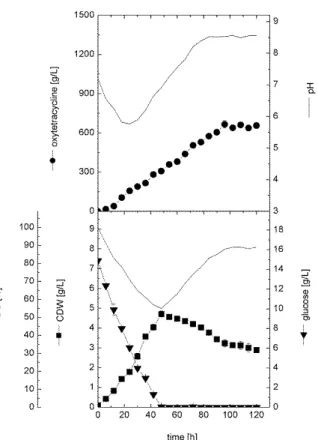
composition of the optimal glucose concentration (15 g/L) and inoculum size as used in the shake flask experiment. As shown in Figure 2, cells grew exponentially without a significant lag phase at a rate of 0.096 g/L/h and specific growth rate ( ) of
0.04 h-1 and reached a maximal cell mass of 4.7
0.16 g/L after 48 h. During this phase, glucose was utilized in the culture as a function of cell growth with a rate of about 0.33 g/L/h and was completely consumed after about 48 h. However, during this active growth phase, DO gradually decreased in the culture, reaching a minimal value of about 55% saturation at 48 h as the cells entered
stationary phase and increased gradually,
thereafter reaching about 89% saturation at the end of cultivation time. Once glucose was limited in the culture, a significant decrease in cell dry
weight (p 0.05) was observed. This reduction was
culture at a rate of 0.025 g/L/h and reached about 2.9 0.12 g/L at the end of cultivation time. Carbon source limitation in actinomycetes can cause either degradation of the produced antibiotic or decrease in biomass production depending on the structure and the stability of the product. If cells can degrade the product and use it for energy maintenance, the cells will survive without lysis phase (Elsayed et al. 2013). Whereas, if the product is stable and could not be used as source of energy maintenance, cells will lyse accordingly. This observed significant reduction of biomass after carbon source limitation in bioreactor has been observed earlier also during the cultivation of
other actinomycetes such as in Saccharopolyspora
erythraea (El Enshasy et al. 2008) and
Amycolatopsis mediterranei (El Enshasy et al. 2003). However, the rate of decrease in cell dry weight in the bioreactor was 0.025 g/L/h, which was almost the same value obtained in the shake flask culture under glucose limitation. Based on using the active growing cells as inoculum, OTC
production started immediately after cell
inoculation at a volumetric production rate (QP) of
about 6.93 mg/L/h. The maximal volumetric production of 665 28.28 mg/L was achieved after 96 h of cultivation (about 48 h after the termination of cell growth phase). The antibiotic concentration was more or constant in the broth for the rest of the cultivation time.
Figure 2 - Cell growth, OTC production, glucose
consumption and changes in DO and pH profiles during batch cultivation of S. rimosus in stirred tank bioreactor at 400 rpm, aeration rate of 1 v/v/min and 28°C.
Table 1 - Kinetic parameters for cell growth, OTC production, and glucose consumption during S. rimosus
cultivation in shake flask level in medium of different glucose concentrations.
Parameter
Glucose concentration (g/L)
10 15 20 25 30
Growth and glucose consumption parameters
Xmax-Biomass (g/L) 2.85 0.07 4.00 0.11 4.35 0.09 4.9 0.06 5.6 0.11
Xmax-time (h) 48 72 84 96 108
dx/dt (g/L/h) 0.059 0.055 0.057 0.050 0.056
max (1/h) 0.041 0.027 0.026 0.020 0.020
Qs (g/L/h) 0.19 0.26 0.25 0.18 0.17
Gluccons-120h (%) 100 100 100 76 52
pH120 h 8.17 8.56 8.22 8.05 7.55
OTC production parameters
Pmax-vol (mg/L) 230 13.44 480 7.78 327 10.61 233 6.36 168 5.66
Pmax-time (h) 84 96 96 108 108
QP (mg/L/h) 3.06 5.00 3.41 2.35 1.68
Yield coefficients
Yx/s (g/g)a 0.09 0.13 0.15 0.20 0.35
Yp/x (mg/g)b 85.8 119.4 75.8 47.8 29.8
Yp/s (mg/g)b 7.65 16.02 10.95 9.75 10.46
Abbreviations: Xmax-Biomass, maximal cell dry weight; Xmax-time,time of maximal dry weight; dx/dt, cell growth rate; max, maximal specific
growth rate; Qs, glucose consumption rate; Gluccons-120h, percentage of initial glucose consumed in culture after 120 h (end of cultivation
time); pH120 h, the pH value after 120 h (end of cultivation), Pmax-vol, maximal volumetric OTC production; Pmax-time, time of maximal OTC
production; Qp, OTC production rate; Yx/s, g biomass per g glucose consumed; Yp/x, mg OTC per g biomass; Yp/s, mg OTC per g glucose
Fed-batch cultivation of S. rimosus
Based on the results of batch cultivation in
bioreactor, different fed-batch cultivation
strategies were developed to enhance OTC production in semi-industrial scale level. At first, cultivations were conducted with constant feeding for either glucose (as limiting substrate) or with complete medium. Feeding was carried out between 36 and 90 h with the rate of 0.33 g/L/h, i.e., the glucose consumption rate obtained from the batch culture. An additional set of experiment was also carried out for the fed-batch cultivation to keep the DO in the culture in range of 60% saturation by glucose feeding only.
Fed-batch cultivation using constant feeding strategy with glucose feeding and complete medium feeding
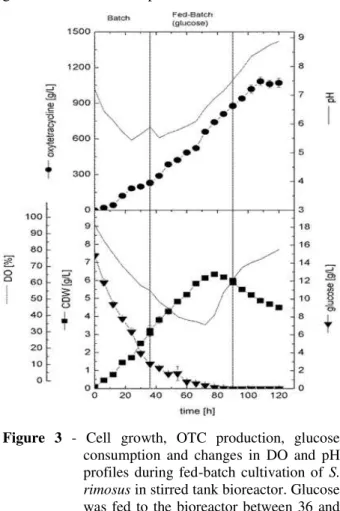
In this experiment, cultivation was run under the same conditions of batch culture for the first 36 h. After that time, feeding was started at a constant rate of 0.33 g/L/h using a concentrated glucose solution (300 g/L). The Figure 3 presents the kinetic data for the cell growth, glucose consumption and OTC production. The cells grew exponentially without a significant lag phase concomitant with glucose consumption in the medium and rapid decrease in both of pH and DO. After 36 h, when the glucose concentration reached about 2 g/L (based on the data of batch culture), feeding was started at a constant rate of 0.33 g/L/h. Once feeding started, the DO decreased further, reaching a minimal value of 40% saturation after 80 h and increased again thereafter once the cells entered stationary phase during that time. On the other hand, cells further grew in the culture during the feeding time, reaching 6.35 0.09 g/L after 78 h and decreased gradually due to carbon source limitation in the culture. Feeding was stopped after 90 h but OTC continued to accumulate in the culture until reaching its maximal value of 1085 35.36 mg/L after 108 h and kept more or less constant for the rest of cultivation time. Both the volumetric and specific OTC productions were higher in this culture compared to the corresponding batch by about 60 and 21%, respectively. This indicated that the increase in the OTC production in this medium was due to the increase of both biomass production and cell productivity as well, through
overcoming the carbon source limitation.
However, after 78 h, the glucose concentration
reached zero value during the feeding and became limited in the culture as the feeding rate became less than the consumption rate due to higher cell growth and antibiotic production.
Figure 3 - Cell growth, OTC production, glucose
consumption and changes in DO and pH profiles during fed-batch cultivation of S. rimosus in stirred tank bioreactor. Glucose was fed to the bioreactor between 36 and 90 h with rate of 0.33 g/L/h.
production rate was almost half of the value obtained in glucose fed-culture.
The higher biomass production concomitant with significant reduction in OTC volumetric and specific production was due to the high phosphate concentration in the feeding medium, which resulted in the phosphate accumulation in the culture. It is well known that phosphate plays a regulatory function in actinomycetes secondary metabolite biosynthesis and suppresses antibiotic production when applied in the medium at high concentration (Lounes et al. 1995; Martin 2004). For high OTC production, phosphate in culture should be applied in concentrations lower than 1.5% (w/v), as it could exhibit inhibitory effects
when present in the culture at higher
concentrations (Yang and Lee 2001). It has also
been reported that OTC production by S. rimosus
is regulated by Streptomyces antibiotic regulatory
proteins (SARPs), which are active under low phosphate concentrations (McDowall et al. 1999).
Figure 4 - Cell growth, OTC production, glucose
consumption and changes in DO and pH profiles during fed-batch cultivation of S. rimosus in stirred tank bioreactor. Concentrated solution of all medium components was fed to the bioreactor between 36 and 90 h. Feeding was adjusted at a rate of 0.33 g/L/h. based on the glucose content in medium.
Fed-batch cultivation using glucose feeding strategy for DO-stat culture
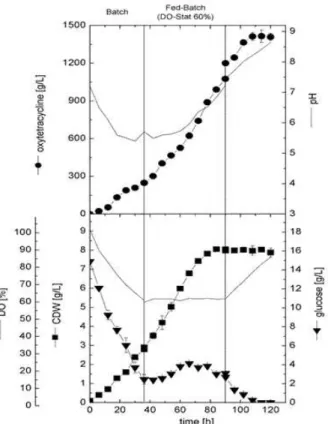
During the cultivation of aerobic microorganisms, DO decreases rapidly during the exponential growth phase as a result of high oxygen consumption. The rate of DO reduction in the culture is dependent on the amount of biomass and also on the physiological status of the cells. Once cells entered the stationary phase, dissolved oxygen increased gradually due to the less oxygen consumption (Figs. 2-4). Based on the time of batch cultivation in this study, it was clear that cells entered stationary phase after 48 h as a result of glucose limitation. Thus, in this experiment the glucose feeding pump was cascaded to DO in the culture to be constant at 60% saturation to prolong the cell growth phase and increase OTC production. As shown in Figure 5, the culture was initially run in batch mode like with other previous fed-batch cultivations.
Figure 5 - Cell growth, OTC production, glucose
After 36 h, the DO reached 60% saturation and the glucose concentration reached about 2.5 0.49 g/L. At that time, glucose feeding was started to keep the DO value at 60% up to 90 h. During the feeding phase, glucose was not limited in the culture and its concentration was ranged between 2.0 and 4.0 g/L. After ceasing of feeding, glucose become limited in the culture almost after 20 h. During glucose feeding, cells continued to grow and reached their maximal value of about 8.0 0.09 g/L after 82 h and were more or less constant during the post-feeding phase. On the other hand, OTC production continued in the culture at a rate of 13.08 mg/L/h, reaching 1412 31.82 mg/L
after 108 h. This value was almost 112 and 30% higher compared to the batch and constant glucose fed cultures, respectively. However, the specific antibiotic production in this culture was about 175 mg/g (with almost the same obtained in glucose fed culture using constant feeding strategy). Thus, it could be concluded that the increase in the volumetric antibiotic production in this culture was due to higher biomass production rather than cell productivity. Table 2 showed the growth kinetic data of cell growth and OTC production when cells were cultivated in different scales and cultivation strategies.
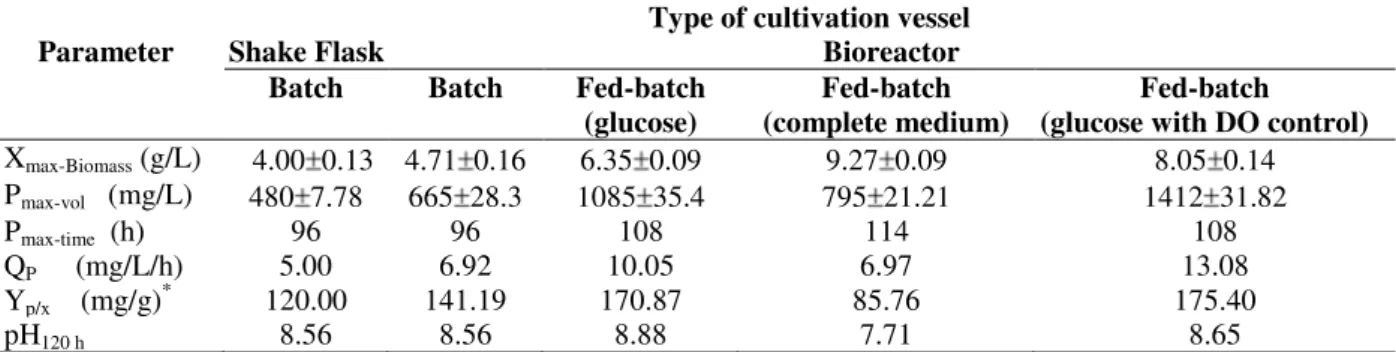
Table 2 - Kinetic parameters for cell growth, OTC production, and glucose consumption during S. rimosus
cultivation in different cultivation scales and mode of operation.
Parameter
Type of cultivation vessel
Shake Flask Bioreactor
Batch Batch Fed-batch
(glucose)
Fed-batch (complete medium)
Fed-batch (glucose with DO control)
Xmax-Biomass (g/L) 4.00 0.13 4.71 0.16 6.35 0.09 9.27 0.09 8.05 0.14
Pmax-vol (mg/L) 480 7.78 665 28.3 1085 35.4 795 21.21 1412 31.82
Pmax-time (h) 96 96 108 114 108
QP (mg/L/h) 5.00 6.92 10.05 6.97 13.08
Yp/x (mg/g) *
120.00 141.19 170.87 85.76 175.40
pH120 h 8.56 8.56 8.88 7.71 8.65
Abbreviations: Xmax-Biomass, maximal cell dry weight; Pmax-vol, maximal volumetric OTC production; Pmax-time, time of maximal OTC production; Qp,
OTC production rate; pH120 h, the pH value after 120 h (end of cultivation); Yp/x, mg OTC per g biomass; (*: value calculated at the time of P max-vol.and divided by maximal biomass before cell lysis).
Evidently there was significant improvement in the antibiotic production process with a controlled glucose fed-batch DO based strategy.
The advantage of this feeding strategy was to overcome the negative impact of overfeeding and underfeeding on cell growth and product formation (Lee et al. 1999). Carbon source feeding using DO and outgas analysis online data (for
oxygen consumption or carbon dioxide
production) was also proven as suitable fed-batch approach to prevent carbon source limitation and
increase polysaccharide production by Pleurotus
ostreatus (El Enshasy et al. 2010) and in DNA
vaccine production by the recombinant
Escherichia coli (Chen et al. 1997). However, in addition to the advantages of this approach to prevent carbon source limitation and substrate overflow, this cultivation strategy also helped to control the DO value at certain levels during the cultivation. In most processes for antibiotic production by aerobic microorganisms such as
actinomycetes, DO controls the cell growth and
product biosynthesis significantly and is
considered as secondary metabolite limiting substrate for different types of antibiotics (Collins et al. 1989; Martins et al. 2004; Wang and Zhang 2007).
CONCLUSION
Results demonstrated for the first time the potential of different fed-batch cultivation strategies to enhance the production of OTC in
semi-industrial scale bioreactor. After the
determination of the optimal glucose concentration in the medium for OTC production, it was possible to achieve maximal OTC production in semi-industrial scale using a semi-defined medium. Based on the glucose concentration data,
appropriate feeding strategy for enhanced
Maximal volumetric and specific OTC production was achieved in glucose fed-batch culture with feedback control to keep DO at level of 60% saturation. The antibiotic production using this cultivation strategy was almost 112% higher than the batch culture. This developed feeding strategy could be also applied to improve other antibiotics and secondary metabolites production processes, which are sensitive to glucose repression effect.
ACKNOWLEDGEMENT
This work was financially supported by the Deanship of Scientific Research at king Saud University [Research Group Project RG-1435-047].
REFERENCES
Abu-Zeid AA, Baeshin NA, Baghlaf AO. Utilization of date products in production of oxytetracycline by
Streptomyces rimosus. Zentralblatt Für Mikrobiol.
1993; 148: 333-341.
Ali AZ, Abdelrahman N, Baghlaf A. Use of date products in production of oxytetracycline by
Streptomyces rimosus. Biosci Biotechnol Biochem. 1993; 57: 987-988.
Bradford BA, Jones CH. Tetracyclines. In: Dougherty TJ, Pucci TJ, editors. Antibiotic Discovery and Development. New York: Springer Science+Buisness Media, LLC; 2012. p. 147-180.
Chen W, Graham C, Ciccarelli RB. Automated fed-batch fermentation with feed-back controls based on dissolved oxygen (DO) and pH for production of DNA vaccine. J Ind Microbiol Biotechnol. 1997; 18: 43-48.
Collins MJ, Jensen SE, Westlake DWS. Regulation of antibiotic production by iron and oxygen during defined medium fermentations of Streptomyces clavuligerus. Appl Microbiol Biotechnol. 1989; 31: 390-396.
Dekleva ML, Stroh WR. Glucose-stimulated acidogenesis by Streptomyces peucetius. Can J Microbiol. 1987; 33: 1129-1132.
Demain AL, Fang A. Emerging concepts of secondary metabolism in actinomycetes. Actinomycetologica. 1995; 9: 98-117.
El Enshasy HA, Beshay UI, El-Diwany AI, Omar HM, El-Kholy AE, El-Najar R. Improvement of rifamycins production by Amycolatopsis mediterranei in batch and fed-batch cultures. Acta Microbiol Polonica. 2003; 51: 301-313.
El Enshasy HA, Mohamed NA, Farid MA, El-Diwany AI. Improvement of erythromycin production by
Saccharopolyspora erythraea in molasses based medium through cultivation medium optimization.
Bioresour Technol. 2008, 99: 4263-4268.
El Enshasy H, Daba A, El Demellawy M, Ibrahim A, El Sayed S, El Badry I. Bioprocess development for large scale production of anticancer exo-polysaccharide by Pleurotus ostreatus in submerged culture. J Appl Sci. 2010; 10: 2523-2529.
Elsayed EA, Farid MA, El Enshasy HA. Improvement in natamycin production by Streptomyces natalensis with the addition of short-chain carboxylic acids. Process Biochem. 2013; 48: 1831-1838.
Escalante L, Ramos I, Imriskova I, Langley E, Sanchez S. Glucose repression of anthracycline formation in
Streptomyces peucetius var. caesius. Appl Microbiol Biotechnol. 1999; 52: 572-578.
Farid MA, El Diwany AI, El Enshasy HA. Production of oxytetracycline and rifamycins B and SV with cells immobilized on glass wool. Acta Biotechnol. 1994a; 14: 67-74.
Farid MA, El Diwany AI, El Enshasy HA. Production of oxytetracycline by immobilized Streptomyces rimosus cells in calcium alginate gels. Acta Biotechnol. 1994b; 14: 303-309.
Farid MA, El Diwany AI, Daniel EN, El Enshasy HA. Production of oxytetracycline and lysine using mixed culture fermentation. Chemie Mikrobiol Technol Lebensmittel. 1995; 17: 139-144.
Hewitt CJ, Papapanagiotou PA, Quinn H, Molitor JP, Stocks SM, Nienow AW. The use of emulsification technologies to enhance rapeseed oil consumption during industrial Streptomyces rimosus fed-batch fermentations. Chem Eng Res Design. 2007; 85: 1072-1078.
Inoue OO, Netto WS, Padilla G, Facciotti MCR. Carbon catabolite repression of retamycin production by Streptomyces olindensis ICB20. Braz J Microbiol. 2007; 38: 58-61.
Lazim H, Slama N, Mankai H, Barkallah I, Limam F. Enhancement of oxytetracycline production after gamma irradiation-induced mutagenesis of
Streptomyces rimosus CN08 strain. World J Microbiol Biotechnol. 2010; 26: 1317-1322.
Lee J, Lee SY, Park S, Middelberg APJ. Control of fed-batch fermentations. Biotechnol Adv. 1999; 17: 29-48.
Lounes A, Lebrihi A, Benslimane C, Lefebvre G, Germain P. Regulation of spiramycin synthesis in
Streptomyces ambofaciens; effects of glucose and inorganic phosphate. Appl Microbiol Biotechnol. 1996; 45: 204-211.
solutions, injections); Global Forecasts to 2018; [cited 2014 May 5]. Available from: http://www.prnewswire.com/news-releases/animal- antimicrobials-and-antibiotics-market-worth-41438-million-by-2018-257950831.htmL.
Martin JF. Phosphate control of the biosynthesis of antibiotics and other secondary metabolites is mediated by the PhoR-PhoP system: an unfinished story. J Bacteriol. 2004; 186: 5197-5201.
Martins RA, Guimarães LM, Pamboukian CR, Tonso A, Facciotti MCR, Schmidell W. The effect of dissolved oxygen concentration control on cell growth and antibiotic retamycin production in
Streptomyces olindensis So20 fermentations. Braz J Chem Eng. 2004; 21: 185-192.
McDowall KJ, Thamchaipenet A, Hunter IS. Phosphate control of oxytetracycline production by
Streptomyces rimosus is at the level of transcription from promoters overlapped by tandem repeats similar to those of the DNA-binding sites of the OmpR family. J Bacteriol. 1999; 181: 3025-3032.
Ng IS, Ye C, Zhang Z, Lu Y, Jing K. Daptomycin antibiotic production processes in fed-batch fermentation by Streptomyces roseosporus
NRRL11379 with precursor effect and medium optimization. Bioprocess Biosyst Eng. 2014; 37: 415-423.
Okorie PC, Asagbra AE. Oxytetracycline production by mix culture of Streptomyces rimosus and S. vendagensis in solid-state fermentation of cassava peels. J Ind Res Technol. 2008; 2: 43-47.
Omar H, Elsayed EA, Kenawy AA, Wadaan MA, El Enshasy HA. Effect of cultivation scale and shear stress on cell growth and oxytetracycline production by Streptomyces rimosus in semi-defined medium. J Pure Appl Microbiol. 2014; 8: 121-128.
Papapanagiotou PA, Quinn H, Molitor JP, Nienow AW, Hewitt CJ. The use of phase inversion temperature (PIT) microemulsion technology to enhance oil utilisation during Streptomyces rimosus fed-batch fermentations to produce oxytetracycline. Biotechnol Lett. 2005; 27: 1579-1585.
Saudagar PS, Singhal RS. Optimization of nutritional requirements and feeding strategies for clavulanic acid production by Streptomyces clavuligerus. Bioresource Technol. 2007; 98: 2010-2017.
Singh N, Rai V, Tripathi CKM. Production and optimization of oxytetracycline by a new isolate
Streptomyces rimosus using response surface methodology. Med Chem Res. 2012; 21: 3140-3145. Tang Z, Ciao C, Zhuang Y, Chu J, Zhang S, Herron PR,
et al. Improved oxytetracycline production in
Streptomyces rimosus M4018 by metabolic engineering of the G6PDH gene in the pentose phosphate pathway. Enzyme Microb Technol. 2011; 49: 17-24.
Wang Y-H, Zhang X. Influence of agitation and aeration on growth and antibiotic production by
Xenorhabdus nematophila. World J Microbiol Biotechnol. 2007; 23: 221-227.
Yang SS, Lee CM. Effect of culture media on protease and oxytetracycline production with mycelium and protoplasts of Streptomyces rimosus. World J Microbiol Biotechnol. 2001; 17: 403-410.
ZhangW, Huang M-H, Qi F-F, Sun P-Z, Ginkel SWV. Effect of trace tetracycline concentrations on the structure of a microbial community and the development of tetracycline resistance genes in sequencing batch reactors. Bioresource Technol.
2013; 150: 9-14.