A Work Project, presented as part of the requirements for the Award of a Master Degree in Management from the NOVA – School of Business and Economics.
Other Comprehensive Income – Materiality, volatility and reporting
issues within the German company environment
Gregory Neff, 3372
A Project carried out on the Master in Management Program, under the supervision of:
Leonor Fernandes Ferreira
2 Abstract
This Work Project aims at providing valuable issues regarding Other Comprehensive Income within the German company environment. It analyses the recent company consolidated annual reports of 2015 and 2016 to present OCI reporting patterns. The findings prove that the two-statement presentation format is mostly used but high inconsistency in other presentation issues can be observed. Certain OCI items appear in most of the analysed company’s financial statements and dominate in value, but high volatility was observed. Unspecific legislation contributes to general aversion of OCI, however, the findings suggest that OCI can have a material impact on total comprehensive income.
Key words: Financial reporting, Other Comprehensive Income, DAX, MDAX, IAS 1 1. Introduction
This Work Project aims at giving an insight into the presentation and disclosure of Other Comprehensive Income (OCI) of German large and mid-sized companies. Furthermore, it deals with the different items of OCI within the sample, their size and their contribution on the total comprehensive income. Lastly, it gives an overview within the German environment about the latest changes regarding the presentation of OCI, the separation between items subject to reclassification and items not subject to reclassification. As OCI and its components are often regarded as “bad stuff” (Wsj, 2016), there is a certain aversion in understanding this part of the comprehensive income. The motivation behind this paper is to clarify the complicated term of OCI and its components. Furthermore, as there was no revision of International Accounting Standard 1 (IAS 1) regarding OCI in the past years, the motivation is to display several reporting issues within OCI in terms of presentation and content. Finally, as most OCI items are measured at fair value and as this method of measuring got more and more important within the past two decades, there is a reasonable assumption that OCI itself will get more important in the future. Hence, its reporting has to be clarified. As Germany represents one of the most
3
important economies within the Eurozone as well as a highly diverse industry landscape, choosing this region for an analysis of OCI provides a solid sample and the possibility of future research. The paper is structured as follows: In Section 2, the definition of the concept of OCI and its current regulatory framework is given. Section 3 presents the literature review regarding OCI. Section 4 outlines the research questions, explains the methodology and gives an overview over the sample. Section 5 presents and discusses the results of the research questions. Finally, Section 6 concludes this Work Project, gives limitations and suggestions for future research. 2. Regulatory Framework
It is inalienable to deal with the term of OCI itself within the year-end report of a company. The International Accounting Standards Board (IASB) defines OCI as “[…] items of income and expense (including reclassification adjustments) that are not recognised in profit or loss as required or permitted by other International Financial Reporting Standards (IFRS)” (IAS 1.7). Next to the profit and loss statement and the owner movements within a company (for example increase in share capital or dividend payments), the OCI represents a component of the changes in equity between two reporting dates of the entity. In contrast to owner movements, OCI contributes to the overall success of a company as it can be related to the entrepreneurial activities of a company. However, the items of OCI are not directly related to the operating activities of a company but only by also paying attention to them, an investor gets the true picture of the profit situation of a company (Müller and Reinke, 2008). The OCI represents a part of the “dirty surplus concept”, which finds its application according to IFRS and the United States Generally Accepted Principles (US-GAAP). In conformity to this concept, only usual and frequent components of the entities business activities are shown in the profit and loss statement. With this “current operating performance approach”, the profit and loss statement and its result get a higher degree of sustainability. Any other non-sustainable positions, which are mostly based on value based changes rather than transactions, find their way past the profit
4
and loss statement to the OCI (Coenenberg, Haller and Schultze, 2014). In table 1, the position of OCI according to IFRS is clarified:
Table 1: Position of OCI according to IFRS
Changes in equity within a period
Comprehensive Income Neutral changes
Net income OCI Transactions with
owners
Retrospective adjustments (Kütting and Weber, 2015)
Concluding we can say that OCI represents items which are not related to the usual operating activities of a company, not sustainable and based on external value changes like movements in foreign exchange markets or securities markets.
As most of the German DAX and MDAX companies report according to IAS/ IFRS, these International Financial Reporting Standards published by the IASB are the statutory basis for OCI. The IAS 1 – Presentation of Financial Statements represents the framework regarding the reporting of OCI. The IAS 1 requires to present a section of profit and loss as well as OCI. Furthermore, an entity is required to present Comprehensive Income, being the sum of the profit and loss and OCI positions (IAS 1.81A). This standard specifies the complicated manners of OCI by requiring a classification of items within the OCI section. Companies are required to separate OCI into two sections: Items which are subject to reclassification to profit and loss in the future and items which are not (IAS 1.82A). Interestingly, the IASB states within IAS 1.82 A that the items are “[…] grouped into those that, in accordance with other IFRSs: […]”. This already gives a hint that not all specifications of the OCI are regulated within one standard, namely IAS 1, but rather in several standards. Furthermore, IAS 1 does not provide a clear requirement about the presentation of tax effects regarding items within the OCI. Tax effects could also be disclosed under the notes of a company’s financial statement and therefore be completely hidden within the OCI of the entity (IAS 1.90). The same pattern can be observed regarding reclassification adjustments for OCI items: Companies may choose between presenting reclassification adjustments within the OCI or disclose them in the notes (IAS 1.96).
5
Within IAS 1, there is no clear specification about which items are to include in the statement of OCI as only common positions are mentioned (IAS 1.7). The regulation of OCI within IAS 1 itself was lastly revised in 2011 where the IASB introduced the separation between items which are and items which are not subject to reclassification within OCI (Deloitte, 2011). In the Exposure Draft of the new IAS 1, the IASB continued to express its preference for a single, continuous statement composed of profit and loss and OCI as it would enhance clarity about all non-owner movements (IASB, 2010). However, making this proposal obligatory for all entities met with heavy resistance during the comment phase and therefore there is still a freedom of choice regarding the one- or two-statement approach of comprehensive income (Sellhorn, 2017).
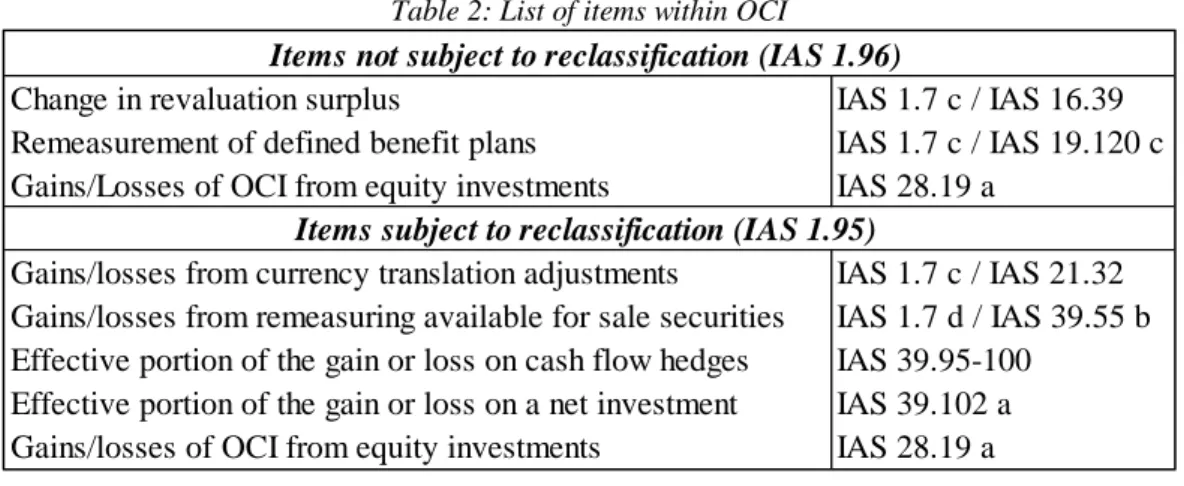
Regarding the specific items within OCI, table 2 gives an overview of the most common items included in the OCI and their respective standard.
Table 2: List of items within OCI
Although the IASB has tried to tackle certain disparities regarding OCI within its latest project in 2011, there are still many unresolved points which are mostly due to the fact that there is too much freedom of choice or because some points are not clearly defined regarding the equal treatment of unrealised gains and losses, where we can observe a loss in the principle of congruence (Antonakopolous, 2010).
As mentioned above, the majority of the companies within the DAX and MDAX environment report according to the IFRS. However, the local accounting principles still play a substantial
Change in revaluation surplus IAS 1.7 c / IAS 16.39
Remeasurement of defined benefit plans IAS 1.7 c / IAS 19.120 c
Gains/Losses of OCI from equity investments IAS 28.19 a
Gains/losses from currency translation adjustments IAS 1.7 c / IAS 21.32 Gains/losses from remeasuring available for sale securities IAS 1.7 d / IAS 39.55 b Effective portion of the gain or loss on cash flow hedges IAS 39.95-100
Effective portion of the gain or loss on a net investment IAS 39.102 a
Gains/losses of OCI from equity investments IAS 28.19 a
Items not subject to reclassification (IAS 1.96)
6
role for German companies. The “dirty surplus concept” of the IFRS is not fully applicable according to the German accounting rules represented in the Handelsgesetzbuch (HGB, German Commercial Code). According to HGB, the “clean surplus concept” is almost acquired where nearly all non-owner equity changes find their way into the profit and loss statement, regardless their nature or frequency. Therefore, the balance of the profit and loss statement represents nearly the overall success of a company and the congruence principle is achieved. Only some group currency translation adjustments are not reflected within the profit and loss statement according to HGB (Coenenberg, Haller and Schultze, 2014).
Regarding the presentation of OCI, we observe an attempt to tackle the lack of comparability between IFRS and US-GAAP statements. Therefore, the latest project regarding the presentation of income was done together with the Financial Accounting Standards Board (FASB) to achieve a certain degree of similarity in terms of OCI reporting (IASB, 2010). Zülch and Salewski (2010) expressed their opinion regarding the Exposure Draft published by the IASB in 2010 which deals with the presentation of items of OCI. They pointed out that the Exposure Draft does not tackle any problems regarding the question which items to include to the OCI. However, they welcomed the clear separation between items subject to reclassification and items which are not subject to reclassification as well as the proposal by the IASB to only allow a single statement approach as it would enhance comparability.
In addition to that, there is criticism regarding the fact that the IASB does not clearly indicate which items should be included to the profit and loss statement and which should be classified as items of OCI. Only the characteristic that OCI items are all unrealised ties them together. However, only unrealised gains appear entirely within the OCI while unrealised losses on revaluations on assets or intangible assets have to be recognized within the profit and loss statement. Adding this to the fact that the reclassification adjustments also do not follow a clear indication from the IASB, there is a high need for clarification (Antonakopoulos, 2010).
7 3. Literature Review
There is an ongoing debate amongst experts over whether the concept of comprehensive income, which includes OCI, is useful to investors. Besides that, numerous studies of OCI and its components have emerged.
An analysis amongst Euro Stoxx 50 companies has shown that companies report on average 4.16 OCI items within their statement of comprehensive income and pointed out a high fluctuation in value for those items between 2008 and 2013. Furthermore, a composition of OCI items amongst those companies shows that currency translation adjustments always play a decisive role amongst all items but vary heavily over the years. This study also points out certain extreme OCI values within the sample which are mainly financial institutions (Jarolim, 2015). A study amongst Hungarian companies regarding OCI has shown that currency translation adjustments appear to be one of the most frequent item amongst OCI items (Orbán, 2014). Müller and Reinke (2008) have found that currency translation adjustments, cash flow hedges and remeasurement of defined pension benefit plans represent the biggest portion of OCI in terms of frequency and value amongst DAX30; MDAX and SDAX companies in 2006. An analysis amongst German DAX companies in 2013 concluded that the OCI accounts for 27.88% on average of the total comprehensive income and can therefore be viewed as material. However, there is a high volatility between those figures.1 Furthermore, 22 of 30 companies reported a negative OCI. In addition to that, the study pointed out that each company reported currency translation adjustments which is not surprisingly due to the internationality of the big German companies. Furthermore, the position of remeasurement of defined pension benefit plans is found in each OCI statement of the sample (Hüttermann and Knappstein, 2014). Besides, analysis was made regarding the format of presentation of comprehensive income. S&P 500 companies, who report according to US-GAAP, mainly present comprehensive
8
income as two separate statements after the introduction of ASU 2011-05 which contains similar changes regarding the presentation of OCI as those enforced by the IASB. This supports the common belief that a single statement of comprehensive income might confuse financial statement users. In addition to that, there is no evidence that a positive or negative OCI figure leads automatically to a specific format of presentation (Kim, 2016).
Euro Stoxx 50 companies even entirely presented their comprehensive income as a two-statement approach between 2008 and 2013 (Jarolim, 2015).
All in all, it is still not clear from the empirical studies on whether comprehensive income should be reported in a single- or two-statement approach. Some argue that the net income figure should remain the bottom line and items of OCI should be added to it in a different statement. By doing so, the net income would still represent a concluding figure and would not be downgraded (Holzer and Ernst, 1999).
On the other hand, reporting comprehensive income within a single continuous statement provides equal treatment to all figures which contribute to the overall success (or failure) of a company (Cearns, 1999). The fact that even with a two-statement approach, companies are obliged to present the OCI right after the statement of profit and loss, brought many companies to express their concerns regarding a mandatory single statement approach (Urbanczik, 2012). In contrast, reporting within a single continuous statement of comprehensive income also increases the validity of the performance report as all non-owner movements within equity are represented and a comprehensible connection between balance sheet figures and profit and loss figures is established (AAA, 1997).
Kerkhoff and Diehm (2005), two members of the Deutsche Telekom (which is in the DAX30), were highly critical against the OCI reporting, pointing out no clear distinction between OCI and profit and loss items and stating a degradation of net income within a single statement. As
9
OCI items tend to bear high volatility, comprehensive income as a bottom line figure could confuse investors. However, they welcomed the separation within OCI.
Hüttermann and Knappstein (2014) found out that 29 of 30 companies in their sample of German DAX30 companies in 2013 reported both items subject to reclassification and items not subject to reclassification. Furthermore, there was no clear picture regarding the presentation of reclassification adjustments. Fourteen companies presented those adjustments within the statement of OCI, 15 within the notes and one directly after the statement. Furthermore, companies do not follow a clear route regarding the presentation of taxes. Eleven companies reported their OCI figures net of taxes, 13 before taxes. Six of them reported some of them net of taxes and some of them before taxes. The authors welcomed a presentation before taxes as it would enhance international comparability.
Haller, Ernstberger and Buchhauser (2008) pointed out that the size of OCI can determine its noticeability within a performance analysis of a company, especially when its value is absolute. Furthermore, they found that the consolidated OCI of the HDAX (150 biggest companies in Germany) was negative in 2006, despite being positive in 2005 and that the position of currency translation adjustments was the most frequent one within OCI during their analysed periods. All in all, they pointed out that there is a high volatility for each OCI position as most of them are dependent on external factors like exchange rates, interest rates and market rates.
An analysis amongst DAX30 companies between 2002 and 2004 with the old IAS 1 has shown that the net income figure often heavily varies from the comprehensive income figure. However, OCI positions have shown high volatility and can differ amongst industries. Changes in currency translation adjustments can often be directly tied to the value change of the Euro while changes in the fair value of available for sale securities can be tied to changes in the security markets. Remeasurement of defined benefit plans can be tied to life expectancies of employees (Lachnit and Müller, 2005).
10
To the best of our knowledge, no recent research for OCI was made for German companies. Adding this to the fact that those items are highly cyclical and a recent analysis is therefore needed, this research adds valuable insights for investors to the German company environment. The main contribution of this work includes the continuation of the OCI-research of Hüttermann and Knappstein (2014) in terms of several advanced statistical methods to display volatility, correlation and possible dependencies. This research addresses to investors to understand both the OCI-reporting patterns and its materiality within the statement of comprehensive income of German companies.
4. Methodology, Sample and Data
This Work Projectaims at portraying OCI reporting, namely, format of presentation, accounting choice, size and materiality, composition, volatility and detail within German large and mid-cap sized companies. Five research questions were outlined and answered with the help of univariate and bivariate statistics.
Research Question 1: What is the presentation format of German companies regarding OCI? This research question aims towards the format of presentation of comprehensive income. As described above, companies which report according to IFRS can choose on whether to report the comprehensive income within a single statement or within two separate but consecutive statements. Within this question, the proportion between the one- and two-statement approaches for the sample is analysed. Furthermore, the question whether the size of other comprehensive income in terms of value and the number of OCI-positions have an impact on the way of presentation is conducted with a Chi-Square Test. In addition to that, analysis regarding the presentation of tax and reclassification adjustments is conducted. With several Chi-Square-Tests, questions about dependency of company size and presentation choices are analysed.
11
Research Question 2: What is the size and materiality of OCI?
For this question, the total value of OCI within the analysed periods is calculated and compared with the total net income of the sample. Furthermore, the decisive role of OCI within total comprehensive income is displayed by figuring out the number of companies for which a negative OCI turned to a decrease of total comprehensive income despite their increase in net income. To truly reflect the materiality of OCI, the proportions of total OCI to total comprehensive income and its average value are calculated with figures on an absolute basis to avoid any cancellation of negative and positive figures.
Research Question 3: Which OCI items are the most material?
For this question, the content of OCI is analysed. The average number of OCI items is calculated. Furthermore, a ranking in terms of the size is developed for the positions within OCI. The question whether certain industries have specific patterns in terms of their OCI positions as well as their proportions is also addressed.
Research Question 4: How is the volatility within OCI?
To determine whether the change of total OCI of a company is correlated to the change of net income, a regression is conducted with the variables “%-change in OCI” and “%-change in net income” from each company of the sample to calculate the correlation coefficient. Furthermore, the question of volatility is addressed in several ways. The maximum and minimum total OCI values of the sample are presented for each period. The median of the percentage change of net income and total OCI is calculated to compare volatility. In order to assess volatility for a single company, different timeframes (5 and 10-year lifespan) were used to calculate the standard deviation of net income, total OCI and a single OCI item.
Research Question 5: Which subcategory of OCI can be viewed as more material? As companies are obliged to separate items which are subject to reclassification and items which are not subject to reclassification, there is an eligible question on how the ratio between
12
these two groups is and whether it changes over a certain period of time. Furthermore, this research question deals with the issue of whether there is a difference between mid-sized and large companies within the sample in terms of proportion and if we can observe any industry specific patterns. In addition to that, the question of volatility of the proportions is addressed. The initial sample comprises 80 companies from the most material standards of the stock market in Germany, DAX30 and MDAX. The DAX30 is the most significant index in Germany and contains thirty companies and the MDAX contains 50 mid-cap German companies (finanzen.net, 2017). To compare those companies in terms of OCI, several adjustments to the sample had to be made. First of all, only companies which prepare their year-end report according to IFRS were selected in order to enhance comparability as reporting OCI according to HGB or US-GAAP still differs from IFRS, thus two companies were left out. Furthermore, nine financial institutions were eliminated from the sample as their year-end report differs quite heavily from traditional industry companies in terms of specific positions, especially within the OCI. In addition to that, one company within the MDAX did not report OCI within the analysed periods and was therefore left out as well. Moreover, companies who do not prepare their year-end reporting to the 31st of December were eliminated to enhance comparability. Consequently, the original sample size of 80 companies was narrowed to 61. A detailed overview of the sample can be found in Annex 1. The industry landscape within the DAX30 and the MDAX is highly diverse. Nineteen per cent of the DAX30 and MDAX companies operate within the chemical and pharmaceutical sector, 18% within the manufacturing sector while 8% of the companies can be attributed to the real estate sector and 6% operate within the energy sector. This picture stays almost the same if we take a look at the two standards separately. An overview of the sample can be found in Annex 2. As one purpose of this Work Project is to give insights to the most recent data of OCI, the consolidated annual reports of 2016 from the companies’ website were used. In order to give insights about volatility within a short timeframe, the consolidated
13
annual reports of 2015 were used for comparison. As this research deals with presentation and disclosure of OCI, annual reports were chosen over databases as source of data. All the information was therefore hand collected and developed.2
Ninety percent of the German companies named their statements as proposed by the IASB in the analysed periods, namely “Consolidated Income Statement” and “Consolidated Statement of Comprehensive Income”. Examples of different names are “Consolidated Statement of Recognized Income and Expenses” or “Statement of Overall Result”. However, we can state that German companies have adopted a common pattern here.
5. Results
Presentation format of OCI for German companies (Research Question 1):
Ninety-five per cent of German companies reported their comprehensive income within two statements in the periods of 2015 and 2016 (See Annex 3). DAX30 companies even entirely reported their comprehensive income according to the two-statement approach while only three companies of the MDAX prepared a single statement.3 This result is consistent with the findings of Jarolim (2015) and Kim (2016). While the IASB expressed its favour towards a single statement approach, we can state that German companies do follow the “traditional approach”, having the net income as a bottom line item as Holzer and Ernst (1999) conducted. Therefore, we can assume that Kerkhoff and Diem (2005) were not the only ones in the German company environment who expressed their concerns regarding the pretentions of the IASB with respect to the mandatory single statement approach. Still, it is important to take a closer look at the few companies who reported their comprehensive income within a single statement. Specifically, there is a reasonable question behind the motives of preparing a unique statement. The respective three companies of the MDAX reported an OCI value on an absolute basis of roughly
2 The research created a database in Microsoft Excel where all calculations were made and which remains as a
contribution for future research about OCI.
14
€22 million in 2016, which results in a median of €6.8 million. The 36 remaining MDAX companies of the sample reported a median of €74 million on an absolute basis. Therefore, we can state that companies who report the comprehensive income within a single statement tend to have smaller total OCI values on an absolute basis. The three companies who report a single statement of comprehensive income reported on average 2.33 OCI positions in 2015 and 2016. The remaining MDAX companies report an average of 3.97 OCI positions. However, we can still not say that a low OCI value or few OCI positions automatically lead to the preparation of a single statement of comprehensive income. The lowest OCI values on an absolute basis were reported by companies who reported their comprehensive income with two statements.4 A Chi-Square-Test was conducted to determine if format of presentation and number of reported OCI positions are independent (H0). Under a level of significance of 95%, we have no reasons to reject H0 as a χ of 6.8 is below the critical value of 11.07. Hence, there is no direct dependency of number of reported OCI positions and format of presentation. In conformity with Kim (2016), we can therefore not state that a specific size of the OCI automatically leads to a specific presentation format within the German company environment.
The presentation of tax amounts within the OCI is, as described above, also subject to a certain freedom of choice. Thirty-seven per cent of German companies presented a separate tax amount for each item of OCI during the analysed periods. Thirty-two per cent present the positions already net of tax and 31% present a sum of tax on all items within each category of OCI (see Annex 4). Therefore, German companies do not show a clear preference when it comes to the presentation of tax amounts within OCI. These results are in line with Hüttermann and Knappstein (2014). To analyse whether company size (DAX30 or MDAX) and the way of presenting tax amounts for OCI is independent from each other, a Chi-Square-Test was conducted. With a level of significance of 95%, there is no reason to reject H0 (company size
15
and way of presenting tax is independent) as we observe a χ of 1.59, which is below the critical value of 5.991. Being a mid-sized company within the MDAX or a large company within the DAX30 does not automatically lead to a specific presentation of tax for OCI items.
Sixty per cent of German companies presented reclassification adjustments in their notes during the analysed period while 40% presented them directly in the statement of comprehensive income. Again, these findings are in line with Hüttermann and Knappstein (2014). To further analyse these findings, the question whether company size and the way of presenting reclassification adjustments are independent must be conducted with a Chi-Square-Test. With a 95% level of significance, we reject H0 (the two are independent) as χ is 4.66 and therefore above the critical value of 3.841. Being a mid-sized or large company does influence the way of presenting reclassification adjustments. Within the analysed periods, 57% of DAX30 companies presented reclassification adjustments within the OCI while only 31% of MDAX companies did so.
Finally, a Chi-Square-Test was performed to analyse the independency of tax presentation and presentation of reclassification adjustments. With a χ of 20.61 and a critical value of 5.991, we have to reject H0 under a level of significance of 95%. Therefore, we can observe that the way of presenting tax for OCI items and the way of presenting reclassification adjustments are dependent from each other, which Annex 5 also illustrates.
Size and materiality of OCI (Research Question 2):
The analysis of net income shows that most German companies were profitable during the periods of 2015 and 2016. Ninety-one per cent of the analysed DAX30 companies and 97% of the MDAX companies reported a positive net income in 2016, 96% and 90% did so in 2015. The total net income figure of all analysed DAX30 companies was €36,853 million in 2016 and €39,838 million in 2015, while the MDAX companies reported a total net income of €11,443 million in 2016 and €10,036 million in 2015. However, OCI values paint a different picture.
16
Both DAX30 and MDAX companies reported a negative total OCI value in 2016 (€-917 million and €-2,020 million respectively). Only 22 out of 62 companies (~35%) reported a positive OCI in 2016, while 53 (~85%) did so in 2015 (see Annex 6). These findings are in line with Hüttermann and Knappstein (2014). Forty-three companies (~70%) managed to increase their net income from 2015 to 2016. However, because of negative OCI figures, only ten companies (~16%) also managed to increase their “bottom line” comprehensive income. Therefore, we can already recognize a decisive role of OCI for a company’s profitability. However, if we want to truly analyse the impact of OCI on total comprehensive income, it is inalienable to use absolute figures. Since multiple negative figures within OCI can cancel each other out and therefore distort our findings, algebraic signs have to be ignored. German companies reported a total OCI on an absolute basis of €53,508 million in 2016 and €54,866 million in 2015. Large German companies from the DAX30 are the drivers of OCI as they reported €44,484 million of absolute OCI in 2016 while MDAX companies only reported €9,024 million (see Annex 7). This thesis is supported by the fact that average absolute OCI of DAX30 companies amounted to €2,022 million in 2016 while average absolute OCI of MDAX companies was only €231 million (see Annex 8). Still, OCI plays a substantial role for both groups of the sample. On an absolute basis, total OCI accounted for 36% and 43% of total comprehensive income for DAX30 in the years of 2016 and 2015 and 34% and 40% within the MDAX. Concluding, we can state that OCI can have a material effect within the profitability analysis, which was also observed for different periods and samples by Kuhner and Bothen (2016); Haller, Ernstberger and Buchhauser (2008) as well as Lachnit and Müller (2005).
Content of OCI (Research Question 3):
German DAX30 companies reported on average 4.45 OCI positions during the periods of 2015 and 2016 which are in line with Jarolim’s (2015) analysis of EuroStoxx 50 companies. MDAX companies reported an average of 3.85 positions during 2015 and 2016, stating that bigger
17
companies tend to report more OCI positions. The most frequent position within the DAX30 and MDAX environment is the reameasurement of defined benefit plans. All DAX30 companies and 90% of the MDAX companies reported a figure of it in 2016. However, 95% of DAX30 companies and 87% of MDAX companies also reported currency translation adjustments in 2016, which corresponds to the findings of Orbàn (2014). As Hüttermann and Knappstein (2014) pointed out, the fact that currency translation adjustments appear nearly in each statement is not surprisingly as most of the companies within our sample have subsidiaries in countries outside the Eurozone. In terms of value of the specific positions of the OCI, it is again helpful to use absolute figures to avoid any cancellation of negative and positive values. In 2016, remeasurement of defined benefit plans accounted for 45% of the total absolute OCI value of German companies, followed by 26% from currency translation adjustments and 22% from cash flow hedges (see Annex 9). These findings support the study of Müller and Reinke (2008) as those items dominate the OCI in terms of value. However, in 2015 we can observe that 34% of total OCI came from currency translation adjustments, 24% from cash flow hedges and only 30% from the remeasurement of defined benefit plans, showing the volatility of OCI items (see Annex 10). Furthermore, extreme OCI items of a single company can influence the whole value of the sample. In 2016, MDAX companies reported a total absolute value for cash flow hedges of €753 million, accounting for 9% of total OCI. In 2015, they reported a value of €5,044 million, accounting for 46% of total OCI. This huge number in 2015 was mostly due to Airbus, which reported a negative figure on cash flow hedges of €4,699 million (93% of the total cash flow hedges value of MDAX companies) in 2015. In 2016, the energy and manufacturing industry was dominant in terms of absolute net income as they both accounted for 27% of total absolute net income (see Annex 11). However, the manufacturing industry even accounted for 42% of total absolute OCI in 2016 and therefore plays a decisive role in terms of OCI (see Annex 12). Especially the position of remeasurement of defined benefit plans
18
stands out. Within the DAX30 environment, the average absolute value of remeasurement of defined benefit plans for the four manufacturing companies was 1,968 million € in 2016 while the rest of the DAX30 companies had an average value of 647 million €. This is not surprisingly due to the fact that those four manufacturing companies occupied top positions in terms of number of employees in 2016 (de.stastista.com).
Volatility of OCI (Research Question 4):
The highest OCI reported in 2016 within the DAX30 amounted to €2,709 million, reported by E.ON. The lowest OCI in 2016 was reported by DHL and amounted to €-1.668 million. Contrary, the highest OCI in 2015 was €386 million, reported by RWE while the lowest one was €-490 million from Daimler. Within this short timeframe, maximum and minimum net income positions were achieved by the same companies (Daimler and E.ON), stating that total OCI value is subject to high volatility and not sustainable. A detailed chart regarding the movements can be found in Annex 13. From 2015 to 2016, we can observe a median for the change in net income of 11.31% for the whole sample. On the other hand, the median for total OCI change is -115%, reflecting the high volatility of OCI items. Even within industries, this phenomenon can be observed. The median change of net income for the manufacturing industry is 9.67% from 2015 to 2016 while OCI is -94%. Within the DAX environment, the median of the net income spread value from 2015 to 2016 is €105.7 million while the spread for OCI is €-482.7 million. MDAX companies highest positive change in OCI from 2015 to 2016 is 13,877% (K+S), while the highest negative change is -1,275% (Zalando). To assess whether the change of net income of the sample can be tied to the change of total OCI from 2015 to 2016, a correlation analysis is conducted. A regression provides us with a negative correlation coefficient of -0.0518, meaning that a negative change in OCI from 2015 to 2016 results in a positive change of net income. However, since the coefficient is very low, we can observe almost no correlation between the change of profit from the companies’ business activities and
19
its change in OCI in Germany. Furthermore, the standard error of 1848 reflects the high volatility of the sample itself. A large p-value of 0.69 contributes to the fact that, under a level of significance of 95%, the correlation coefficient is not statistically significant and there is no reason to reject H0.
Within a five-year analysis of net income and OCI of the DAX30 company Daimler AG, changes in net income occurred within the range of roughly €6,500 million and €8,800 million (€2,300 million), resulting in a mean value for net income of €8,000 million and a standard deviation of 939. On the other hand, we can observe high fluctuations of OCI during our five-year analysis, moving between figures of around €-3,600 million and €4,100 million (€7,700 million) with a mean value of €-326 million and a high standard deviation of 2,635 (see Annex 14). As Jarolim (2015) stated, especially currency translation adjustments appear to be extremely volatile. Within a 10-year analysis of Daimler AG, we can observe the high fluctuation of currency translation adjustments, having its negative peak in 2013 with €-1,531 million and its positive peak just one year after of €1,800 million in 2014. The overall mean results in €266 million with a high standard deviation of 994. Concluding, we can observe a high volatility of OCI itself and its positions within the German environment. External factors like market movements and exchange rate movements play a substantial role when it comes to the values of OCI positions as Lachnit and Müller (2005) already discovered.
Subcategories within OCI (Research Question 5):
As described in section 3, companies, who report according to the IFRS, are obliged to classify their OCI items into items which can be reclassified to the profit and loss statement in the future and items which will never be subject to reclassification. The introduction of this classification was the last major change regarding OCI from the IASB and companies were obliged to introduce it for periods beginning on or after 1st of July 2012 (Deloitte, 2011). It is interesting to see that only one company from the sample already introduced the classification of OCI items
20
in its annual report of 2012 (SAP), the rest did no early adoption and presented the classification from 2013 on. All German companies from the sample reported a value for the sum of items subject to reclassification for 2015 and 2016. This is not surprisingly since this category comprises a lot of OCI positions so that the chances are high that a large or mid-sized company reports at least one position of it. Fifty-seven out of 61 (93%) analysed companies reported a value for items not subject to reclassification in 2016, 56 did so in 2015. Especially some MDAX companies did not report values within this category as they sometimes do not have pension plans. However, we can state that the majority of German companies, especially DAX companies, reported both items subject to reclassification and items not subject to reclassification within the analysed periods. These findings are in line with Hüttermann and Knappstein (2014). The total value of items subject to reclassification for German companies in 2016 amounted to €15,866 million, which represents a sharp increase from the reported €5,939 million in 2015. On the other hand, the total value of items not subject to reclassification was -€18,803 million in 2016 and €10,133 million in 2015. These numbers again show the high volatility of OCI items, even within the two different groups. The high negative figure of items not subject to reclassification in 2016 resulted in an overall negative total OCI for the sample. In 2016, only three companies reported a positive figure for items not subject to reclassification while the other 95% reported negative figures.5 To truly analyse the proportions and therefore the materiality of the two subcategories, absolute figures have to be used. First of all, the total absolute value of items subject to reclassification in 2016 was €27,618 million while the value of items not subject to reclassification was €25,819 million. DAX30 companies occupied 87% of the total absolute value of items subject to reclassification and 79% of those who are not. This shows us again that company size in terms of total revenue is reflected within the OCI. In 2016 the mean value for the proportion of items subject to reclassification to the total absolute
21
OCI was 56%, so we can state that both categories were equally material. However, we have to acknowledge the fact that there are certain extreme values within our sample. Within the DAX30 environment, the highest proportion of items subject to reclassification to total OCI was 99% (SAP) in 2016 while the lowest was 18% (Infineon). As stated above, some MDAX companies reported an OCI value consisting entirely of items subject to reclassification. Then again, the lowest value was also just 10% (Innogy). The standard deviation of the proportion of items subject to reclassification to total OCI on an absolute basis is 0.27 in 2016. This underlines the inconsistency of proportions between the two classifications within the German company environment. A detailed graph of the proportions within the DAX30 environment in 2016 can be found in Annex 15. In addition to that, the proportions change significantly over the two analysed periods. In 2015, 74% of the total absolute OCI value resulted through items subject to reclassification. The same results can be observed in the various industries. Forty-six per cent of the total OCI value from the manufacturing companies of the sample were items subject to reclassification, while the value was 69% in 2015. Even within one industry, we can still observe a rather high standard deviation of 0.18 in 2016 and 0.19 in 2015. The pharmaceutical and chemical industry had 43% of total absolute OCI accounted for items subject to reclassification in 2016 and 59% in 2015 with a standard deviation of 0.21 and 0.20. Concluding even within industries, we cannot paint a consistent picture of the proportions on an absolute basis. However, if we analyse a single company with regards to the proportions of items subject to reclassification to OCI on an absolute basis since the mandatory introduction of the revised IAS 1, we can observe a certain consistency. Daimler AG reported on average 55% of total absolute OCI to items subject to reclassification since 2013 with a standard deviation of just 0.07. We cannot provide a final statement about the materiality of the two different classifications as they can vary heavily over time and from company to company. Therefore,
22
both classifications can be viewed as material. Investors should especially keep an eye on items subject to reclassification as they can affect the profit and loss statement in the future.
6. Conclusion
This paper gave insights to the presentation patterns of OCI within the German company environment for the periods of 2015 and 2016. Furthermore, it presented the components of OCI and the proportions of its two subcategories, items subject to and items not subject to reclassification. According to this research, most German companies use the two-statement approach of comprehensive income and therefore present OCI separately from net income. There is no clear pattern regarding the presentation of tax and reclassification amounts within the OCI recognizable but the way of presenting reclassification adjustments is dependent on the size of the company. Furthermore, dependency between presentation of tax and presentation of reclassification adjustments was observed while there is no dependency between presentation of tax within OCI and company size. Remeasurement on defined benefit plans and foreign currency translation adjustments represent the biggest part of OCI for German companies. On an absolute basis, we could observe that total OCI plays a material role within total comprehensive income. However, this research observed high volatility for total OCI as well as within various different components of OCI and even within a single company. This study shows that none of the two subcategories was dominant in terms of absolute value within the analysed period for German companies. Again, we could observe high volatility regarding the proportions within our sample and over the analysed periods.
The main limitation arose from accounting choices regarding the presentation of tax effects and reclassification adjustments, so that the components of OCI had to be treated carefully in terms of comparability. Furthermore, high volatility in terms of value and extreme values itself within single companies were common and had to be acknowledged.
23
This paper gives three recommendations regarding OCI. First of all, regulators have to acknowledge the fact that German companies still follow the traditional way of reporting comprehensive income, which is the two-statement approach. Regardless of the efforts by the IASB to favour the single statement approach, companies still want to have the net income as a bottom line figure. Furthermore, the regulators should be more specific about the presentation of tax amounts and reclassification adjustments within the OCI. They should eliminate the freedom of choice to enhance comparability. Especially tax items should be presented consistently. The fact that there is no clear preference observable makes it hard for possible investors to compare both separate OCI items of different companies and the sum itself. With regards to a possible international comparison, pre-tax positions should be favoured. Lastly, regulators should be more specific about which items to include to OCI and which are not. In addition to that, they should be more consistent on how those items have to be treated. As this study has shown, OCI can play a substantial role within total comprehensive income. A specific standard could therefore be more helpful than simple references to other standards.
Future research on this topic can be conducted in many ways. First of all, financial institutions could be included in order to present the differences to industrial companies. Including smaller companies could also give interesting insights to their treatment of OCI. Furthermore, European companies could be included and a larger period would be helpful to show volatility of OCI. Finally, the fact that OCI items are often dependent on external factors should give the motivation to constantly conduct research on OCI in order to present its materiality for companies under the current economic environment.
24 References
American Accounting Association. 1997. “An Issues Paper on Comprehensive Income.” Accounting Horizons. 11(2): 120-126. Antonakopoulos, Nadine. 2010. „Der Entwurf des IASB zur verbesserten Darstellung des Other Comprehensive Income.“ Praxis der internationalen Rechnungslegung, 8: 217-220.
Antonakopoulos, Nadine. 2010. „Erfolgsquellenanalyse nach IFRS auf Basis des Gesamterfolgs (total comprehensive income).“ Zeitschrift für internationale und kapitalmarktorientierte Rechnungslegung. 03: 121-129.
Caerns, K. 1999. „Reporting Financial Performance: A proposed Approach”, G4+1 Special Report, Norwalk. Coenenberg, Haller and Schultze. 2014. Jahresabschluss und Jahresabschlussanalyse. Stuttgart: Schäffer-Poeschel.
Deloitte. 2011. „IASB issued amendments to IAS 1 on presentation of items of other comprehensive income”. Accessed November 28. https://www.iasplus.com/en/publications/global/ifrs-in-focus/2011/ias-1-oci
finanzen.net. 2017. „Dax30 Liste“. Accessed November 28. http://www.finanzen.net/index/DAX/30-Werte. finanzen.net. 2017. „MDAX aktuell“. Accessed November 28. http://www.finanzen.net/index/MDAX.
Haller, Ernstberger and Buchhauser. 2008. “Performance Reporting nach International Financial Reporting Standards – Empirische Untersuchung der Unternehmen des HDAX.“ Zeitschrift für internationale und kapitalmarktorientierte Rechnungslegung. 05: 314-325.
Holzer and Ernst. 1999. “(Other) Comprehensive Income und Non Ownership Movements in Equity – Erfassung und Ausweis des Jahresergebnisses und des Eigenkapitals nach US-GAAP und IAS.“ Die Wirtschaftsprüfung, 9: 353-370.
Hüttermann and Knappstein. 2014. „Darstellung und Bedeutung des other comprehensive income.“ Zeitschrift für internationale und kapitalmarktorientierte Rechnungslegung. 12: 586-593.
International Accounting Standards Board. 2015. International Financial Reporting Standards. London: Wiley.
International Accounting Standards Board. 2010. Exposure Draft on statement of comprehensive income. London: Wiley. Jarolim, Natascha. 2015. „The development of other comprehensive income 2008-2013.” ACRN Journal of Finance and Risk Perspectives, 4(2): 43-62.
Kerkhoff and Diem. 2005. „Performance Reporting: Konzepte und Tendenzen im kommenden FASB-/IASB-Standard.“ Zeitschrift für internationale und kapitalmarktorientierte Rechnungslegung. 09: 342-350.
Kim, Jung Hoon. 2016. “Presentation formats of other comprehensive income after accounting standards update 2011-05”. Research in Accounting Regulation, 28: 118-122.
Kuhner and Bothen. 2016: „Die Bedeutung des Other Comprehensive Income – Positionen vor dem Hintergrund der Neuformulierung des IASB-Framework.“ Zeitschrift für internationale und kapitalmarktorientierte Rechnungslegung. 04: 161-168.
Kütting and Weber. 2015. Die Bilanzanalyse. Stuttgart: Schäffer-Poeschel.
Lachnit and Müller. 2005. „Other comprehensive income nach HGB, IFRS und US-GAAP – Konzeption und Nutzung im Rahmen der Jahresabschlussanalyse.“ Der Betrieb. 31: 1637ff.
Müller and Reinke. 2008. “Other Comprehensive Income nach IFRS im DAX, MDAX und SDAX.” Praxis der internationalen Rechnungslegung, 8: 258-267.
Orbán, Ildiko. 2014. “Role and significance of other comprehensive income - in respect of reporting companies’ performance. Sellhorn, Pellens, Füllbier and Gassen. 2017. Internationale Rechnungslegung. Stuttgart: Schäffer-Poeschel.
Statista. 2017. “Anzahl der weltweiten Mitarbeiter der Dax-Konzerne in den Jahren von 2014-2016.“ Accessed November 28. https://de.statista.com/statistik/daten/studie/75498/umfrage/anzahl-der-weltweiten-mitarbeiter-der-dax-konzerne/.
Urbanczik, Patrick. 2012. „Presentation of Items of Other Comprehensive Income – Amendments to IAS 1 – Überblick und Auswirkungen.” Zeitschrift für internationale und kapitalmarktorientierte Rechnungslegung. 06: 269-274.
Wall Street Journal. 2016. “One More Reason for Investors to Worry About Earnings Before Bad Stuff”. Accessed November 28. https://www.wsj.com/articles/one-more-reason-for-investors-to-worry-about-earnings-before-bad-stuff-1470261290. Zülch and Salewski. 2010. „Das Joint Financial Statement Presentation Project von IASB und FASB.” Zeitschrift für internationale und kapitalmarktorientierte Rechnungslegung. 09: 425-428.
25 Appendix 80 -2 Fresenius Krones -7 Thyssen Krupp Siemens Aurubis AG Hella KGaA Hueck Metro AG Steinhoff Int. Holdings Südzucker AG -9 Commerzbank Deutsche Bank Allianz Munich Re Deutsche Börse Aereal Bank AG Deutsche Pfandbrief AG Hannover Rück SE Talanx AG -1 Symrise 61 Annex 1: Sample
Final sample size: Companies who do not report according to IFRS:
Original sample size:
Companies with different date for year-end reporting:
Financial Institutions: