A Work Project, presented as part of the requirements for the Award of a Masters Degree in Management from the NOVA – School of Business and Economics.
Reporting Comprehensive Income
–
Evidence from
Portuguese Listed Companies
Catarina Falcão Amorim Student Nr. 1220
Under the supervision of: Leonor Ferreira
2 Abstract
This research aims to provide evidence about Comprehensive Income and better understanding the concept, its importance and the practices of reporting. Hence, this paper analyzes the annual reports referencing 2012 of listed companies in Portugal to get insight about Comprehensive Income reporting. The findings suggest that there is one item that excels from the others, as well as one format is more common than the other. The results also suggest that despite its relevance, Comprehensive Income is noticeable compared to Net Income. Current reporting standards in force as well as legal frameworks are vague and difficult transparency and homogeneity between companies.
Key words: Financial Reporting, Comprehensive Income, IAS 1, Euronext Lisbon
1. Introduction
The purpose of this research is to get insight and evidence about reporting of Comprehensive Income, namely to conclude about the noticeability of this change in equity and each item that composes it, and get insight about presentation preferences.
Comprehensive income or Total Comprehensive Income can be defined as “net income
plus all other non-income statement, non-owner related transactions” (Cahan et al, 2000). Despite being mandatory, Comprehensive Income is an undervalued statement in
companies’ performance analysis and even neglected by the regulators. Given its fairly
recent nature, it is still a strange concept to most and for some even unknown. This paper aims to give insight financial reporting of Comprehensive Income by analyzing the companies listed in Euronext Lisbon, stock exchange part of the NYSE Euronext group.
3
study. Section 3 is composed by a two-fold literature review, with a summary of the regulation in force, and another division focused on prior research about the topic. Section 4 states the research questions, describes the methodology and data used to answer these. Section 5 briefly displays and discusses the results. Finally, section 6 reviews the main conclusions, explains limitations of this research, adds recommendations, and possible topics for future research.
2. What is Comprehensive Income?
Comprehensive Income is broadly defined as “the change in equity from non-owner
sources”, in other words, the income of a company from any transaction that does not
involve an owner’s investment. An example of such transaction would be a pension or
post-retirement benefit plan gain/loss (actuarial gain or loss) in accordance with IAS 191. Some items defined by the International Accounting Standards Board (IASB) can be more important than others. This possibility will be concluded by analyzing the frequency of each item and its impact in Comprehensive Income.
It is worth mention that these changes in equity, present in Comprehensive Income, are
also disclosed in the owners’ equity statement. The reasons for IASB, and others
before2, to include Comprehensive Income as a mandatory statement rather than having these variations explained just in the owners’ equity statement, are far from being reasonable to all. Previous research found that Comprehensive Income is more decision usefulness than Net Income (Biddle and Choi, 2004) and shows a more broad/complete result to the shareholder. To understand better the previous statement, this paper will analyze the noticeability of Comprehensive Income to understand the impact of Other
1
IAS 19 Employee Benefits outlines the accounting requirements for employee benefits, such as wages, salaries, annual leave, post-employment benefits, and termination benefits.
2
4
Comprehensive Income and its materiality (compared with Total Comprehensive Income). According to the dictionary3, noticeable means worthy or deserving notice or attention. Hence, it is possible to understand the noticeability of Comprehensive Income by comparing the traditional Income statement’s result (Net Income) with the value of Other Comprehensive Income.
According to IAS 1 (published in EU regulation), income statement is part of the set of financial statements which presentation is compulsory. To the best of our knowledge, there is not prior research about the practices of reporting Comprehensive Income in Portugal. Thus, this research adds evidence to the existing literature.
3. Literature review
This section is two folded: it refers to the regulation about Comprehensive income and summarizes the empirical papers related with the topic.
3.1Regulation
Several regulatory accounting systems apply to Portuguese companies currently. Out of them it is worth mention the System of Accounting Standardization (SNC - Sistema de Normalização Contabilística) and the IAS /IFRS (International Accounting Standards / International Financial Reporting Standards). The former set of accounting regulation, SNC, was issued by the Portuguese Accounting Standardization Commission (CNC, Comissão de Normalização Contabilística) and should be applied in the financial reporting by companies, either public or private, above certain size, obliged to account in Portugal4. There are exceptions to these, such as, insurance companies; banks and other financial research institutions; and all companies whose securities are traded in a
3 http://dictionary.reference.com/browse/noticeable (accessed on January 3rd, 2014) 4
5
regulated market and have to present consolidated results from its subsidiaries. For the latter, IAS /IFRS should apply for years beginning after the 1st of January 2005, and it is an option for the subsidiaries of the listed companies.
According to IAS/IFRS, the primary financial statement should include five reports as follows: a statement of other comprehensive income (or an income statement and a statement of comprehensive income separately); a statement of changes in equity; a statement of financial position (balance sheet); a statement of cash flows; and explanatory notes [IAS 1.10].
IAS 1 was revised in 2007 to replace the traditional income statement by a statement of (other) comprehensive income. The International Accounting Standards Board (IASB) defines Total Comprehensive Income as: “the change in equity during a period resulting from transactions and other events, other than those changes resulting from transactions with owners in their capacity as owners. Total comprehensive income comprises all components of profit or loss and of other comprehensive income”.5 (Total) Comprehensive Income (CI or Total CI) combines both traditional Net Income (NI) and Other Comprehensive Income (OCI), such as the following formula [1] states:
CI = NI + OCI [1]
OCI comprises all changes that bypass the Income statement and are directly recognized in equity. According to IASB, items that should be incorporated in OCI include:
(a) changes in revaluation surplus (see IAS 16 Property, Plant and Equipment and IAS 38 Intangible Assets);
5
6
(b) actuarial gains and losses on defined benefit plans recognized in accordance with paragraph 93A of IAS 19 Employee Benefits;
(c) gains and losses arising from translating the financial statements of a foreign operation (see IAS 21 The Effects of Changes in Foreign Exchange Rates);
(d) gains and losses on re-measuring available-for-sale financial assets (see IAS 39 Financial Instruments: Recognition and Measurement);
(e) the effective portion of gains and losses on hedging instruments in a cash flow hedge (see IAS 39).
Besides giving the option for the format chosen, IAS 1 also gives freedom to the company to decide on the titles given to the statements [IAS 1 paragraph 8]. In spite of this opportunity, the Board makes clear that OCI statement should have tax effects clearly disclosed. Either by presenting components net from taxes, or by disclosing tax effect for each component in a separated line [IAS 1 paragraph 91]. However the regulation in force does not specify the format to be followed and so preparers are free to choose among the available models (see annex 3). Once it is not completely known which formats are being used, this paper aims at analyzing the practice of reporting comprehensive income by Portuguese listed companies.
7
As pointed by Fiori et al. (2011) the fact that European standard setters began its regulation much later than its American counterparts may have led to this lack of European information about Comprehensive Income. Whereas the FASB has required US firms to present Other Comprehensive Income since 1997, the IASB only did so in 2007, through the implementation of IAS 1 revised.
IAS 1 revised in 2007 brings the substitution of the traditional income statement with the comprehensive income statement for periods beginning on or after 1st January 2009. In this standard, the board presents the option of choice in terms of presentation between a single statement (see annex 3), called Statement of Comprehensive Income which contains both results on earnings, or two separate statements (see annex 3), named Separate Income Statement and Statement of Comprehensive Income. The first option is composed by a statement that reports the profit and loss of the company at first, and then, the final part includes the other comprehensive income components. The second choice is composed by two statements: a first statement displaying components of profit (loss) of the company, as in a traditional Net Income statement, and a second statement that details the profit (or loss) of the company of other comprehensive income (Ferraro, 2011).
3.2. Empirical Studies
8
additional empirical research to find a common conclusion. There have been researches that support that both net income and comprehensive income are decision-useful and these studies suggest that CI is more decision relevant for assessing share returns while traditional net income is more decision relevant for setting executive bonus incentives (Elliot and Elliot, 2013). However, this would not be very effective since only one component of OCI has an association with the share price and not much significance was found (Ringström and Ekström, 2012).
Although relevance is an important matter, it is a constant changing opinion and vision that may vary from company to company and from investor to investor. However, as Ketz (1999) mentioned, it is important that companies publish some explanation of
these gains and losses disclosed in CI, to help the reader’s interpretation of the numbers.
The main reason for IASB (and before FASB) to introduce the new income outline is due to an increasing demand by investors for disclosure of the fair value of capital assets (Cillioni et al., 2013).
The difference between NI and CI is that the latter allows predicting the future performance, because not only it takes into account the realized incomes, but also the unrealized ones that are prone to be realized in the future (Solomon and Dragomirescu, 2009).
9
Rahman and Hmadan (2012) concluded that “Gains and losses arising from translating the financial statements of a foreign operation” is the most common component of OCI
among Malaysian companies. Furthermore, they found that “Gains and losses on re
-measuring available-for-sale financial assets” was the second most common item in their sample, and then, that the combination of those components would make NI vary substantially for 37% of the companies tested.
Given the possibility of choice of the presentation format by the regulation, several studies in different countries try to explain and predict the format that companies chose to present their comprehensive income. Rahman and Hmadan (2012) conducted a companies listed on the Bursa Malaysia (Malaysian Stock Exchange) and found that most companies chose the combined statement of net income and comprehensive income, and therefore use a single statement of comprehensive income to present their financial statements.
With respect to the same option between formats of presentation, Ferraro (2011) conducted a study in Italy recording the choice made by the listed companies for their 2009 financial statements and found that the majority of companies use the two-statement option rather than a single two-statement as in Malaysia. These discrepant discoveries may be possibly explained with culture matters and differences in regulation entities, but would need further investigation for a conclusive answer.
10
statement of changes in stockholders’ equity. Both first and second options are very
similar to the ones existing in IAS 1. However, the third option makes OCI even more
‘hidden’ from the Income Statement for the common eyes. From the 73 companies that
composed the authors’ sample, the majority (39) choose to present CI under the
Statement of Stockholder’s equity. Then, 22 companies chose the second option and
presented a separated statement of CI, and 12 presented under the first option, a combined statement of NI and CI. Additionally, Campbell et al. (1999) correlate the
format used with the companies’ results, and found that companies that had positive and
material amounts of OCI where the ones that chose the first option, and thus, intend to enhance CI. While the companies that had negative and material amounts of OCI, where the companies that chose the third format and wish to demote these negative variations,
by disclosing them under the Statement of Stockholders’ equity.
Despite Campbell et al. (1999) findings, later on, Bhamornsiri and Wiggins (2001), to have a wider perspective of the option chosen by each company, conducted a study with the financial statements of S&P 100 companies for fiscal years between 1997 and 1999. They found that, regarding the comprehensive income presentation format, although
companies show a preference for representing CI in a “Statement of changes in
Stockholders’ Equity”, it does not depend on the income results. Therefore, the
empirical investigations conducted at level, on the search for a correlation between values of OCI and the format for presenting it in financial statements have been inconclusive.
11 4. Methodology and Data
This study aims to providing evidence about Comprehensive Income, adding to the existing literature information about financial reporting in Portugal, namely the format of presentation, the composition and impact of each component on the Total CI, and the noticeability of this statement/result to companies listed in the Portuguese capital market.
For this purpose, the following research questions have been formulated: RQ1: What is the format used to present CI?
In this question, the purpose is to simply find the frequency of use of each forma to present Comprehensive Income statement, provided that the regulation leaves room for companies to opt between two formats: a single statement, or a separated statement (See annex 3).
RQ2: Is there a relation between the format used and the reported value of CI? To answer this question, calculations are made to compare results between companies that used a single statement and companies that used a separate statement, in order to find a relation between the format of presentation and all components of Total Comprehensive Income.
RQ3: Which are the main OCI components?
12
RQ4:How noticeable is CI in companies’ financial reporting?
To answer to this question, first the Noticeability Index has to be formulated, by comparing Other Comprehensive Income with Net Income as formula [2] states:
Noticeability Index = OCI / NI [2]
An exploratory interview was done with an AUDITOR (see annex 2), and before starting,
the research questions were asked in informal conversations to many individuals, including auditors, users of financial reporting, and accounting students, to realize what did they know about CI. The interview helped to design the research and to the interpretation of the results found.
The initial sample selected for the analysis includes all companies with shares listed in the Euronext Lisbon, on December 31st 20126. This criterium to choose the sample is due to the fact that these companies prepare their consolidated financial statements according to IAS / IFRS, and thus should apply IAS 1 and report CI, as described in Section 2 of this research. Additionally the choice of this sample relies in the availability of their annual report online, and more credibility of these reports, which are subject to a double auditing. In order to respond to the research questions above, secondary data was collected. The period of analysis is the fiscal year of 2012, being the most recent data available, and the source of data for this analysis are the financial reports included in the annual report, which are available online, both through each
companies’ and the Portuguese Securities Market Commission7’s website. Data was
retrieved from both sources for validity purposes.
Forty nine companies were listed in Euronext Lisbon in the end of 2012. Out of them, one did not present consolidated reports, and therefore adopted the domestic accounting
6
http://www.deloitte.com/view/pt_PT/pt/iniciativas/investor-relations-governance-awards/categorias/empresas-cotadas/index.htm (accessed on September, 15th 2013)
7
13
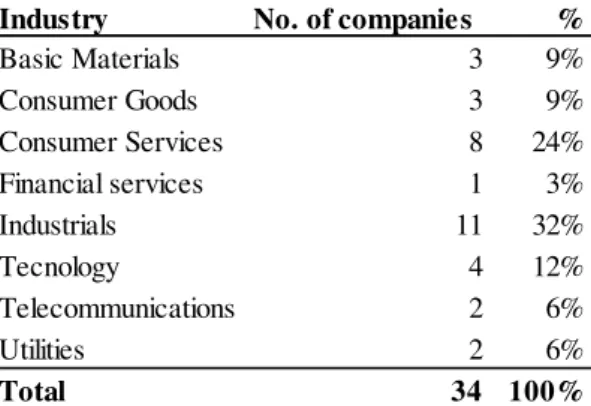
regulation SNC in its financial reports instead of IAS / IFRS, and thus is excluded from the final sample because of comparability problems. Three other companies in the sport related institutions (SAD) that report at a different period than the fiscal year were excluded as well from the sample. Additionally, financial institutions (banks) were excluded on the basis that their financial records are less homogenous than in other industries and would interfere with the results. Other three companies were left out because they did not present tax effect allocated to each item, and one other that did not disclose CI for non-controlling shareholders. The 34 companies included in the final sample for this study are classified by the Euronext Lisbon as shown in table i:
Table i – Number of companies in the sample by industry
In Annex 1 there is the composition of the sample used in this research.
It is worth notice that there is no homogenous and uniform expression followed by companies for grouping OCI components. For example, a common item presented is the
effect of applying the Equity Method (“Efeito da aplicação do método de equivalência
patrimonial”) without further explanation of the nature of changes in subsidiaries, the
reasons behind the change in equity. One must read carefully the explanatory notes because sometimes there is not even one specific note to explain this variation.
Industry No. of companies %
Basic Materials 3 9%
Consumer Goods 3 9%
Consumer Services 8 24%
Financial services 1 3%
Industrials 11 32%
Tecnology 4 12%
Telecommunications 2 6%
Utilities 2 6%
14
For analysis purposes, the classification of each item is as according, taking into account IAS 1, in the following five categories of changes of owners´ equity (codified from 1 to 5):
New Category
(Reclassification) Description
Reference to IAS
1 – Re-measuring financial
assets
Changes in available-for-sale financial assets and financial instruments (including hedging
instruments in a cash flow hedge)
IAS 39
2 - Exchange translation differences
Changes arising from translating financial statements from a foreign operation
IAS 21
3 - Revaluation surplus Changes in fair value of fixed tangible assets and
intangible assets
IAS 16; IAS 38)
4 - Actuarial gain/loss Changes on defined benefit plans IAS 19
5 - Other Items that the company did not specify
Analyzing the sample with 34 companies, only nine companies have positive OCI, five had OCI8 equal to zero, and the remaining 20 entities have negative OCI.
5. Results
The majority (29 out of 34) of the companies in the sample report values of OCI (different than zero), as the following chart shows in graphic i:
Graphic i – Percentage of companies that present OCI values
8
15
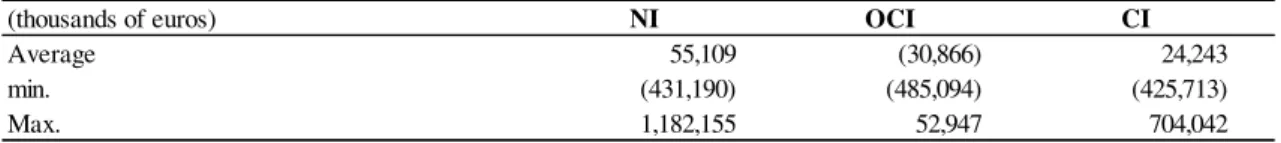
Table ii below shows that the average OCI has a negative impact on the total CI. In fact, as it shows later on, in table 3, all components of CI have negative average which leads evidently to a negative average of the total OCI.
Table ii – Average/Minimum/Maximum Net Income, Other Comprehensive Income and
Comprehensive Income of the sample (Thousands of Euros)
Format of presentation of Comprehensive Income (RESEARCH QUESTION 1):
As regards to the accounting format adopted to present CI by Portuguese companies, 27 companies (79%) of the sample choose to present components of OCI in a separate statement of CI. Only seven companies (21%) present CI in a single statement, together with NI (See Graphic ii). All five companies that had OCI equal to zero are included in the 21% that presented CI through a single statement. Only two companies with OCI different than zero used a single statement.9
Graphic ii – Percentage of companies that used each format
In spite of most companies using the same format of presentation, different titles are given to Comprehensive Income statement. The most common title is Comprehensive
9
Companies that used a single statement and with OCI different than zero: CIMPOR andSAG GEST
(thousands of euros) NI OCI CI
Average 55,109 (30,866) 24,243
min. (431,190) (485,094) (425,713)
16
Income consolidated statement (“Demonstração Consolidada do Rendimento Integral”). Regulators should make an effort to eliminate the subjectivity and encourage homogeneity between both the title and the format of presentation.
Relation between format and Comprehensive Income (RESEARCH QUESTION 2):
It is possible that by representing in a single statement, companies fear to lead an excessive focus on the final result, hence Comprehensive Income, rather than focus on Net Income. This could even create a growing demand by investors to explain the
‘numbers’ disclosed. The uncertainty and lack of knowledge about the subject should be
supported with direct and assertive guidelines by IASB, while writing the regulation. In order to confirm the above reflections, as well as to identify other possible reasons to choose one format or the other, one should analyze the differences in terms of NI and CI of companies that choose each format.
Table iii – Total and average of Net Income, Other Comprehensive Income and Comprehensive
Income for companies using each format
Similar to what Ferraro (2011) found, table iii shows how companies that opt for the first format are those with OCI values of little impact on the overall total. Indeed, more than 71% of these presented no OCI values for the period. Further, one of the two companies, that used a single statement, and presents OCI amounts, has negative NI but positive CI. It is possible that by using a single statement, the company is drawing the attention to a number representing ‘less losses’, as financial reporting is a powerful way
(thousands of euros)
Total Average Total Average Total Average
On the Income Statement (Single) (454,549) (64,936) (9,030) (1,290) (463,579) (66,226)
In a Separate statement 2,328,242 86,231 (1,040,400) (38,533) 1,287,843 47,698
CI OCI
17
of communicating information and by giving management freedom it may mislead the reader.
Due to the small number of companies that choose a single statement, it is not possible to generalize the conclusions about reasons behind their choice. Despite this, it is clear that in average, companies that choose the separated format had positive NI and negative OCI. By presenting both results in a single statement, this would focus the attention in the last figure (i.e. CI) which is lower than the intermediate one (i.e. NI). Other Comprehensive Income items (RESEARCH QUESTION 3):
Table iv – Other Comprehensive Income items’ effect (percentage and number of companies)
OCI items Positive effect No effect Negative effect Total
(n) % (n) % (n) %
(1) Re-measuring financial assets 9 26.5% 12 35.3% 13 38.2% 34
(2) Exchange translation differences 7 20.6% 9 26.5% 18 52.9% 34
(3) Revaluation surplus 2 5.9% 29 85.3% 3 8.8% 34
(4) Actuarial gain/loss 4 11.8% 27 79.4% 3 8.8% 34
(5) Other 4 11.8% 25 73.5% 5 14.7% 34
Total 26 102 42 170
Table v – Other Comprehensive Income items average
(thousands of euros) (1) (2) (3) (4) (5) OCI
Average (3,981) (20,585) (34) (5,334) (933) (30,866)
% 12.90% 66.69% 0.11% 17.28% 3.02% 100%
min. (68,776) (423,172) (4,866) (140,411) (26,576) (485,094)
Max. 17,364 66,180 3,433 10,680 1,276 52,947
18
has by far the biggest impact in CI, even though about 91% of item (2) comes from only two companies10.
These results are in line with those of Rahman and Hmadan (2012) found in the Malaysian market, in the sense that the most common item and the biggest impact arises from foreign translations. Given the current situation of Portuguese economy, companies expose themselves more in other countries, and by looking into the exchange rates variations of the three most common foreign country partners (Angola, Brazil and USA) during 2012, it is clear that, especially in relation with the Brazilian currency, the Euro weakens (See appendix 1). This means a negative effect in the financial statements of the Portuguese companies. These findings are in line with the opinion expressed in the exploratory interview by the AUDITOR who says that: “the market takes more into
account the gain/loss with Exchange conversion differences”,as the variation which is most important to the market (investors make more pressure on) is the one that causes
more impact in companies’ CI results.
The second item that is more present in OCI (64.7% of companies reported it) is the re-measurement of financial assets (codified as item 1). The “actuarial gain/loss” (item 4) is the least present in the Portuguese companies in the sample, with only 14.7% occurrence. The AUDITOR provides a possible explanation for this finding. It is her opinion that this is a form of benefit that most companies do not use anymore, most likely because it bears such a great cost. Table vi shows that individually, actuarial gain/loss, that is, item (4) has a significant impact in a company’s CI, even comparable to the effect from translating foreign operations, item (2). Then again, since only a few
10
19
companies hold such kind of benefits for employees, it is not a strong component in the
market’s average CI as a whole.
Another important note is that the item denominated as “Other” (item 5), although low, has a bigger average than item (3). This item (5) accounts for nearly 3% of OCI and should be a point of attention for regulators in the future.
Table vi – Weighted average of each Other Comprehensive Income item
Noticeability of Comprehensive Income (RESEARCH QUESTION 4):
Although the Portuguese market is not large enough and it is quite narrowed for one to make conclusions on it, it is possible to see from this sample if OCI has a significant impact in Total CI. This is, if OCI is large enough comparing with NI and the percentage of CI that is explained by OCI.
Table vii – Noticeability index and materiality
In table ii, it is already possible to see the average OCI and compare it with the average CI. However, to go a little further, the first figure of table vii, Noticeability Index, shows that, in absolute values, OCI is roughly 34% the size of NI. The second figure, Materiality, shows that near 38% of CI is explained by OCI while the other 62% is explained by NI. Either without taking into consideration if it is a positive or negative effect, it is clear that OCI will have a fair impact in the final income. If OCI is material, then it already gives a hint that it is “worth of notice”. Further investigation would be
(thousands of euros) (1) (2) (3) (4) (5)
Total (135,340) (699,882) (1,159) (181,340) (31,708)
No. 22 25 5 7 9
Average (6,152) (27,995) (232) (25,906) (3,523)
(absolute values) Noticeability Index Materiality
20
needed to understand if shareholders are aware of the noticeability of Comprehensive Income. Ultimately, despite its relevance, OCI will on average substantially affect Total CI, that is in reality a more complete outcome for equity owners.
6. Conclusion
The purpose of this research was to get insight and evidence about reporting of Comprehensive Income. This paper examined the reporting of Comprehensive Income by 34 Portuguese listed companies in 2012. According to the results of this research, Exchange differences arising from translating foreign operations is the main component of Other Comprehensive Income since it is the most common one and the one that has more impact. It is likely that companies try to draw the attention to Net Income, for the reason that it is usually higher than Total Comprehensive Income, and thus, rather present Comprehensive Income in a separated statement as this is the most common format of presentation. This study also suggests that Other Comprehensive Income items are noticeable, as at least one affects 27 out of the 34 companies, in the sense that it can create a significant impact in the final result, being able to change the
perspective of a company’s outcome to shareholders.
21
There are three main recommendations. The first, for regulators, is to raise awareness and encourage knowledge of Comprehensive Income by improving understandability of accounting standards, and thus, increase the homogeneity between companies. The second, for financial reporting makers, is to provide more information on explanatory notes about some of the variations present in Other Comprehensive Income, as the initial objective of this statement is to give more information about these specific equity changes. The third recommendation, directed to financial reports readers, is to be aware
of the subjectivity present in companies’ annual reports, whether from the format of
presentation chosen or to which information is disclosed in the notes to the financial statements.
22 References
Bhamornsiri, Sak; Wiggins, Casper (2001). Comprehensive Income Disclosures. The CPA
Journal.
Biddle, Gary C.; Choi, Jong-Hag (2004). Is Comprehensive Income Useful. Seoul National
University
Cahan, Steven F.; Courtenay, Stephen M.; Gronewoller, Paul L.; Upton, David R. (2000). Value Relevance of Mandated Comprehensive Income Disclosures. Journal of Business Finance & Accounting.
Campbell, Linda; Crawford, Dean; and Franz, Diana R. (1999). How companies are
complying with the comprehensive income disclosure requirements. The Ohio CPA Journal.
Cillioni, Andrea; Marinoni, Marco Angelo; Merino, Barbara (2013). Comprehensive
Income, An Historical Perspective. The Development Of Proprietorship And Entity Theories, An International Approach. European Journal of Accounting, Finance & Business.
Elliot, Barry and Elliot, Jamie. 2013. Financial Accounting and Reporting 16th edition.
Pearson
Ferraro, Olga (2011). Comprehensive Income in Italy: Reporting Preferences and Its Effects
on Performance Indicators. Journal of Modern Accounting and Auditing.
Fiori, Giovanni; Tiscini, Riccardo; Barrios, John Manuel; Fasan, Marco (2011). Other
Comprehensive Income and its Determinants In Continental Europe. SSRN
http://accountingexplained.com/financial/statements/comprehensive-income (accessed on December 4th of 2013)
http://www.accountingtools.com/other-comprehensive-income (accessed on December 4th of 2013)
http://www.iasplus.com/en/news/2010/May/news6048 (accessed on September 15th of 2013)
http://www.iasplus.com/en/standards/ias/ias1 (accessed on September 15th of 2013)
http://www.ifrs.org/Use-around-the-world/Documents/Jurisdiction-profiles/Portugal-IFRS-Profile.pdf (accessed on September 15th of 2013)
http://www.nysscpa.org/cpajournal/1996/1096/features/reportin.htm (accessed on December 4th of 2013)
Ketz, J. Edward (1999). Comprehensive Income: What do the numbers disclose?. The
Journal of Corporate Accounting and Finance.
Rahman, Azhar Abdul; Hmadan, Mohd Diah Hj (2012). Reporting Comprehensive Income -
Evidence from Malaysian ACE Market Companies. Universiti Utara Malaysia
Ringström, Elena; Ekström, Jörgen (2012). The value relevance of comprehensive income.
Master thesis, Uppsala University
Solomon, Daniela Cristina; Dragomirescu, Simona Elena (2009). New Dimensions in
23
Annexes
Annex 1
List of companies in Euronext Lisbon at
December, 31st of 2012: Present in sample?
List of companies in Euronext Lisbon at
December, 31st of 2012: Present in sample?
Altri SGPS, S.A. Yes
Inapa-Investimentos Participações e Gestão,
S.A. Yes
Banco BPI, S.A. Excluded - financial institution Jerónimo Martins,SGPS, S.A. Yes
Banco Comercial Português, S.A. Excluded - financial institution Lisgráfica - Impressão e Artes Gráficas, S.A. Yes
Banco Espírito Santo, S.A. Excluded - financial institution Martifer, SGPS, S.A. Yes
Banco Popular Español, S.A. Excluded - financial institution Mota-Engil, SGPS, S.A. Yes
Banco Santander Totta, S.A. Excluded - financial institution Novabase, SGPS, S.A. Yes
Banif, SGPS, S.A. Excluded - financial institution
Portucel - Empresa Produtora de Pasta e Papel, S.A.
Excluded - does not detail tax effect for each item
Brisa - Auto-Estradas de Portugal, S.A. Yes Portugal Telecom, SGPS, S.A. Yes
Cimpor Cimentos de Portugal SGPS, S.A. Yes Reditus - SGPS, S.A. Yes
Cofina SGPS S.A. Yes
REN - Redes Energéticas Nacionais, SGPS, S.A.
Excluded - does not detail tax effect for each item
Compta-Equipamentos e Serviços de
Informática, S.A. Yes
SAG GEST - Soluções Automóvel Globais,
SGPS, S.A. Yes
Corticeira Amorim, SGPS, S.A. Yes
Semapa - Sociedade de Investimento e Gestão,
SGPS, S.A. Yes
EDP - Energias de Portugal S.A. Yes Sociedade Comercial Orey Antunes Yes
EDP Renováveis, S.A. Yes Sonae Capital, SGPS, S.A. Yes
Espírito Santo Financial (Portugal) SGPS,S.A. Excluded - financial institution Sonae Indústria, SGPS, SA Yes
Estoril Sol, SGPS, S.A. Yes Sonae, SGPS, S.A.
Excluded - does not detail tax effect for each item
F. Ramada - Investimentos, SGPS, S.A. Yes SONAE.COM, SGPS, S.A. Yes
Futebol Clube do Porto - Futebol SAD
Excluded - different reporting
period Sport Lisboa e Benfica - Futebol, SAD
Excluded - different reporting period
Galp Energia SGPS, S.A.
Excluded - does not detail non owner interest
Sporting - Sociedade Desportiva de Futebol, SAD
Excluded - different reporting period
Glintt - Global Intelligent Technologies, SGPS,
S.A. Yes SUMOL+COMPAL, S.A. Yes
Grupo Media Capital, SGPS, S.A. Yes
Teixeira Duarte - Engenharia e Construções,
S.A. Yes
Grupo Soares da Costa, SGPS, S.A. Yes Toyota Caetano Portugal, S.A. Yes
Ibersol, SGPS, S.A. Yes VAA - Vista Alegre Atlantis, SGPS, S.A. Yes
Imobiliária Construtora Grão-Pará, S.A. Excluded - does not disclose CI
Zon Multimédia - Serviços de
Telecomunicações e Multimédia, SGPS, S.A. Yes
Impresa - Sociedade Gestora de Participações
24
Annex 2
Interview:
1. Which options do companies have when presenting it and what are usually the reasons behind their choice?
“I cannot really answer that question for all companies, but for the ones I know, we as auditors
provided a standard format to disclose CI but companies have their final opinion in that matter and
can change the presentation as they please.”
2. Which are the most important components in the comprehensive income?
“In my opinion, the market takes more into account the gain/loss with Exchange conversion
differences. In fact, by just searching the news days after the annual reports are published, you’ll
find specific focus on this item. About actuarial gain/loss for example, it is something very
incremental nowadays because most companies do not use this kind of benefits anymore.”
3. Is CI relevant to companies? Do they take CI into account in their performance evaluation? Do you agree?
“Since it is very extrinsic to the company and its management, it is not considered something
relevant for a company’s performance. Investors take into account usually the changes arising from
translating financial statements from foreign operations such as associated companies, as I said before, because it has usually a huge impact (good or bad). But besides that, they do not consider it
as a performance evaluator variable, and neither do I.”
4. Is the format chosen related to the importance given to CI?
“Perhaps, but I could not know for sure.”
5. Do companies try to manipulate it? (e.g. include costs that should be in net income) If yes, why do you think they do that?
“There is no exact answer because, yes, companies try to increase Net Income as possible. But on
the other hand, it is very clear which swaps should be considered in NI versus CI, for example. And, if by any reason, a company misplaces one item, it will be very quickly identified by the auditor and
the company must reclassify it.”
6. Is the regulation about comprehensive income clear?
“No, in fact, I still find companies that do not know which transactions should be included in Other
Comprehensive Income. When companies first started to present their accounts using IFRS and IAS, we as auditors supplied a standard format to present their financial statements, and at first, I found that most of my clients did not know how to fill the format and we had to change our approach to
something simpler and sometimes even explain.”
7. Is there a specific test to control/audit CI?
“No, there is not such specific test. However we do test the correctness of changes in equity that are
directly related to total value of OCI.”
25
Annex 3 - Example of format 1, a single statement (left) and example of format 2, separated statement (right)
Appendices
Appendix 1 – Exchange rates variation through 2012
EUR-AOA 2012
EUR-BRL 2012 EUR-USD 2012
Income Statement
Revenues x
Expenses (x)
Dividend income x
Gains on sales of securities x
Net Income xx
Statement of Comprehensive Income
Net Income xx
Other Comprehensive Income:
Foreign currency translation gains y
Reclassification adjustment y
Comprehensive Income xy Combined statement of Income and Comprehensive Income
Revenues x
Expenses (x)
Dividend income x
Gains on sales of securities x
Net Income xx
Other Comprehensive Income:
Foreign currency translation gains y
Reclassification adjustment y
26
Annex 2 – Data used for this research
Company Format Consolidated Net Income for
2012 (1) (2) (3) (4) (5)
Other Comprehensive Income Total Comprehensive Income
Altri Separated 52,205 € (4,961) € - € - € - € - € (4,961) € 47,244 € Brisa Separated 46,022 € (7,955) € (4,081) € - € 1,563 € (2,106) € (12,579) € 33,443 € Cimpor Single (431,190) € 622 € 5,376 € - € (521) € - € 5,477 € (425,713) € Cofina Separated 4,247 € 23 € (243) € - € - € - € (220) € 4,027 € Compta Separated (1,272) € - € 9 € - € - € - € 9 € (1,263) € Amorim Separated 31,733 € 197 € 939 € - € - € - € 1,136 € 32,869 € EDP Separated 1,182,155 € (68,776) € (268,926) € - € (140,411) € - € (478,113) € 704,042 € EDP Renováveis Separated 136,050 € (36,258) € (5,281) € - € 10 € - € (41,529) € 94,521 € Estoril Sol Single (8,986) € - € - € - € - € - € - € (8,986) € F. Ramada inv Separated 6,169 € - € 67 € - € - € - € 67 € 6,236 € Glintt Separated 1,375 € - € (0) € - € - € - € (0) € 1,375 € Media Capital Separated 11,939 € - € 35 € - € - € - € 35 € 11,974 € Soares da Costa Separated (47,512) € (13,413) € (1,289) € - € - € 15 € (14,687) € (62,199) € Ibersol Single 2,744 € - € - € - € - € - € - € 2,744 € Impresa Single (8,696) € - € - € - € - € - € - € (8,696) € Inapa Separated (5,856) € - € (123) € - € - € - € (123) € (5,979) € JM Separated 366,268 € (8,367) € 66,180 € (4,866) € - € - € 52,947 € 419,215 € Lisgráfica Single (7,654) € - € - € - € - € - € - € (7,654) € Martifer Separated (54,413) € (672) € 661 € - € - € - € (11) € (54,423) € Mota Engil Separated 74,007 € (6,025) € (6,013) € 3,433 € - € - € (8,605) € 65,401 € Novabase Single 9,761 € - € - € - € - € - € - € 9,761 € PT Separated 325,617 € 17,364 € (423,172) € - € (52,710) € (26,576) € (485,094) € (159,477) € Reditus Separated 1,067 € - € - € (260) € - € - € (260) € 807 € SAG gest Single (10,528) € 666 € (15,173) € - € - € - € (14,507) € (25,035) € Semapa Separated 170,560 € (8,702) € (10,399) € - € 10,680 € (3,382) € (11,804) € 158,756 € Orey Antunes Separated 9,037 € 3,325 € (39) € (255) € - € - € 3,031 € 12,068 € Sonae capital Separated (11,727) € (565) € (100) € - € - € (366) € (1,031) € (12,758) € Sonae indústria Separated (100,052) € (13) € (891) € - € - € - € (904) € (100,956) € Sonae.com Separated 75,432 € - € (1,476) € - € - € - € (1,476) € 73,956 € Sumol+Compal Separated 929 € (3,436) € - € - € - € (694) € (4,130) € (3,202) € Teixeira Duarte Separated 26,057 € 1,354 € (35,470) € - € - € 1,276 € (32,840) € (6,783) € Toyota Caetano Separated (3,089) € 88 € - € - € - € 122 € 210 € (2,879) € VAA Separated (3,554) € (111) € (15) € 789 € 50 € - € 713 € (2,841) € ZON Separated 34,849 € 276 € (458) € - € - € 2 € (180) € 34,669 €
Total 1,873,693 € (135,340) € (699,882) € (1,159) € (181,340) € (31,708) € (1,049,429) € 824,264 €
Average 55,109 € (3,981) € (20,585) € (34) € (5,334) € (933) € (30,866) € 24,243 €
Min (431,190) € (68,776) € (423,172) € (4,866) € (140,411) € (26,576) € (485,094) € (425,713) €
Max 1,182,155 € 17,364 € 66,180 € 3,433 € 10,680 € 1,276 € 52,947 € 704,042 €
Standard